|
|
Global GEF Indicator System These indicators were initially supposed to measure global impacts derived from GEF-funded initiatives to mitigate land degradation. However, during the Expert Advisory Group (EAG) meeting from 21-23 January 2008 in Bonn, Germany, a consensus emerged that the application of global-level indicators developed by the KM:Land initiative should be used for the purpose of prioritizing GEF resource allocation. The EAG placed emphasis on ensuring consistent measurements of these indicators so as to provide reliable and useful tools in support of resource allocation decisions. The indicators presented in the following profiles fall within different areas of the SLM conceptual framework developed for this project (Figure 1).
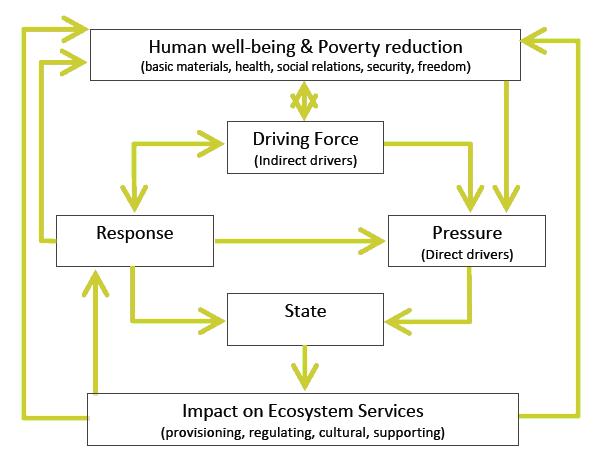
| Figure 1. The hybrid SLM framework merging the DPSIR and MA frameworks can guide the thematic management of knowledge in the LD FA. |
- Land Cover (“Global Land Cover, circa 2000”)
| This indicator measures current land cover, and more specifically the land cover types of greatest concern for land degradation. The distribution of 23 of the world’s major land cover categories are utilized, as classified by the FAO and UNEP’s Land Cover Classification System (LCCS). Several of the classes include: tree cover, needle-leaved, evergreen, regularly flooded, saline water, and so on. |
- Land Productivity (“Global Trend in Greenness (NDVI)”)
| This indicator proposes to identify regions with declining greenness as an early warning of possible land degradation in a particular area. Although the indicator is not definitive, it can help identify areas that require more fine-scaled investigation with regard to land degradation. As greenness trends help to identify areas in which vegetative cover or biomass productivity have changed, this indicator must attempt to control for exogenous climatic factors – such as fluctuations in rainfall, sunshine, temperature and length of the growing season, etc. |
| This indicator targets stress on water resources by measuring the ratio of withdrawals to availability. It is essentially a measure of the amount of pressure put on water resources and aquatic ecosystems by the users of these resources (eg. users, industries, power plants and agriculture). As irrigation represents up to 95 percent of all water withdrawn in several developing countries, this has major implications on downstream users and even food production and security. |
| This indicator measures the percent of the population in rural areas living in poverty. Individuals whose consumption (or income, when consumption is unavailable) falls below the rural poverty line are considered poor. |
- Income Distribution (“Distribution of Per Capita Income”)
| This indicator measures the poorest fifth’s share of national income (or consumption). This is essentially a measure of relative levels of inequality across different segments of the population. It addresses the inherent problem in the Rural Poverty Rate, which is that knowing the percentage of the population that falls below the national poverty lines does not provide sufficient information on the depth of that poverty. This is done through measuring the relative share of total national resources of those that are among the poorest segments of society. |
|
|