Strategies for Sustainable Land Management
in the East African Highlands

Strategies for Sustainable Land Management
in the East African Highlands
Edited by John Pender, Frank Place, and Simeon Ehui
In collaboration with
International Livestock
World Agroforestry
The World Bank
Research Institute
Centre
Published by
International Food Policy Research Institute
2033 K Street, N.W.
Washington, D.C.
Copyright ę 2006 International Food Policy Research Institute, International
Livestock Research Institute, World Agroforestry Centre, and The International
Bank for Reconstruction and Development/The World Bank. All rights
reserved. To reproduce the material contained herein requires express written
permission. To obtain permission, contact the Communications Division
<ifpri-copyright@cgiar.org>.
International Food Policy Research Institute
2033 K Street, N.W.
Washington, D.C. 20006ş1002
U.S.A.
Telephone +1ş202ş862ş5600
www.ifpri.org
An earlier version of Chapter 6, "Policies for livestock development in the
Ethiopian highlands" by S. Benin, S. Ehui, and J. L. Pender, appeared in Environ-
ment, Development and Sustainability (2003, Vol. 5, Issue 3/4, pp. 491ş510). The
current version appears with the permission of Kluwer Academic Publishers and
Springer Science and Business Media.
An earlier version of Chapter 7, by J. Pender, E. Nkonya, P. Jagger, D. Sserun-
kuuma, and H. Ssali, appeared as "Strategies to increase agricultural productivity
and reduce land degradation: Evidence from Uganda" in Agricultural Economics
(2004, Vol. 31, Issue 2/3, pp. 181ş195). The current version appears with the
permission of Blackwell Publishing.
How to cite this book: Pender, J., F. Place, and S. Ehui, eds. Strategies for
sustainable land management in the East African highlands. Washington, D.C.:
International Food Policy Research Institute.
DOI: 10.2499/0896297578
Library of Congress Cataloging-in-Publication Data
Strategies for sustainable land management in the East African highlands / edited
by: John Pender, Frank Place, and Simeon Ehui.
p. cm.
Includes bibliographical references and index.
ISBN 0-89629-757-8 (alk. paper)
1. Land use--Government policy--Africa, East. 2. Agriculture and state--
Africa, East. 3. Agriculture--Economic aspects--Africa, East. I. Pender, J.
II. Place, Frank, Dr. III. Ehui, S. (Simeon). IV. International Food Policy
Research Institute.
HD982.Z63S77 2006
333.7609676--dc22
2006021181
Contents
List of Tables vii
List of Figures xi
Foreword xiii
Acknowledgments xv
Chapter 1
Key Issues for the Sustainable Development of Smallholder
Agriculture in the East African Highlands 1
Frank Place, John Pender, and Simeon Ehui
Chapter 2
Conceptual Framework and Hypotheses 31
John Pender, Simeon Ehui, and Frank Place
Chapter 3
Development Pathways in Medium- to High-Potential Kenya:
A Meso-Level Analysis of Agricultural Patterns
and Determinants 59
Frank Place, Patti Kristjanson, Steve Staal, Russ Kruska,
Tineke deWolff, Robert Zomer, and E. C. Njuguna
Chapter 4
Village Stratification for Policy Analysis: Multiple Development
Domains in the Ethiopian Highlands of Tigray 81
Gideon Kruseman, Ruerd Ruben, and Girmay Tesfay
Chapter 5
Land Management, Crop Production, and Household
Income in the Highlands of Tigray, Northern Ethiopia:
An Econometric Analysis 107
John Pender and Berhanu Gebremedhin
Chapter 6
Policies for Livestock Development in the
Ethiopian Highlands 141
Samuel Benin, Simeon Ehui, and John Pender
vi
CONTENTS
Chapter 7
Strategies to Increase Agricultural Productivity and Reduce Land
Degradation in Uganda: An Econometric Analysis 165
John Pender, Ephraim Nkonya, Pamela Jagger, Dick Sserunkuuma,
and Henry Ssali
Chapter 8
Agricultural Enterprise and Land Management in the
Highlands of Kenya 191
Frank Place, Jemimah Njuki, Festus Murithi, and Fridah Mugo
Chapter 9
Policies and Programs Affecting Land Management
Practices, Input Use, and Productivity in the Highlands
of Amhara Region, Ethiopia 217
Samuel Benin
Chapter 10 Community Natural Resource Management in the
Highlands of Ethiopia 257
Berhanu Gebremedhin, John Pender, and Girmay Tesfay
Chapter 11 Influences of Programs and Organizations on the Adoption of
Sustainable Land Management Technologies in Uganda 277
Pamela Jagger and John Pender
Chapter 12 Zero Tillage or Reduced Tillage: The Key to Intensification
of the CropşLivestock System in Ethiopia 309
Jens B. Aune, Rahel Asrat, Dereje Asefa Teklehaimanot,
and Balesh Tulema Bune
Chapter 13 Land Management Options in Western Kenya and
Eastern Uganda 319
Robert Delve and Joshua Ramisch
Chapter 14 Policies for Poverty Reduction, Sustainable Land
Management, and Food Security: A Bioeconomic Model
with Market Imperfections 333
Stein Holden, Bekele Shiferaw, and John Pender
Chapter 15 Sustainable Land Management and Technology Adoption
in Eastern Uganda 357
Johannes Woelcke, Thomas Berger, and Soojin Park
Chapter 16 Strategies for Sustainable Land Management in the East African
Highlands: Conclusions and Implications 377
John Pender, Frank Place, and Simeon Ehui
References 417
Contributors 455
Index 459
Color figures follow page 30
Tables
1.1
Some indicators of agricultural performance in Ethiopia, Kenya,
and Uganda 27
2.1
Hypotheses about income strategies in different development domains
in the East African highlands 47
2.2
Summary of hypotheses 55
3.1
Description and importance of development domains in the
Kenya highlands 67
3.2
Percentage area under different land uses 69
3.3
Tobit regression of maize area and percentage of cultivated area
under maize 71
3.4
Tobit regressions of cash crop area and percentage of cultivated area
under cash crops 72
3.5
OLS regressions of density of cattle and dairy cattle 72
3.6
Tobit regressions of area under woodlots 73
3.7
Tobit regressions of ratio of high-quality roofs to total roofs 76
3.8
Tobit regressions of percentage tree cover 77
4.1
Factor analysis results for soil quality in agricultural potential 88
4.2
Factor analysis results for rainfall and altitude in agricultural potential 88
4.3
Factor analysis results for market access (distance) 89
4.4
Factor analysis results for market access (institutions) 89
4.5
Village stratification 93
viii
TABLES
4.6
Relation between crop choice and development domain dimensions using
three-stage least-squares 95
4.7
Relationship between livestock ownership and development
domain dimensions 97
4.8
Land use technologies 98
4.9
Relationship between technology choice and development
domain dimensions 100
4.10 Relationship between credit use and development domain dimensions,
by credit source 100
4.11 Relationship between human development indicators and development
domain dimensions 101
5.1
Descriptive statistics of households in Tigray highlands survey, 1998 115
5.2
Descriptive statistics of plots in Tigray highlands survey, 1998 117
5.3
Determinants of input use and land management practices in crop
production, 1998 118
5.4
Determinants of value of crop production per hectare, 1998 124
5.5
Determinants of per capita income, 1998 128
5.6
Simulated impacts of changes in selected variables on value of crop
production and per capita income 130
5.7
Summary of qualitative empirical results 132
6.1
Proportion of households owning livestock, by agricultural potential 145
6.2
Perceived changes since 1991 in use of feed resources and availability
and quality of grazing lands, by agricultural potential 146
6.3
Proportion of households buying feed and using animal health services,
by agricultural potential 147
6.4
Proportion of communities (with some of their residents) adopting
improved breeds and modern livestock management practices since 1991,
by agricultural potential 147
6.5
Means and standard errors of explanatory variables 152
6.6
Determinants of changes in proportion of households owning livestock,
1991 to 1999 153
6.7
Determinants of perceived changes since 1991 in use of feed resources and
availability and quality of grazing lands 156
TABLES
ix
6.8
Determinants of changes (1991 to 1999) in proportion of households
using animal health services and adoption of improved breeds and stall
feeding by communities since 1991 159
7.1
Descriptive statistics of variables used in econometric analysis 173
7.2
Determinants of output value and predicted erosion 177
7.3
Simulated impacts of changes in selected variables on outcomes 183
7.4
Simulated impacts of changes in selected variables on outcomes,
lowlands versus highlands (total effects) 184
8.1
Crop production in western Kenya for 17 villages in Siaya and
Vihiga districts 196
8.2
Livestock numbers in highland households of Siaya and Vihiga Districts,
western Kenya 198
8.3
Changes in crop cultivation before and after independence on the
southern slopes of Mt. Kenya 201
8.4
Difference in livestock numbers among farmer generations in
Embu District 203
8.5
Nutrient investments on major crops in the central highlands 204
8.6
Allocation of labor by major crop in Kirinyaga and Embu Disticts 206
8.7
Seasonal gross margin for farm enterprises in central Kenya 210
8.8
Contribution of different crop types to revenue generation 211
8.9
Summary of comparative analysis 212
8.10 Percentage of food consumption from own-farm production
in Siaya and Vihiga 213
9.1
Percentage of plots with investment by land tenure and redistribution
in the highlands of Amhara region, Ethiopia 224
9.2
Percentage of plots using land management practice by land tenure
and redistribution in the highlands of Amhara region, Ethiopia 225
9.3
Amounts of inputs used and value of output by land tenure and
redistribution in the highlands of Amhara region, Ethiopia 227
9.4
Detailed description and summary statistics of variables,
by agricultural potential 230
9.5
Probit regression results of use of land management practice by agricultural
potential in the highlands of Amhara region, Ethiopia, 1999 236
x
TABLES
9.6
Regression results of amounts of inputs used by agricultural potential
in the highlands of Amhara region, Ethiopia, 1999 242
9.7
Least-squares regression results of value of crop yield by agricultural
potential in the highlands of Amhara region, Ethiopia, 1999 245
10.1 Characteristics of community woodlots: Means
260
10.2 Characteristics and allowed uses of restricted grazing areas
261
10.3 Determinants of collective action and its effectiveness on
community woodlots, 1998 267
10.4 Determinants of collective action for grazing land
management, 1998 270
11.1 Average number of programs and organizations per LC1, 1990ş1999, and
household involvement in programs and organizations, 1990ş2000 282
11.2 Main focus of programs and organizations in relation to the proximate
and underlying causes of land degradation 285
11.3 Average number of programs and organizations per LC1,
1990ş1999, and household involvement in programs and
organizations, 1990ş2000, by sector 286
11.4 Main focus of programs and organizations by type
289
11.5 Household-level adoption of selected land management technologies, all
households, households in communities with programs or organizations
present, and households with involvement in organizations, 2000 290
11.6 Determinants of program or organization presence by main focus
between 1990 and 1999, probit estimation 294
11.7 Determinants of household involvement in programs and organizations
between 1990 and 2000, all households, probit estimation 296
11.8 Determinants of investment in selected land management practices,
probit estimation, 2000 301
12.1 Effect of tillage system on maize yields, 1999 and 2000
312
14.1 Average income by source and household group in Andit Tid, 1999
342
15.1 Selected output prices and input prices for Iganga District, 2001
361
15.2 Characteristics of the identified household groups
363
15.3 Feasibility of private and social goals under current market constraints
365
16.1 Summary of qualitative findings of Chapters 3ş15
380
Figures
1.1
Elevation map of the highlands of Ethiopia, Kenya, and Uganda 7
1.2
Agroclimatic potential in eastern and central Africa, based on length of
growing period 9
1.3
Population density in eastern and central Africa 14
1.4
Market access in eastern and central Africa, based on travel time to
nearest five markets, weighted by population of markets 16
2.1
Factors affecting income strategies, land management,
and their implications 32
2.2
Development domains in eastern and central Africa Color insert (after p. 30)
3.1
The highlands of Kenya Color insert
3.2
Development domains for the Kenya highlands Color insert
3.3
Cash crop area in the Kenya highlands Color insert
3.4
Percentage of area under tree cover in the Kenya highlands Color insert
4.1
Development domain dimensions: Population density
and market access 91
4.2
Development domain dimensions: Altitude and precipitation 92
4.3
Development domain dimensions: Soil quality and
degree of degradation 93
7.1
Agroclimatic potential for perennial crops Color insert
7.2
Classification of market access in Uganda 169
7.3
Study region and sample communities Color insert
xii
FIGURES
8.1
Map of primary study locations in the western Kenya and
central Kenya highlands Color insert
9.1
Classification of the highlands of Amhara region Color insert
11.1 Organizational presence and the potential for sustainable land management
technology adoption 291
13.1 Macronutrient balance for maize, grain, and stover production following
incorporation of 50 or 100 percent of the above-ground biomass of a
one-season sole crop fallow of Mucuna and Canavalia 325
14.1 Main components of bioeconomic household group model
338
14.2 Effects of improved access to credit, off-farm employment, and both
credit and off-farm employment 340
14.3 Effect of introducing food-for-work (FFW) when FFW is not used for
conservation, because of constrained access to the labor market or for
land conservation, and FFW does not reduce initial yields 344
14.4 Effect of food-for-work (FFW) when FFW is used for land conservation,
because of constrained access to the labor market, or for conservation,
and FFW does not reduce initial yields 346
14.5 Effect of planting of eucalyptus when off-farm employment is
unconstrained and conservation investment reduces initial yields 351
14.6 Impact of tree planting and food-for-work for land conservation when
off-farm employment is unconstrained and conservation investment
reduces initial yields 353
15.1 Sensitivity analysis of fertilizer price for semisubsistence
farm households 367
15.2 Sensitivity analysis of output prices for semisubsistence
farm households 369
15.3 "Combined effects" scenarios for the semisubsistence farm
household type 371
Foreword
Land degradation is a severe problem in the densely populated highlands of
East Africa and elsewhere on the African continent. Soil erosion resulting
from cultivation on steeply sloping terrain, mining of soil fertility due to
continuous cultivation with limited application of inorganic or organic sources of
soil nutrients, and deforestation and overgrazing of rangelands are among the key
factors causing low agricultural productivity, widespread poverty, and food insecu-
rity in the region. Finding ways to achieve more sustainable and productive land
management is an urgent need, requiring policy, institutional, and technological
strategies that are well targeted to the heterogeneous landscapes and diverse bio-
physical and socioeconomic contexts found in the East African highlands. This
volume helps to address this information need.
The book is based on papers originally presented at the conference "Policies
for Sustainable Land Management in the East African Highlands," held at the
headquarters of the United Nations Economic Commission for Africa (UNECA)
in Addis Ababa in April 2002. That conference was sponsored by the International
Food Policy Research Institute (IFPRI); the International Livestock Research Insti-
tute (ILRI); the World Agroforestry Centre (formerly ICRAF); the East and
Central Africa Program for Agricultural Policy Analysis (ECAPAPA); the African
Highlands Initiative (AHI); the Soil, Water and Nutrient Management Program
(SWNM) of the CGIAR; the United Nations Economic Commission for Africa
(UNECA); and the Regional Land Management Unit (RELMA) of the Swedish
International Development Cooperation Agency (Sida). The material focuses on
land management issues in Ethiopia, Kenya, and Uganda, which include most of
the people and area of the East African highlands.
xiv
FOREWORD
The book reports the results of a large number of careful empirical studies of
livelihoods and land management, showing that different strategies are needed for
different contexts in the East African highlands and illustrating promising options
for major development domains based on the theory of comparative advantage.
In areas of high agricultural potential and favorable market access, a virtuous circle
is possible, in which promotion of high-value commodities and nonfarm activities
can facilitate improved land management, as observed in central Kenya. Invest-
ments in infrastructure and market institutions, a supportive policy environment,
and efforts to address pest and disease problems are keys to success in such areas.
In areas of high agricultural potential but less favorable market access, less perishable
agricultural commodities--such as coffee and cereals--have comparative advantage.
The development of market infrastructure and institutions for these commodities
is particularly important, along with land management options, such as the pro-
motion of inorganic fertilizer and improved seeds. In areas of lower agricultural
potential, the comparative advantage is less in high-value crops or intensive cereal
production, except where irrigation is available, and more targeted use of costly
inputs is needed. Investments in livestock, tree planting, beekeeping, and other
livelihoods often yield higher returns in such environments, but they depend on
effective institutions to manage common property resources, such as grazing lands,
forests, and community woodlots, as well as community and household investments
in soil and water conservation.
Beyond the need to consider different long-run comparative advantages, the
studies in the book also demonstrate the importance of farmer-centered approaches
to agricultural technical assistance and credit, giving adequate attention to the
near-term profitability and risks of alternative approaches. Even well-intentioned
interventions can have negative impacts on smallholders where they are not well
suited to the needs and constraints of farmers.
The findings and implications of this book should be useful to policymakers
and practitioners seeking to address problems of natural resource degradation and
poverty in East Africa and elsewhere. Given the wide array of circumstances in the
East African highlands, the situations studied are representative of a much broader
set of circumstances. We hope that this study will contribute to productive policy
change to achieve more sustainable and poverty-reducing land management in devel-
oping countries in general.
Joachim von Braun
Director General, IFPRI
Acknowledgments
Many individuals and organizations contributed to the realization of this
book. First we thank all the authors who contributed chapters to the vol-
ume (see the list of contributors). We particularly appreciate their patience
since they first presented their papers in April 2002 at the Addis Ababa conference
"Policies for Sustainable Land Management in the East African Highlands," which
led to the publication of the book. We also thank the reviewers of the manuscript.
Their detailed and constructive comments greatly enhanced the quality of the chap-
ters in the book.
The April 2002 conference was made possible with the sponsorship of several
organizations, including the International Food Policy Research Institute (IFPRI);
the International Livestock Research Institute (ILRI); the World Agroforestry Cen-
tre (formerly ICRAF); the East and Central Africa Program for Agricultural Policy
Analysis (ECAPAPA); the African Highlands Initiative (AHI); the Soil, Water and
Nutrient Management Program (SWNM) of the CGIAR; the United Nations
Economic Commission for Africa (UNECA); and the Regional Land Management
Unit (RELMA) of the Swedish International Development Cooperation Agency
(Sida). We thank all of these organizations for their support of the conference and
the research that led to it.
Many of the chapters in the book report results of a long-term research project
carried out in Ethiopia by collaborators from IFPRI, ILRI, the Agricultural Uni-
versity of Norway (NLH), Wageningen University and Research Centre (WUR),
Mekelle University (MU), the Tigray National Region Bureau of Agriculture and
Natural Resources (TBANR), the Tigray Bureau of Planning and Economic
Development (TBOPED), the Amhara National Region Bureau of Agriculture and
Natural Resources (ANRBANR), the Oromiya Agricultural Development Bureau
xvi
ACKNOWLEDGMENTS
(OADB), and the Ethiopian Agricultural Research Organization (EARO). The
support provided to the research by the management and staff of these institutions
is greatly appreciated. In addition, we are grateful to the members of our national
advisory committee in Ethiopia--chaired by the vice minister of agriculture and
including representatives of bureaus of agriculture and bureaus of planning from
each of the three study regions and from the prime minister's office--who pro-
vided valuable guidance to the research. Funding for the research in Ethiopia was
made possible through the generous financial support of the Swiss Agency for
Development and Cooperation (SDC), the Norwegian Ministry of Foreign Affairs
(NoMFA), the Netherlands Ministry of Foreign Affairs (DGIC), the Department
for International Development (DfID) of the United Kingdom, the Government
of Japan, the Italian Development Cooperation (IDC), and the U.S. Agency for
International Development (USAID).
The research in Uganda was carried out by collaborators from IFPRI, the
Center for Development Research of the University of Bonn (ZEF), the Makerere
University Faculty of Agriculture (MUFA), the National Agricultural Research
Organization (NARO), and the Agricultural Policy Secretariat (APSEC). It was
made possible through the generous financial support of NoMFA, the German
Federal Ministry of Technical Cooperation (BMZ), USAID, and DfID. We are
especially grateful to MUFA, NARO, and APSEC for their collaboration in and
support of the research in Uganda, and to the members of our national advisory
committee, which was chaired by the dean of MUFA and included senior officials
representing the Ministry of Agriculture; NARO; APSEC; the National Environ-
mental Management Authority; the Ministry of Lands, Water and Environment; the
Uganda Soil Fertility Initiative; the Uganda Local Authorities Association; and the
Uganda National Farmers Association. We are also grateful to the International
Center for Tropical Agriculture (CIAT) and the African Highlands Initiative (AHI),
which collaborated with the IFPRI research team in their study sites in Iganga and
Kabale Districts, respectively.
The research in Kenya was carried out by collaborators from the World Agro-
forestry Centre, ILRI, the Kenya Agricultural Research Institute (KARI), and the
Department of Resource Surveys and Remote Sensing (DRSRS). The spatial
analysis research was funded in large part by AHI, to which we are very thankful.
The analysis of household-level land use and management was a synthesis of a large
body of work undertaken by the authors and by others in Kenya. The authors
thank the Government of The Netherlands, DANIDA, and the African Network
for Agroforestry Education, each of which provided funds for underlying fieldwork
by the authors. We also acknowledge the fine work undertaken by the Tegemeo
Research Institute, whose work we frequently cited.
ACKNOWLEDGMENTS
xvii
Most of all, we are grateful to the many smallholder farmers and community
leaders who patiently participated in our surveys and group interviews. We hope
that this book will help policymakers and other decisionmakers in East Africa and
beyond identify and implement more effective strategies to help rural people in the
highlands find effective and sustainable pathways out of poverty and natural resource
degradation. This book is dedicated to them.
The findings, interpretations, and conclusions expressed in this report do not
necessarily reflect those of the World Bank, the members of its Board of Executive
Directors, or the countries they represent, or those of IFPRI, ILRI, ICRAF, and
their Boards and supporting organizations.
John Pender, IFPRI
Frank Place, World Agroforestry Centre
Simeon Ehui, World Bank (formerly of ILRI)
C h a p t e r 1
Key Issues for the
Sustainable Development
of Smallholder Agriculture in
the East African Highlands
Frank Place, John Pender, and Simeon Ehui
This book includes a series of studies of income strategies, land use, and agri-
cultural dynamics and their impacts on welfare and natural resources in the
highlands of Ethiopia, Kenya, and Uganda. There are several reasons for
focusing on the highlands. First, the complex problems of severe poverty, low pro-
ductivity, and poor natural resource management seem to be the rule rather than
the exception. This is critical because the highlands support the majority of rural
populations in the region. Second, within the highlands are some of the most
densely populated areas in all of Africa. Thus, what happens in the highlands may
provide pertinent insights for what is likely to happen as population density
increases and agriculture intensifies in the rest of Africa in the future. Third, the
highlands also contain a wide variety of agro-climatic conditions, from the semi-
arid Tigray landscape to the lush humid highlands of Mt. Kenya, and vastly differ-
ent market opportunities. The varying population density, agricultural potential,
and market access conditions are representative of the variation found elsewhere in
Africa. And finally, within the highlands are not only many areas beset by problems
of poverty and low productivity but some real successes where farmers invest in
agriculture and improved resource management and generate significant profits.
Therefore, it is possible to understand how different conditions tend to lead to dif-
ferent evolution or intensification processes as well as which factors have been most
critical in enabling some communities and farmers to prosper.
2
FRANK PLACE, JOHN PENDER, AND SIMEON EHUI
Despite the favorable climate and natural resource base that describes a sizable
portion of the land area in East Africa, the region continues to languish with low
rates of economic growth and high rates of poverty. The World Bank estimates per
capita national income to be $100 in Ethiopia, $360 in Kenya, and $250 in
Uganda in 2002 (World Bank 2003). Relative to other countries, that places
Ethiopia among the most impoverished nations in the world. Similarly, the per-
centage of population undernourished in 1995 was 50 percent in Ethiopia, 40 per-
cent in Kenya, and about 28 percent in Uganda (FAO 1999). For Kenya, this
current situation reflects a stagnation or even deterioration during the late 1990s
and early 2000s. Kenya's macroeconomy was hampered by a withdrawal of Inter-
national Monetary Fund (IMF) support and complete lack of foreign direct invest-
ment. Overall, the Ethiopian economy has grown at a pace of 6 percent per annum
over the past decade (Federal Democratic Republic of Ethiopia 2002), but this is
tempered by periodic droughts and investment resources being diverted to the
Eritrean war in the late 1990s. Moreover, the per capita income and poverty figures
remind us just how far the economy has to go to bring forth significant poverty
reduction. Noticeable improvements have taken place in Uganda, with average
GDP growth rates of around 6 percent during the 1990s. However, this has not led
to widespread employment generation or agricultural growth, and rural poverty
rates are estimated to have increased from 37 to 42 percent from 1999 to 2002,
after falling from 1992 to 1999 (Republic of Uganda 2003).
Agriculture continues to be the main livelihood for the populations of these
countries. It is most important in Ethiopia, where 85 percent of the work force is
engaged in agriculture and produces about 45 percent of the total gross domestic
product (Demeke and Abebe 2003). In Uganda and Kenya, the percentage of
agricultural labor to total labor is 80 percent and 75 percent, respectively (FAO
2004). In these two countries, however, the industrial and service sectors are rela-
tively more developed and account for more than two-thirds of the value added in
the economy. As in the rest of Africa, the poor of East Africa are overwhelmingly
rural.
Although the highland areas of these countries include the most favorable
agricultural production areas, they are also characterized by disappointingly high
rates of poverty. Most of Ethiopia's population resides in the highlands, and, as will
be seen below, much of the highland areas are not of high agricultural potential. In
Kenya, there are stark contrasts in terms of poverty severity across the highlands.
Rates are relatively low in the central highlands, near Nairobi, but the western
Kenya highland districts (e.g., Vihiga, Kakamega, Kisii) are among the worst in
terms of percentage of the population in poverty and incidence of disease (Repub-
KEY ISSUES
3
lic of Kenya 2003). Already high poverty has been exacerbated by civil strife in
parts of the Ethiopian and Ugandan highlands. One of the reasons for high rates
of poverty is the extreme population density. The East African highlands contain
the most densely populated rural areas in Africa, resulting in small landholdings.
Another reason has to do with difficulties of transportation and communication
because the rugged and difficult terrain in highland areas greatly increases the costs
of establishing a dense road network.
Sadly, nonagricultural employment opportunities are not growing rapidly
enough (imperceptible change in some areas) to provide the engine for a viable
poverty reduction strategy for the short to medium term. Growth in the agricul-
tural sector where most of the work force is located is a must for poverty reduction.
For the countries as a whole, and for the highlands in particular, agricultural
growth must be through intensification of production because there are no addi-
tional productive lands to be brought under cultivation. But intensification is not
an easy task, as witnessed by the recent trends in smallholder communities of shrink-
ing average farm sizes, low investment in agriculture, stagnant crop productivity,
and visible signs of degrading resources. In fact, there are signs that the opposite is
occurring in large areas of the highlands, where high rates of soil erosion and nutri-
ent mining in many locations and farming systems have been reported (Bagoora
1988; Hurni 1988; Stoorvogel and Smaling 1990; B÷jo and Cassells 1995;
Tukahirwa 1996; Braun et al. 1997; Smaling, Nandwa, and Janssen 1997; Elias,
Morse, and Belshaw 1998; Van den Bosch et al. 1998; Wortmann and Kaizzi 1998;
Shepherd and Walsh 2002; Lesschen, Stoorvogel, and Smaling 2003; Nkonya et al.
2004, 2005b). Yet there is enormous potential for the highlands to be the food bas-
kets for the region and beyond.
There are some successes to be sure, such as smallholder dairy and cash crop
production in the central Kenya highlands (Minot and Ngigi 2004; Ngigi 2004).
There, relatively high levels of investment in agriculture take place, a large number
of profitable agricultural enterprises are adopted, a vibrant nonfarm economy has
developed, natural resource management has improved, and poverty rates are low
by regional standards. It is important to better understand the nature and causes of
the nexus of problems that characterize the highlands as well as the ways in which
successes have occurred. As will be seen throughout this book, there is no single
type of problem or solution that dominates across the highlands. Rather there are
different combinations of problems that result from numerous localized differ-
ences in terms of physical, climatic, ethnic, demographic, and economic factors.
This means the identification of effective poverty reduction strategies requires
attention to the prevailing circumstances, problems, and opportunities.
4
FRANK PLACE, JOHN PENDER, AND SIMEON EHUI
Key Objectives and Contributions of the Book
Objectives of This Book
The main objectives of the book are:
1. to identify different development pathways1 that may be attractive for com-
munities under different economic, political, agro-ecological, market, and
demographic contexts;
2. to identify promising technological options that can catalyze or propel these
development pathways; and
3. to identify the supporting policies and institutions that can lead to more effec-
tive management of community and household resources directly and through
technological change.
Contributions of This Book
In support of the objectives, the chapters undertake empirical analysis of the fol-
lowing main research issues:
1. the factors determining comparative advantages of different income strategies,
such as agricultural potential, access to markets and roads, and population
pressure, and the impacts of these factors on agriculture, land management,
and outcomes such as agricultural production, household income, and land
degradation;
2. the impacts of income strategies on farmers' agricultural and land management
practices and outcomes;
3. the impacts of agricultural and land management practices on outcomes; and
4. the impacts of numerous policy relevant factors--such as technical assistance
programs, credit, education, local organizations, and land tenure arrange-
ments--on agricultural and land management practices and outcomes.
This is not the first book to address these issues. Previous books have looked
at agricultural intensification processes (Vosti and Reardon 1997; Lee and Barrett
2000), natural resource management, and agricultural technology (Sanders, Rama-
swamy, and Shapiro 1995; Barrett, Place, and Aboud 2002). In general, the rele-
KEY ISSUES
5
vant existing literature comprises case studies that focus on analyses of household
behavior in a small number of villages. When synthesized, they are able to provide
insights into the importance of meso- and macro-level variables in shaping agricul-
tural processes, but because they were not designed to do so, their comparative
strength remains in assessing the importance of household-level factors. Even here,
there are some gaps in that the case studies have often emphasized a subset of deci-
sions undertaken by households, for example, technology adoption or soil man-
agement. There have been some recent studies focusing on specific factors affecting
natural resource management, such as property rights and land tenure (e.g., Otsuka
and Place 2001b) and the ability to attain collective action (e.g., Meinzen-Dick et al.
2002), but these have tended to have a more narrow focus.
This book provides evidence about how the different problems of poverty, low
productivity, and natural resource degradation are linked to one another at house-
hold and community (or meso) scales. It also shows how the particular set of local
problems and other conditions will lead to distinct comparative advantages. Such
comparative advantages further tend to influence the types of income strategies
and development pathways pursued by communities and the households within
them. The studies attempt to show how decisions on income strategies, land man-
agement, and technology adoption are linked as well as how they impact on welfare
and natural resources.
The book also recognizes that important conditioning factors or driving forces
manifest themselves at the landscape or community level as well as at the house-
hold or individual level. That is, some communities, by virtue of their remoteness,
may be poorer and have fewer growth opportunities than other more favorably
located communities. But even in favorable communities, some households will
lack sufficient skills or resources with which to seize available opportunities. Like-
wise, there are some households in unfavorable areas that are able to invest in agri-
culture and break out of poverty cycles. Attention to these distinctions permeates
throughout the problem and intervention analyses in the book.
The studies in the book are designed to tackle these issues. They cover wide
areas of the highlands with both meso- and micro-level data. Hence, important
variations in climate, market access, population pressure, land tenure systems, and
cultural practices have been purposefully included in data sets and analyzed. In
addition, quantitative analyses have been applied to assess the strength of tendencies
across varied sites as well as within sites sharing particular conditions. Within the
context of agriculture and natural resource management interventions, the studies
in this book also look broadly at a range of technical, institutional, and policy inter-
ventions. Indeed, other strengths of the book are its focus on exploring synergies
and tradeoffs among different interventions in order to address complex problems
6
FRANK PLACE, JOHN PENDER, AND SIMEON EHUI
as well as the need to alter sets of interventions to tackle diverse problem domains
in different parts of the highlands.
Description of the East African Highlands
In this section, we describe some of the important features of the highlands and the
national economic and political context in which highland households operate.
These correspond first to conditioning factors, that is, those factors that are beyond
the control of households, communities, and other decisionmakers and are largely
fixed over time, such as altitude, rainfall, and soil type. A second set corresponds to
what we call "driving forces," which are those variables that do change over time
and may be influenced by decisionmakers. These include population growth and
density, market access, and a host of government institutions and policies. We also
provide brief descriptions of the distinguishing features of the agricultural and nat-
ural resource sectors. At the end, a few remarks are made about what we consider
to be the key lessons from the description--some similarities, key differences, and
what are likely to be the important variables that drive different income strategies
and development pathways in the highlands that are to be explored in more detail
in the following chapters. Chapter 2 will then examine these same factors in the
framework of a conceptual model from which key hypotheses on causeşeffect rela-
tionships may be formulated.
The Geography of the East African Highlands
Altitude and topography. The highlands constitute a large share of land in East
Africa (consisting of Ethiopia, Kenya, Uganda, Rwanda, Burundi, and Northern
Tanzania). Defined at 1,200 meters above sea level, the highlands comprise about
23 percent of the land area but are home to an even larger share of the popula-
tion, 53 percent. The highlands are particularly important in Ethiopia, where they
comprise 40 percent of the land area and as much as 81 percent of the population
(Hoekstra and Corbett 1995; Alumira and Awiti 2000). In Kenya over half of
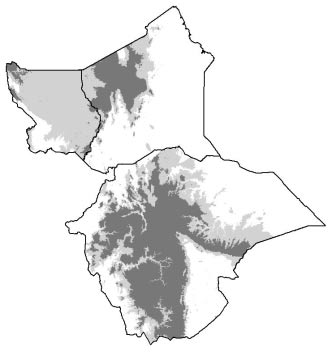
the population resides in highland areas. Figure 1.1 shows the areas of Ethiopia,
Kenya, and Uganda that are above 1,000 and 1,500 meters, respectively.
Another feature of the highlands is the wide variation in topography, often
within small geographic areas. Common landscapes include hilltops, steep and
moderately sloping land, relatively flat plateaus, and valley bottoms, both narrow
and wide. Sloping areas represent the most fragile lands in the highlands, as they are
highly susceptible to erosion, especially because intense rainfall events are common.
The topography leads to two important characteristics for farming. The first is
that the climate can change dramatically within several kilometers as a result of the
KEY ISSUES
7
Figure 1.1 Elevation map of the highlands of Ethiopia, Kenya, and Uganda
>1,500 meters above mean sea level
1,000ş1,500 meters above mean sea level
<1,000 meters above mean sea level
300
0
300
600
900 Kilometers
Source: Prepared by Meshack Nyabenge, World Agroforestry Centre.
effects of mountains on wind and rainfall patterns. This is observed near Mt. Kenya,
where the western slopes are dry compared to the humid southern and eastern
slopes. It is also commonly observed in Ethiopia, where pockets of lush vegetation
can be found within relatively dry zones (and vice versa). The second implication is
that because of the microvariations caused by slope and toposequence, villages and
even individual farmers are able to produce a range of crops.
8
FRANK PLACE, JOHN PENDER, AND SIMEON EHUI
Climate. There is considerable variation in the agricultural potential of high-
land areas. Some are characterized by high rainfall, two rainy seasons, and fertile
volcanic soils, whereas others have low and erratic rainfall with poor inherent soil
quality. The highlands for the most part have rainfall totals and patterns that com-
pare very favorably with the rest of Africa. Most of the highlands have average rains
of over 1,000 millimeters per year, and for many such sites, rainfall is distributed in
a way that allows two growing seasons. In the Ugandan and Kenyan highlands,
rainfall is generally 1,200 millimeters or more, rising to averages as high as 1,600
millimeters per year. There are some pockets of the Ugandan and Kenyan high-
lands that receive significantly less rainfall because of wind currents and mountain
effects (e.g., the west of Mt. Kenya, some portions of the Rift Valley in Kenya, and
the southeastern highlands in Uganda). Ethiopia is a different case. Its vast high-
land areas include a significant proportion of semiarid areas with rainfall as low as
400 millimeters per year in the northern and eastern parts of the region, whereas
parts of the southern and western highlands received more than 2,000 millimeters
per year. The rainfall patterns correspond well to variations in the length of the
growing period, and these are displayed in Figure 1.2 for all of East Africa. All areas
are prone to drought spells and torrential rains, both creating risks for agriculture.
In addition, hailstorms are a feature of some highland areas, and western Kenya is
particularly prone to such events (Place et al. 2004).
Temperatures in the highlands are moderated and do not normally exceed
30░C. Low temperatures may reach below 10░C at night, but frosts do not occur
except at very high elevations.
Land use. Much of the highlands is under agriculture because of its suitability
for cultivation and was settled by people early because it had a lower incidence of
human diseases such as malaria. In general, there has been substantial conversion
of forests and other natural habitats to agriculture. In both Kenya and Ethiopia,
between 80 and 85 percent of original forest cover has been removed to make way
for largely agricultural land uses (Earthtrends 2004). In Uganda, only 4 percent of
the original forest cover remains, and the converted areas include much of the
highlands. A study in medium-elevation central Uganda found that between
1960 and 1990, the share of woodland, forest, and bushland fell from 32 percent
to 20 percent to make way for agricultural expansion (Place, Ssenteza, and Otsuka
2001). Nonetheless, the highlands continue to host tropical closed forests that
remain important habitats for biodiversity and hosts of headwaters of major rivers,
although these are much smaller than previously. These areas represent only 4.0
percent of total land in Ethiopia, 1.9 percent in Kenya, and 3.8 percent in Uganda
(FAO 1995). In the drier portions of the highlands, such as in northern and eastern
KEY ISSUES
9
Figure 1.2 Agroclimatic potential in eastern and central Africa, based on length
of growing period
Low
Medium
High
Source: Adapted from Fischer et al. (2001).
10
FRANK PLACE, JOHN PENDER, AND SIMEON EHUI
Ethiopia or the Rift Valley of Kenya, some of the highlands are covered with low
dense woodland or bushland. In Ethiopia, because of the importance of livestock,
communities have kept a portion of land under rangeland. In summary, a large
proportion of the highlands is under agriculture, and cultivation in particular.
Nonetheless, management of natural resources in the highlands is concerned not
only with soil and water for agriculture but also with forest, woodland, and range-
land resources that can be vitally important locally.
Soils. There are a variety of soil types found in the highlands, such as nitosols,
cambisols, ferralsols, and lithosols, with none being dominant. In Kenya and
Uganda, most are relatively high in clay content and are deep. In fact, some moun-
tainous areas have nutrient-rich volcanic soils. As a consequence, most of the high-
lands of Kenya and Uganda are considered to be medium- to high-potential areas
and are expected to be major breadbasket regions. This is not the case in Ethiopia,
where, because of its extensive highland area, soils of both inherently high and low
potential can be found, including the difficult vertisols, hardpans, and sandy soils.
Some of the major problems at the national level (i.e., not necessarily unique fea-
tures of the highlands) are erosive soils in Ethiopia (31 percent of soils), Kenya (22
percent), and Uganda (16 percent); shallow soils in Ethiopia (30 percent) and
Kenya (22 percent); and aluminum toxicity in Uganda (47 percent) (FAO 2000).
These national estimates are supported by a number of site-level studies through-
out the region that demonstrate high levels of soil erosion in the highlands of
Ethiopia (Wright and Adamseged 1984; Hurni 1988), Kenya (van den Bosch et al.
1998; Angima et al. 2003), and Uganda (Bagoora 1988; Tukahirwa 1996).
Even in relatively intact soils, soil nutrient deficiencies are also common. Ir-
respective of the inherent or parent soil conditions, because of high population
density, a large proportion of the highlands has been cultivated on a nearly contin-
uous basis for many decades if not centuries. All the while, few inputs have been
applied and conservation measures have been inadequate in most places (there are
some exceptions of course, such as central Kenya). At the outset of the twenty-first
century, widespread nutrient deficiencies are reported in the soils, nitrogen defi-
ciency being common throughout the highlands, and phosphorus especially in
western Kenya (Sanchez et al. 1997). In addition to assessments of stocks, nutrient
flow studies in the highlands have shown large negative balances for major nutri-
ents in many locations and farming systems (Stoorvogel and Smaling 1990;
Smaling, Nandwa, and Janssen 1997; Elias, Morse, and Belshaw 1998; Van den
Bosch et al. 1998; Wortmann and Kaizzi 1998; Soule and Shepherd 2000; Shep-
herd and Walsh 2002; Lesschen, Stoorvogel, and Smaling 2003; Nkonya et al. 2004,
2005b).
KEY ISSUES
11
The land degradation debate. The issue of land degradation in East Africa, and
elsewhere in Africa, has been the subject of increasing debate in recent years. That
land has degraded physically, chemically, or biologically in many places in Africa is
not challenged. However, the extent, severity, and the underlying causes and effects
of the degradation and what should be done about it are debated. Several studies
question the extent of land degradation, providing examples of particular cases where
land conditions have improved in recent history (Tiffen, Mortimore, and Gichuki
1994; Fairhead and Leach 1996; Leach and Mearns 1996; McCann 1999) or evi-
dence that earlier land conditions (e.g., forest cover) were not as favorable as previ-
ously thought (McCann 1999). Some studies argue that land degradation is highly
context specific, acknowledging that land degradation is a problem for some farmers
in some places and times but arguing that the problem is not as universal as some-
times claimed (e.g., Elias and Scoones 1999). Some studies critique the methods
used by agronomists and others to estimate land degradation as being conceptually
flawed, subject to large errors, and driven by political motives (e.g., Stocking 1996;
Keeley and Scoones 2000; Bassett and Crummey 2003; Fairhead and Scoones
2005). Many studies deconstruct and critique the "Malthusian narrative," which
predicts that land degradation is the inevitable result of population pressure and pov-
erty and that drastic action by governments is required to address it (Hoben 1995;
Leach and Mearns 1996; Keeley and Scoones 2000; Bassett and Crummey 2003).
Most of the authors in this tradition argue that greater appreciation of farmers'
knowledge and ability to adapt and innovate is needed, as well as greater under-
standing of the local historical, political, and sociocultural context.
Some of these criticisms are well founded (Koning and Smaling 2005).
Land degradation is certainly not an inevitable consequence of population
growth or of poverty; the relationships among these and other factors are complex
and context-dependent, and there are many examples of sound land management
being practiced by small farmers in many parts of Africa. Nevertheless, there are
many studies that document serious degradation, and some of the studies ques-
tioning the importance of land degradation also suffer from methodological flaws
such as ignoring sources of soil nutrient outflows that are difficult to quantify (Kon-
ing and Smaling 2005). Although there are few long-term experimental studies of
land degradation in Sub-Saharan Africa (Braun et al. 1997), those that are available
show that under continuous cultivation using low external inputs, soil fertility rap-
idly decreases, yields decline, and a combination of inorganic and organic sources
of soil fertility is necessary to sustain crop production (Juo and Kang 1989; Vlek
1990; Swift et al. 1994; Bationo, Lompo, and Koala 1998). This experimental evi-
dence is supported by reports from numerous participatory rural appraisals and
surveys in Africa, in which low or declining soil fertility is often cited as a major
12
FRANK PLACE, JOHN PENDER, AND SIMEON EHUI
constraint to agricultural production (e.g., Scherr 1999; Deininger and Okidi 2001;
Pender et al. 2004a).
Much of the evidence on land degradation is synthesized in the recently com-
pleted Millennium Ecosystem Assessment (MEA 2005). The MEA is a compilation,
analysis, and synthesis of the widest body of research available on various topics of
interest relating to ecosystems. The preponderance of evidence from Africa indi-
cates that land productivity has stagnated or decreased across large areas and that in
many instances land degradation can be cited as a major cause. Across Africa and
for most staple crops, yields have stagnated or worsened over the past 30 years
(FAO 2004) despite increased use of improved varieties of maize and other crops
(Smale and Jayne 2003) and factoring out variations in rainfall. In addition, fer-
tilizer input use per hectare and per capita remains extremely low in Africa and
in several countries has fallen in recent decades (Jayne, Kelly, and Crawford 2003),
contributing to soil nutrient depletion. This may be somewhat compensated for by
increased organic inputs, but available evidence would suggest that these too are
very limited (Place et al. 2002c).
There is also direct evidence of land degradation on the continent. Although
earlier estimates of large-area degradation were based either on expert opinion
(Oldeman, Hakkeling, and Sombroek 1991) or on assumptions and relatively few
plot-level trials (Stoorvogel and Smaling 1990), recent advances in remote sensing
and ground survey methods have substantiated the existence of significant land
degradation at landscape scale. Recent use of near-infrared spectrometry to assess
soil quality and land degradation over wide areas has been able to provide evidence
of the extent of degradation in the Nyando River Basin of Kenya. Cohen, Shep-
herd, and Walsh (2005) found that about 56 percent of the land was moderately to
severely degraded. Further research combining measured soil degradation with esti-
mated effects on crop yields (Cohen, Brown, and Shepherd 2005) calculate the
costs of soil erosion at the national scale in Kenya to be equivalent to 3.8 percent of
GDP. Estimates of the costs of land degradation in Ethiopia from different methods
also indicate large impacts, although there are debates about the methods used and
the exact magnitudes of the impacts (Sutcliffe 1993; B÷jo and Cassells 1995; Kap-
pel 1996; Sonneveld 2002). Evidence from laboratory analysis of changes in soil
properties in plantation agriculture in Tanzania (Hartemink 2003) and from sample
plots in small farmers' fields in Uganda that were resampled 40 years after an earlier
soil survey (Ssali 2003) also support the view that soil fertility has declined in East
Africa. There are also studies showing high costs of siltation resulting from high
levels of soil erosion in the East African highlands. In Sudan, for example, the total
capacity of the Roseires Reservoir, which supports 80 percent of the country's elec-
KEY ISSUES
13
tricity, has fallen by 40 percent in 30 years as a result of siltation of the Blue Nile
(UNEP 2002).
We conclude, based on the available evidence, that land degradation is a seri-
ous problem in many parts of the East African highlands, though it is context-
dependent, as farmers in many places are responding to the problem with improved
land management practices. As noted earlier, improving understanding of the
widespread variation in the causes and extent of land degradation and farmers' land
management practices is a major objective of the studies included in this book.
The Social, Economic, and Political Context
Population. The highlands of East Africa are home to the highest rural population
densities in Africa because of the attraction of the relatively cool climates, low risks
of disease (e.g., malaria), as well as the potential for high agricultural productivity.
The Kenyan highlands average between 170 and 190 persons per square kilometer,
which is both higher and less variable than rates for Ethiopia (51ş130) and Uganda
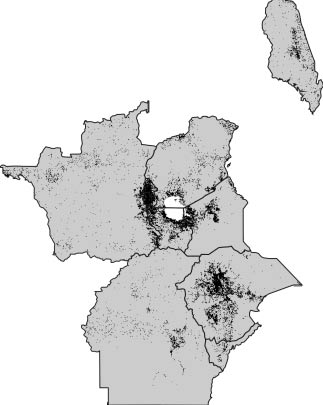
(102ş155) (Diechmann 1994). This pattern is represented in Figure 1.3. But den-
sities can reach far above these levels, especially when land unsuitable for agricul-
ture is factored out. Most studies from the highlands indicate an average farm size
of about one hectare or less and, with six persons per household, suggesting a pop-
ulation density of around 600 persons per square kilometer of cultivated land. The
western Kenyan highlands are the most densely populated, with over 1,000 people
per square kilometer in some locations (Republic of Kenya 2002).
Rural population growth rates have slowed recently as a result of urban migra-
tion and higher death rates from AIDS (and the ever-persistent malaria). There are
no specific figures for the highlands, but rates of HIV/AIDS incidence among
adult populations are estimated to be 15.0 percent in Kenya, 6.4 percent in
Ethiopia, and 5.0 percent in Uganda (Earthtrends 2004), though there is some dis-
pute about the accuracy of these numbers. The existence of AIDS and continued
persistence of other fatal diseases such as malaria and tuberculosis have prevented
significant rises in human longevity. Wars and population displacement have not
been a prominent feature of the highlands, but the TutsişHutu conflict has peri-
odically spread into the Rwenzori highlands in southwestern Uganda, and the
EthiopiaşEritrea war affected some areas of northern Ethiopia. All of these factors
have continued to impinge on life expectancy, which ranges only between 43 and
49 years in the three countries.
Nonetheless, total population annual growth averaged 3.3, 2.9, and 2.2 per-
cent between 1995 and 2002 in Uganda, Ethiopia, and Kenya, respectively (FAO
2004). Although urban areas are growing more than twice as fast as rural areas
14
FRANK PLACE, JOHN PENDER, AND SIMEON EHUI
Figure 1.3 Population density in eastern and central Africa
<100 persons/km2
>ş100 persons/km2
Source: CIESEN/IFPRI/ World Bank /CIAT (2005).
(e.g., urban growth in Kenya was over 6 percent per year in the late 1900s; United
Nations 2001), rural population continues to rise. The rate of population growth
in the highlands is likely less than those in other rural areas because of their already
high densities and the implications this has on emigration to urban or other rural
KEY ISSUES
15
areas. This pattern of emigration also suggests that the highland communities are
typically better connected with cities and towns (many of which are growing rap-
idly within farming landscapes) than other rural communities. The result is that
highland-based households may have very complex economic structures with labor
and capital moving between rural and urban settings.
Settlements and land tenure. As a consequence of high population densities, farm
sizes are small throughout the highlands, with average sizes at or below 2 hectares
almost everywhere. In the western Kenya highlands, average farm size is less than
1 hectare in most areas and even as low as 0.5 hectares in many parts (Wangila, de
Wolf, and Rommelse 1999). A national study in Ethiopia found average farm size
to be 1 hectare (Ethiopian Economics Association 2002). In Uganda, the 1991
agricultural census found that more than 1.2 million of the 1.7 million rural hold-
ings were 1 hectare or less (Republic of Uganda 1992). Most farms consist of a
single holding, and fragmentation of holdings is most common in the highlands
of southwest Uganda. Land in the Kenyan highlands had been demarcated and
registered in the name of the owner beginning in the 1960s. Most farmers in the
central highlands have updated their titles, but many in western Kenya have not.
Highland smallholder farmers in Uganda do not have formal titles but normally
are secure in their tenure, and rights of land alienation are common throughout
Kenya and Uganda. The de facto individualization of tenure in Uganda (especially
in the highlands) has led to legal recognition of private rights in the 1998 Land
Act. However, regional differences still persist, as exemplified by the parallel mailo
tenure system in central Uganda (Baland et al. 2003). Ethiopia is distinct from
Kenya and Uganda in that land tenure rights have been formally held by the state,
and land sales and mortgages are forbidden. However, land reforms have been
announced and implemented by regional governments in Ethiopia, including the
halting of land redistributions and the issues of land certificates to households.
One consequence has been an emerging land rental market (Holden, Shiferaw, and
Pender 2001; Pender and Fafchamps 2005). Thus, there is a rich diversity of tenure
systems and arrangements across the study countries.
Markets. Road densities and quality are low throughout East Africa, as is the
case in Sub-Saharan Africa as a whole. The proportion of paved roads to total road
length is on the order of 10 to 15 percent for all the countries. However, in terms
of total road densities most of the Kenya highlands are well served compared to
Ethiopia. There are only 26 kilometers of road per 1,000 square kilometers in
Ethiopia, one of the lowest road densities in the world (Demeke and Abebe 2003).
Figure 1.4 shows how market access, in terms of travel time, varies in East Africa.
16
FRANK PLACE, JOHN PENDER, AND SIMEON EHUI
Figure 1.4 Market access in eastern and central Africa, based on travel time to
nearest five markets, weighted by population of markets
High
Medium
Low
Source: Constructed by Jordan Chamberlin, IFPRI.
Note: Based on cities with a population of 1 million people or more.
KEY ISSUES
17
Growth in telecommunications was dormant for decades until the advent of
mobile phones and the privatization of cell phone providers. Growth in Uganda
has been staggering. In 1999, it became the first country in the world where the
number of mobile telephone users exceeded that of fixed-line users. Kenya shortly
followed suit and is experiencing similarly high growth rates. Ethiopia lags the
others because of its continued reliance on the government-owned telecommu-
nications corporation. It should be emphasized that the rapid growth rates are
applied to very low levels of telephone lines. By 2000, the numbers of fixed and
mobile lines per 100 persons were only 1.05 and 0.42, respectively, in Kenya. In
Ethiopia, the comparable figures were only 0.37 and 0.03 (International Telecom-
munications Union 2004). The economic impact of the recent improvement in
telecommunications has not yet been documented.
Markets for inputs are much more developed in the Kenya highlands than in
the highlands of Uganda or Ethiopia. On the input side, there were as many as 12
fertilizer importers in Kenya and 500 wholesalers in the mid-1990s (Allgood and
Kilungo 1996). These are underdeveloped in Uganda and Ethiopia, as is the retail
sector. In fact, fewer than 10 percent of Ugandan farmers use any chemical fertil-
izer (Pender et al. 2004a), and the average fertilizer application rate in Uganda (about
1 kg/ha) is much less than even the low average in Sub-Saharan Africa as a whole
(Republic of Uganda and FAO 1999). In Ethiopia, fertilizer use is significantly
higher than in Uganda as a result of heavy promotion by the government extension
and credit program. The Ethiopian market for fertilizer is controlled by two hold-
ing companies supported by government tenders (Jayne, Kelly, and Crawford
2003). Despite rhetoric from the Government of Ethiopia extolling the intention
to strengthen the private sector's involvement in agricultural inputs, there is rela-
tively little movement in this direction.
Credit is practically absent for smallholders in East Africa with three notable
exceptions. First, cooperatives (i.e., mainly government parastatals) operating in
export crops have traditionally maintained credit programs. This was a key con-
tributing factor in building up the coffee and tea sectors as well as ensuring ade-
quate use of inputs, at least in the case of Kenya. A second source is through private
firms under contract farming. This is less common but occurs for vegetables and
some other horticultural crops. A third way is through the occasional government
support program such as that in Ethiopia, where the government is promoting the
adoption of modern cereal varieties and accompanying inputs (especially fertilizer).
Aside from these formal opportunities, there are very few opportunities for farmers
to borrow through formal banks, and they are left with small and uncertain loans
from small traders or in revolving credit schemes.
18
FRANK PLACE, JOHN PENDER, AND SIMEON EHUI
There have been few restrictions on labor markets after the fall of the Derg
regime in Ethiopia, which had prohibited the hiring of labor along with restrictions
on land transactions. There are examples of migrant labor working on a fixed-term
basis (e.g., for tea) and local labor markets (e.g., casual labor tasks) in many high-
land areas. The quantity of hired labor is strongly linked to the presence of high-
value agricultural enterprises, such as coffee and tea, in all countries. In areas where
low-value cereal production dominates, relatively little labor is hired except by the
wealthier households.
Markets for outputs are heavily influenced by road densities, export opportu-
nities, processing industries, and, of course, general prosperity levels of the country.
From the 1960s to the 1990s, Kenya was far advanced in these indicators as com-
pared to Uganda and Ethiopia. However, its advantage has slipped after about a
decade of very poor economic growth. Nonetheless, export markets remain rela-
tively strong in Kenya, and high urban growth (6.75 percent annually in the late
1900s) has boosted domestic food demand. Government parastatals, processors,
contractors, export buyers, national buyers, and local buyers actively purchase
many highland agricultural goods, including crops, milk, meat, and tree products.
Uganda has experienced improved market conditions since 1990 in both export
and food crops, with significant investment in food processing having taken place.
The government has facilitated market linkages to rural communities through
major development of road and communications infrastructure. The result is that
certain crops enjoy good market channels, notably bananas, the main food crop,
tea, coffee, and selected horticultural crops. However, other crops are not as easily
sold, and there are reports of rapid gluts in rural markets (Raussen et al. 2002).
Ethiopia is clearly lagging in output market growth. Many communities remain
disconnected from urban output markets. When production increases do occur, such
as with maize in 2001 and 2002, there is no capacity to handle excess supplies, and
prices collapse (Gabre-Madhin and Amha 2003).
Political Structure and Policies
International relations and macro policies. There have been quite different political
histories in Uganda, Kenya, and Ethiopia in terms of relationships with inter-
national organizations. For the entire decade of the 1990s and continuing into the
early twenty-first century, Uganda has been a favored recipient of donor funding.
This is partly because of the desperate economic and social conditions in Uganda
following the long periods of dictatorship under Amin and Obote. Further, the
Western countries viewed Uganda's far-reaching macroeconomic stabilization,
structural adjustment, market liberalization, and decentralization policies, discussed
below, as favorable (World Bank 1996). Following from active IMF and World
KEY ISSUES
19
Bank programs, and those of numerous other donors, private foreign direct invest-
ment was also noticeable, attracting over $100 million per year in the late 1990s
(UNCTAD 2003), and its overall balance of payments was 20 times that of Kenya
(an economy that is twice the size of Uganda's). This was fostered by encourage-
ment of expelled Asian property and business owners to return to the country and
to reclaim their assets.
Kenya has been on the opposite side of the spectrum. The IMF closed down
its Kenya facility in the mid-1990s and resumed it only in 2004. The main rea-
son for this was government corruption, and that signal affected donor funds
from other countries profoundly. It also had an effect on private capital inflows,
which virtually dried up by the late 1990s and were just $5 million in 2001. Cer-
tain government programs, such as health, education, and agricultural research and
extension, continued to receive support, but there was no general budget support
to the government. In 2003, a new government was elected following the forma-
tion of a political coalition to oust the long-standing ruling party. The govern-
ment made an immediate impact with a change to free primary education and
has made well-publicized strides to fight corruption. As a result, there has been
renewed interest in Kenya on the part of the IMF, the World Bank, and several
other donors.
Ethiopia lies somewhere between these cases. It is widely recognized that
Ethiopia is one of the world's poorest countries. In addition, the Ethiopian govern-
ment is not considered to be very corrupt, relative to many other African countries,
including Uganda and Kenya (Transparency International 2004). So there are strong
interests on the part of the international community to assist the government to
mitigate periodic famines and to develop the country. However, the international
community became incensed at the diversion of resources to fight a war with
Eritrea. This proved to be quite a setback for the continuation of a number of devel-
opment projects. Finally, because of the low state of development, foreign direct
investment has been low, ranging between only $10 million and $20 million per
year during the 1990s. Data on external remittances to East African countries are
very poor, and estimates vary widely. The IMF (cited in Harrison 2003) estimates
that in 2000, the remittances into Ethiopia were $53 million (with the rest of East
Africa receiving about $300 million altogether). Farm level surveys from Ethiopia
and Uganda (results discussed in Chapters 5, 7, and 9 of this book) do not show
remittances (whether from domestic or external sources) to be a major component
of farm households' incomes in the regions studied in those countries. In the high-
lands of Kenya, remittances are probably more important to rural households (as
are other sources of nonfarm income as shown in Chapter 8), though evidence on
this is limited.
20
FRANK PLACE, JOHN PENDER, AND SIMEON EHUI
Uganda was the first of the East African countries to liberalize exchange rates
(in 1990) and to relax restrictions on capital flows. This enabled, among other
things, Asian capital to return. Kenya followed suit shortly after (in 1993), and
Ethiopia has likewise moved largely in that direction. As a result, Uganda's currency
has depreciated the most against the hard currencies since the early 1990s, fol-
lowed by the Kenya shilling and then the Ethiopian birr, which had been closely
managed to create a stable exchange rate with the dollar until a 240 percent rise
in the exchange rate in 1992. By 1997, the parallel currency market rates were very
close to official rates. Trade and commodity market liberalization accompanied the
exchange rate policy changes. However, by 2004, the countries still maintain
import tariffs, and discussions continue to remove these over time, first among
Kenya, Uganda, and Tanzania and then with a broader set of eastern and southern
African countries.
All governments have sought to control inflation in recent years and in fact
have done well in this respect, apart from some bouts of high inflation in Uganda
in the early 1990s and in Kenya around elections in 1992 and 1997. Ethiopia has
kept inflation under control except during the severe drought years of the mid
1980s and 1990s, when it reached between 15 and 20 percent. On the other hand,
government spending has been difficult to balance against revenues in all countries.
This has increased tensions between donors/lenders and the governments of these
countries, especially because of their large defense budgets.
Decentralization of governance. The three countries also differ in terms of the
degree of internal decentralization of political decisionmaking. In the 1990s,
Uganda embarked on a broad program to decentralize much decisionmaking to
local levels. This program included the direct election of local officials, granting of
numerous powers to local authorities, and the ability for local governments to raise
and retain their own revenues. This has been done within a single-party frame-
work. Contrary to this movement, Kenya remained, as of 2003, on the other end
of the spectrum with a rather centralized political system. To its credit, the Moi
government allowed the multiparty system to develop, but it retained key powers
in the executive branch at the national level. For instance, all local administrators,
from sublocation up to province level, are appointed by the executive branch. Some
planning is done at local levels, but the planners are not accountable to the local
populations. Ethiopia lies between the two cases. In fact, it has recently increased the
powers of its seven regional state governments across a range of decisionmaking
areas, including agriculture and the environment, and is also increasing authority
and capacity of district (woreda) governments. Some fiscal autonomy has also been
granted to the regional governments.
KEY ISSUES
21
Natural resource and tenure policy. As indicated above, the past decades have
witnessed substantial conversion of natural habitats to other uses. This includes
a large amount of gazetted land supposedly protected by law. Yet, in many cases,
exemptions were granted by one office (e.g., lands) in defiance of the rules set by
another (forests). In other cases, clearing of land was allowed to proceed because
of local corruption or inability to enforce policies. A number of environmental reg-
ulations and bylaws are on the books but are routinely flaunted. These include the
observance of easements along riverbanks and restrictions on cultivation on hills
and steep slopes, the cutting of indigenous trees, and the harvesting of water
resources. In most cases, agricultural imperatives, especially those of cultivators,
have won out over the implementation of environmental policies where the two
were in conflict.
Property rights policies and enforcement play a key role in the management
of natural resources. It is necessary to discuss tenure on agricultural land country
by country because of distinct differences. But there are many common features of
property rights on noncultivated lands in the three countries. Although indigenous
populations have enacted management rules over land resources that they cultivate,
wide areas of noncultivated lands have been subjected to various claims and uses by
an array of users: migrant cultivators, new pastoral communities, charcoal burners,
tree cutters, and land-grabbing elites (Deininger and Castagnini 2004). In many
of these lands, the degree to which sovereign or traditional rules take precedence
is not clear. There are often no mechanisms by which different claimants of rights
to the same resources can resolve conflicts or can join together to prevent illegal
claimants from using the resources. The lack of clarity of property rights over forests,
woodlands, grasslands, and wetlands has only increased under decentralization
processes that have devolved more control over natural resources to local levels.
Moreover, capacity to manage natural resources at local levels is very poor.
On cultivated lands, Kenya embarked on a freehold system to grant individual
titles to farmers operating in all medium- to high-potential areas. This exercise began
in the 1960s and was largely completed by the 1980s. Under this system, exclusive
rights to household heads, mainly male, were granted. But there remained many
secondary rights arrangements that survived this, and land boards were also estab-
lished to prevent the dispossession of landholdings without full consent of family
members. Forty years later, the privatization program continues to flourish in some
areas where new recipients of parcels update the land registry. In other areas, how-
ever, the land registries are moribund because new recipients of land do not find it
worthwhile to invest the time and costs in acquiring a title deed in their name.
Uganda passed a new land law in 1998 that affirmed the importance of private
tenure on agricultural land but did not deal uniformly with the different tenure
22
FRANK PLACE, JOHN PENDER, AND SIMEON EHUI
systems that operated previously. Customary tenure is supposed to be converted
into a fully private system in which the legitimate occupant of land rights is now
formally recognized as the owner under the law, though the law has not been fully
implemented. The mailo tenure system, which covers a wide area in central Uganda,
developed into one of overlapping rights between owners and long-term occu-
pants. The law has not decided in favor of one over the other but has set forth the
process to resolve these competing claims and methods for determining due com-
pensation. The law also establishes a streamlined mechanism by which smallholders
can obtain title deed on their property. Although very few Ugandan farmers have a
title deed, the buying and selling of rural land is as common in Uganda as any-
where in Africa (Place 2002).
In Ethiopia, the government remains the owner of all land. That is enshrined
in the constitution, and all regional governments must adhere to that article when
devising land reforms. The national government had, through the 1975 land reform,
introduced mechanisms for state and cooperative farms along with redistributions
of land to promote equitable distribution of land (through peasant associations).
State farms were discontinued after 1991 with land reverting back to communities
and households. The extent of commercial farming is limited in the Ethiopian
highlands, relative to Kenya and Uganda. Also, sale and mortgage of land were
barred and remain prohibited today. But there is some relaxing of other restrictions,
and land renting is now allowed, subject to restrictions imposed by regional gov-
ernments. Importantly, many regional governments have stated that they will no
longer redistribute land, and the Amhara and Tigray regions have strengthened this
new policy by issuing land certificates to households.
Agricultural sector policies. Government involvement in agriculture has roots
from precolonial days and continues today in some form in each country. In Kenya,
the major areas of government involvement remain in export crops such as coffee
and tea, in the national staple, maize, as well as in a few other areas such as irri-
gation. There is no doubt that public cooperatives helped develop the Kenya high-
lands. At the turn of the twenty-first century, Kenya boasted as many as 600,000
smallholder dairy farmers, 500,000 smallholder coffee growers, and 300,000 small-
holder tea producers. Many of the parastatals, however, were mismanaged and cor-
rupt and may have even had a negative effect on smallholder production and
income in the 1990s. As of 2002, the Ministry of Agriculture managed 40 para-
statals, many of which required significant budget support in return for dubious
benefits. Coffee is widely held up as an example of a poorly run cooperative in
which farmers had little voice in the management of the sector. Tea producers, on
the other hand, appear to be reasonably well served by the Kenya Tea Development
KEY ISSUES
23
Authority (Argwings-Kodhek et al. 1999). The liberalization of the dairy sector
had enormous impact, with the number of dairy products increasing by perhaps
30 times and retail shortages becoming a thing of the past. Kenya also long ago lib-
eralized the fertilizer industry and removed subsidies. As noted above, this has
resulted in competitive import and wholesaling in fertilizer. Fertilizer is available in
retail shops throughout the country. The major problem is with costs. Because of
the poor road conditions, poor transport means, and lack of competition in the
transportation sector, transport costs more than double the price from Mombasa to
the farm. Liberalization has not worked in all cases, however, and there remains a
concern about input delivery to remote areas, output processing of meats from the
pastoral areas, the prices paid to maize farmers, and the incentives to ensure a
domestic sugar industry, to name just a few. Credit remains problematic. The gov-
ernment's solution to rural credit was the Agricultural Finance Corporation, but
that institution has concentrated almost exclusively on medium- to large-scale
farmers in selected high-potential areas (Argwings-Kodhek et al. 1999).
In Uganda, the Museveni government acted quickly in concert with foreign
donors to reform the ways in which the government was to be involved in the agri-
cultural sector. After a period of discussion, the Produce Marketing Board, the
Coffee Marketing Board, and the Lint Marketing Board lost their monopoly status
in 1989, 1991, and 1993, respectively. Consequently, participation of the private
sector in agricultural input and output trading increased significantly (Balihuta
and Sen 2001; Nkonya 2002), and the farmers' share of the international price of
major traditional export crops increased substantially, for example, from 30 per-
cent to nearly 80 percent for coffee (Balihuta and Sen 2001). In 2000 the govern-
ment initiated the Plan for the Modernization of Agriculture, which sought to
enhance the intensification and commercialization of the agricultural sector through
agricultural research and advisory services, support to agricultural processing, and
promoting the use of high-value enterprises and inputs. There have been successes,
for example, in responding to a global shortage of vanilla. However, Ugandan
farmers continue to apply few soil inputs as compared to farmers elsewhere in
Africa for many reasons, including the high costs of inputs delivery. The Uganda
government is also supporting the development of microcredit and has established
a high-level government department in this area.
The Ethiopian government has historically been heavily involved in agricul-
ture, especially during the Marxist/socialist regime that lost power in 1991. The
policy statements of the current government have been to promote the private
sector, but their actual practices are not always reflective of this. For instance, the
government has become heavily involved in credit for fertilizer and seed to the
extent that private fertilizer dealers have closed down. This has been targeted to
24
FRANK PLACE, JOHN PENDER, AND SIMEON EHUI
cereal-producing areas, chiefly maize and wheat. It has been successful in raising
yields, especially in higher-rainfall areas, sometimes so successful that surpluses could
not be handled by either the market or the government, leading to price collapses.
The government has been less successful in promoting productivity increases for
other commodities and in the drier regions.
All three countries have had functioning agricultural research systems, with
Kenya's arguably the strongest in terms of length of uninterrupted research, its de-
centralized structure, and its successful delivery of improved technologies. Uganda
and Ethiopia have recently moved to decentralize their research systems. Both the
Kenyan and Ugandan research institutions rely heavily on World Bank and other
donor funds, whereas the Ethiopian national and regional governments provide a
large share of research capital and operational funds. Extension systems have faced
serious deficiencies in all three of the countries, and thus, they all have recently
undergone major overhaul. Kenya moved away from a training and visit approach
to a focal area approach in which teams of staff concentrate efforts in selected com-
munities each year. Uganda is in the process of transforming its public system into
a farmer-led system (Uganda National Agricultural Advisory Services), but this will
take considerable time to fully implement (if indeed the system is found to be
effective). Ethiopia is investing heavily in increasing the number of extension
agents (to three per community), developing a large number of farmer-training
centers, and broadening its Participatory Demonstration and Training Extension
System to promote a wider variety of commodities and technologies that have
market potential.
Livelihoods and Agricultural Systems
Major crops. In Kenya, almost all the highlands are considered to be medium to high
potential. As a result, a variety of crops can be found throughout the highlands.
The main factor in explaining differences is not agricultural potential, therefore,
but rather market access and cultural factors such as the commercial mindset of the
population. In central Kenya, the practice of growing commercial products and
buying food items is well entrenched. Therefore, the notion of a subsistence farmer
is practically unheard of. Farmers integrate a wide range of food and nonfood crops
on their farms. On the other hand, there are a large number of farmers in the
western Kenya highlands who produce mainly food crops and sell a small portion
of their output, those being mainly distress sales (i.e., out of the need to pay for
another critical household need). The key staple food crops in the Kenya high-
lands are maize, beans, potatoes, and bananas, followed by sorghum, cassava, and
rice. Maize accounts for 80 percent of all cereal value and occupies about 1.5 mil-
lion hectares of land. Vegetable production of kale, peas, onions, carrots, and
KEY ISSUES
25
tomatoes is also common. Nonconsumed cash crops include coffee, tea, sugar
cane, and French beans.
In Uganda, banana is the main staple and, at 1.5 million hectares, accounted
for the largest share of acreage under cultivation (FAO and World Food Programme
1997). Several important crops follow, including beans, maize, and sweet potato,
with maize production experiencing good growth with markets in Kenya. Uganda
is one of the largest growers of coffee in Africa, with 90 percent of production
being robusta. It can be found in many districts, including all lakeshore, southwest,
and western districts. A number of specialty crops are also produced; the more
commercially traded include vanilla, passion fruit, and pineapples.
In Ethiopia, teff is the main staple food and, at 2.7 million hectares, occupies
the largest share of cultivated land, especially in the central and northern regions
(FAO and World Food Programme 2000). Maize, wheat, and barley are also pro-
duced on over 1 million hectares each, with the maize area expanding at high rates.
Pulses as a group also occupy about 1.5 million hectares of land. Coffee is the major
cash crop, found mainly in the southwest of the country. Almost all coffee is grown
by over 700,000 smallholder farmers and together accounts for 60 percent of
Ethiopia's export earnings. Also important as a food crop in more humid areas is enset
(a root crop), and chat (a mild narcotic) is increasingly important as a cash crop in
many such areas, particularly in the wake of low world coffee prices in recent years.
Livestock. There are about 12 million head of cattle in Kenya and 20 million
sheep and goats. The sector contributes about 42 percent of total agricultural income
(Argwings-Kodhek et al. 1999). Although many of these animals are located in
pastoral areas, a large number are in the highlands, and over 3 million dairy cattle
can be found in the highlands (Aklilu 2002). Livestock systems in the Kenya high-
lands are intensive and productive. Most cattle in Central and Rift Valley Provinces
are high-grade animals and are raised in zero grazing units. Indigenous cattle breeds
raised in tethered or guarded grazing systems are more common in the western
highlands. Poultry keeping is also very common at small and medium scales. Goats
are also common; the Kenya highlands host the largest number of improved dairy
goats in Africa.
Ethiopia has the largest livestock herd in Sub-Saharan Africa. There are over
35 million head of cattle, 30 million sheep, and 21 million goats. About 80 percent
of cattle and 75 percent of sheep are found in the highlands, whereas most of the
goats are raised in the lower elevations (Demeke and Abebe 2003). The livestock
sector contributes 20 percent of gross domestic product.
In Uganda, there are about 5.9 million head of cattle and 7.3 million sheep
and goats (Mwebaze 2002). Poultry are the most common of all, numbering about
26
FRANK PLACE, JOHN PENDER, AND SIMEON EHUI
22 million. Most of the cattle are under extensive feeding systems in the drier
zones. There is a growing dairy industry, estimated to produce about 511,000
metric tons of milk annually (Mwebaze 2002), but the number of high-grade ani-
mals is small in comparison to Kenya. The major pockets of modern dairy produc-
tion systems are in the western and eastern highlands, the southwestern districts of
Mbarara and Bushenyi, and in periurban areas near Kampala and Jinja.
Trees and other agricultural products. Another notable agricultural product in
Ethiopia is eucalyptus poles, which comprise nearly all the trees planted by farmers.
The demand for poles is high because of construction booms in the cities and
towns and for poles for making plow beams. Eucalyptus is also a major source of
fuelwood. Some fruit trees are also found but are not extensively commercialized.
A final important product is honey production, which is produced in the drier
parts of the highlands. In Kenya, there are a variety of valuable trees, including
macadamia and avocado fruit trees and grevillea timber trees in central Kenya
and eucalyptus woodlots in western Kenya. For example, avocados generate about
$6.5ş7.0 million in export revenue each year, the third largest export among fruits
and vegetables (FBAK Feld Consulting 2001). In Uganda, eucalyptus is also a
common timber/pole tree, mainly found in woodlots. Fruit trees such as avocado,
jackfruit, and mango are common in the highlands of Uganda but in small numbers
per farm.
Agricultural Productivity and Growth
The three countries have experienced significantly different trends in per capita
agricultural production in recent years. As indicated in Table 1.1, Ethiopia has
exhibited the highest growth rates in agricultural production between 1995 and
2003 (5.5 percent), fueled by impressive increases in cereal production. This has
come about because of three factors: the very low baseline yields, characteristic of
the military regime; slight expansion of cultivated land (mostly outside of the high-
lands); and improved yields from intensified use of inputs, especially fertilizer.
Kenya attained modest growth in per capita agricultural production (1.8 percent)
over the same period but actually experienced a large drop in per capita cereal pro-
duction. This indicates a shift toward higher-value production systems, such as tea,
dairy, and horticulture. In Uganda, trends in both indicators have been negative.
Part of the reason for this is the rapid agricultural growth that occurred in the
1986ş95 period, especially in terms of cultivated areas. Further increases are going
to be difficult to realize unless input use (especially of organic or inorganic sources
of soil nutrients) increases from its extremely low level.
KEY ISSUES
27
Table 1.1 Some indicators of agricultural performance in Ethiopia, Kenya, and Uganda
Indicator
Ethiopia
Kenya
Uganda
Per capita agricultural production 2003 (1990 = 100)
103.9
94.0
94.1
Growth in per capita agricultural production 1995ş2003
5.5
1.8
ş1.8
Per capita cereal production 2003 (1990 = 100)
155.0
70.1
95.2
Growth in per capita cereal production 1995ş2003
9.5
ş28.0
ş11.5
Source: FAO (2004).
The Critical Variables
Here are some of the critical variables that take various patterns across the landscape
of the highlands and that are expected to have large effects on the development
pathways of communities and the households within them.
Climate. The more humid portions of the highlands receive a high and rela-
tively well-distributed rainfall, perhaps the most favorable for agriculture in all of
Africa. In such areas, the highlands host a wide variety of perennials, annuals, live-
stock, and trees that is unparalleled in Africa and perhaps the world. In such places
(e.g., central Kenya, western Uganda, southwest Ethiopia), there are very few sup-
ply constraints impeding the choice of agricultural options. It is rather the markets,
entrepreneurial expertise, and access to productive factors that become critical. The
drier areas are quite different, and production possibilities are much more limited.
Perennials tend to disappear from the landscape, and the low-moisture annuals
such as sorghum, millet, barley, and wheat predominate. Because of the lack of
vegetation, zero grazing units of improved breeds give way to free-grazing native
breeds.
Population. Virtually all of the highlands are densely populated, implying
that land is scarce in almost all regions. Indeed, farm sizes average no more than
2 hectares anywhere in the study sites (apart from some larger commercial areas in
Kenya). This will of course limit opportunities for mechanization, which indeed is
not found to a significant extent anywhere in the highlands. There are some subtle
differences in population pressure in that some areas have been reduced to farm
sizes of 0.5 hectare or smaller. In those cases, off-farm income has become so
important as to render further on-farm innovation problematic.
Markets. Especially within the high-potential areas, market opportunities and
infrastructural investment play a significant role in agricultural enterprise selection
28
FRANK PLACE, JOHN PENDER, AND SIMEON EHUI
and farm investment production. Casual observation suggests that sites where sig-
nificant investment has taken place (e.g., all-year roads or tea factories) or that are
close to the capital cities have become relatively commercialized and prosperous.
Farmers are often innovative and tend to make investments where returns are high.
In contrast, farmers in remote locations do not adopt the same types of enterprises as
will others and will tend to focus on food crops and other subsistence commodities.
Land tenure. There are several significant tenure arrangements that operate in
the highlands of East Africa, and they have been uniquely shaped by differences
in national policies. Kenya has for a long time promoted individual freeholds, espe-
cially in the highlands; Uganda is home to a variety of legal and customary systems;
and Ethiopian farmers have been uniformly subjected to strong state ownership
rules with emerging transfers of some land rights to households. Ethiopian farmers
had further been subjected to periodic land redistributions that have likely inhib-
ited long-term fixed investments such as trees, fences, livestock-feeding units, and
the complementary enterprises that they promote. Only in Kenya have a large num-
ber of households had access to titles and theoretically to commercial credit.
Government programs. Irrespective of climatic, physical, and market conditions,
government programs and policies can have significant effects on rural communities.
Ethiopia has been proactive in cereal production promotion, which led to large
increases in production and consequent marketing problems in high-potential areas
almost overnight. In Kenya, government investment in tea and coffee factories in
the 1960s and 1970s had a tremendous effect in creating smallholder commercial
farmers. More recently, it has been the move toward liberalization that has tended to
improve incentives in many sectors, especially dairy. In Uganda, by most accounts,
the liberalization policies adopted have been praiseworthy. This has had some
impacts, albeit of a limited nature because of inherently weak public and private
systems for disseminating information and for transporting inputs.
Overview of the Book Chapters
The next chapter presents a broad conceptual framework and the key hypotheses
that are explored in the empirical chapters. Chapters 3 through 5 form the second
part of the book, which focuses on development domains and pathways in the East
African highlands. These relate to livelihood strategies emphasized by different
communities and, in particular, their agricultural and natural resource manage-
ment strategies. Chapter 3 focuses on the central and western Kenya highlands,
and Chapters 4 and 5 pertain to Ethiopia.2 All chapters go beyond descriptive
KEY ISSUES
29
analysis to investigate relationships among development domains and pathways,
biophysical conditions, and driving forces of change.
The third part of the book includes six studies of the determinants of land
management practices by households and communities in the East African high-
lands. Chapters 6, 7, and 8 focus on household-level land management in Ethiopia,
Uganda, and Kenya, respectively. The Ethiopian and Ugandan studies draw on
recent household surveys that were coordinated and are thus able to test a wide
range of similar hypotheses. The Kenyan chapter is a synthesis of several recent
studies that have individually focused on discrete segments of the conceptual frame-
work. Chapter 9 focuses on the land management impacts of land policy in the
case of Ethiopia. Land policy is particularly important in Ethiopia where there is
concern that the nationalization of all land has inhibited agricultural development.
The chapter will investigate the effects of recent easing in restrictions on individual
rights. Chapters 10 and 11 focus on the role of collective action and organizations
in particular on natural resource management at the community and household
levels in Ethiopia and Uganda, respectively.
The fourth part of the book builds on the analyses of the context and the
determinants of land management to examine possible technological and policy
options to address land degradation, low agricultural productivity, and poverty in
the East African highlands. Chapters 12 and 13 analyze the potential for selected
land management technical options to be effective, be adopted, and have an effect
on smallholder farmers in the three countries. Chapters 14 and 15 emphasize
policy options for Ethiopia and Uganda. Both chapters evaluate the influences of
alternative policy options with the aid of bioeconomic models in order to address
the potential trade-offs among economic, social, and environmental effects.
Last, Chapter 16 includes a summary of key results, some conclusions based on
a synthesis of findings, and implications for policy. The chapter devotes consider-
able space to reviewing the main findings of the preceding chapters because they
are numerous and some readers will not have had the time to read all the empirical
chapters. The conclusions are organized around the variables emphasized in the
Chapter 1 description and in the hypotheses developed in Chapter 2. The prin-
cipal implications pay attention to important distinctions among the widely differ-
ent contexts existing in the East African highlands.
Notes
1. We define a development pathway as a common pattern of change in households' liveli-
hood or income strategies (Pender et al. 2004a). We define income strategies as the set of activities
that households pursue to produce or acquire income and consumption goods, such as subsistence
30
FRANK PLACE, JOHN PENDER, AND SIMEON EHUI
production of food crops, production of perishable cash crops, livestock production, forestry, and
nonfarm activities (Nkonya et al. 2004). We use the term "income strategies" rather than "liveli-
hood strategies" for clarity because the latter has been defined by some authors in a very expansive
way. See endnote 2 of Chapter 2 for more discussion.
2. Development domains and pathways in Uganda are already described in published work
(e.g., Pender et al. 2004a).
C h a p t e r 2
Conceptual Framework
and Hypotheses
John Pender, Simeon Ehui, and Frank Place
In this chapter we introduce the conceptual framework that underlies the case
studies presented in this book and discuss hypotheses about the effects of key
factors on community and household decisions concerning income strategies
and land management. We also discuss the influence of such decisions on out-
comes such as agricultural production, household income, and land degradation
(or improvement). This chapter is adapted from Scherr et al. (1996); Pender, Place,
and Ehui (1999); Pender, Scherr, and Durˇn (2001); and Nkonya et al. (2004).
The conceptual framework considers the effects of dynamic driving forces of
change, such as population growth and changes in access to technology, markets,
infrastructure, and services, as well as of more slowly changing conditioning factors
such as agricultural potential, local institutions, and culture. We also consider the
influence of government policies, programs, and institutions, which may influence
income strategies, land management, and outcomes in many ways at different levels
by affecting the driving forces and conditioning factors at the local level, by directly
promoting or inhibiting different income strategies and land management practices,
or by directly affecting outcomes (e.g., through food aid). We argue that the impacts
of many factors are likely to be context-dependent, emphasizing the importance of
empirical research in specific contexts, though some unambiguous hypotheses are
derived. In general, policy and program interventions are likely to involve trade-
offs among the objectives of increasing agricultural productivity, increasing house-
hold income, and reducing land degradation.
32
JOHN PENDER, SIMEON EHUI, AND FRANK PLACE
Figure 2.1 Factors affecting income strategies, land management, and their
implications
Government policies, programs, institutions
(Market policies, agricultural research and development, infrastructure, land policies, credit programs,
food aid, etc.)
Local causal and
Income strategies
Outcomes
conditioning factors
Ě Subsistence food
Ě Agricultural production
Ě Agricultural potential
production
Ě Household income
Ě Population density
Ě Cash crop production
Ě Land degradation or
Ě Market access
Ě Livestock production
improvement
Ě Access to programs and
Ě Forestry
services (technical
Ě Nonfarm activities
assistance, credit, etc.)
Ě Local institutions and
culture (e.g., land rights
Land management
and tenure institutions)
Ě Collective management
Ě Household endowments
(regulation, investment,
(physical, human, natural,
use)
financial, social capital)
Ě Private management
(land use, crop choice,
input use, investment)
Conceptual Framework
To address the objectives and the research issues identified in the preceding chap-
ter, we developed a conceptual framework, illustrated in Figure 2.1, that served as a
guide for developing hypotheses tested during the various research activities reported
in this book. The conceptual framework for this research on sustainable land
management draws from theories of induced technical and institutional innova-
tion in agriculture that explain changing management systems in terms of chang-
ing microeconomic incentives facing farmers as a result of changing relative factor
endowments (Boserup 1965; Hayami and Ruttan 1985; Binswanger and McIntire
1987; Pingali, Bigot, and Binswanger 1987). Additional variables that are also impor-
tant determinants of resource management have been included, inspired by theories
of collective action (Olson 1965; Ostrom 1990; Baland and Platteau 1996), market
and institutional development (North 1990), and agricultural household models
(Singh, Squire, and Strauss 1986; de Janvry, Fafchamps, and Sadoulet 1991).
Outcomes
The key outcomes of interest to policy makers include outcomes such as agricul-
tural productivity, household income and household welfare indicators, and changes
CONCEPTUAL FRAMEWORK AND HYPOTHESES
33
in natural resource conditions, particularly land degradation or improvement. Our
interest in this framework is to assess the ultimate impacts of policies, programs,
and institutions on these outcomes and the extent to which there may be trade-
offs or complementarities among outcomes. For example, government policies that
prevent sales or exchanges of lands may be effective in preventing the dispossession
of lands from poor smallholders but be ineffective in improving the welfare of the
poor because of their inability to put the land to productive alternative use.
Another example is that a strict regulatory approach (such as preventing farmers
from planting annual crops on sloping lands) may be effective in reducing soil ero-
sion but may also have severe implications for agricultural production, food inse-
curity, and poverty. On the other hand, there may be "win-win-win" strategies such
as promotion of improved technologies or markets that promote greater production
and incomes as well as improved resource conditions.
These outcomes not only are important for people at present but also affect
households' endowments and opportunities in the future (indicated by the arrow
from outcomes to the factors affecting income strategies and land management
in Figure 2.1). For example, increases in agricultural production and income can
facilitate greater investment in different types of capital, whether physical (e.g.,
purchase of livestock or equipment), financial (e.g., monetary savings), or human
capital (e.g., investments in education), and improvements in land quality that
represent an investment in natural capital. Interventions or other changes that lead
to improved agricultural productivity, household income, and natural resource
conditions may foster a "virtuous circle" or "upward spiral" out of low productivity,
poverty, and land degradation; conversely, negative outcomes may contribute to
a "downward spiral" (Durning 1989; Leonard 1989; Cleaver and Schreiber 1994;
Pinstrup-Andersen and Pandya-Lorch 1994).
Whether such upward or downward spirals occur depends critically on how
livelihood and land management decisions are affected by asset poverty, broadly
defined to include limited endowments of all types of capital (Pender et al. 2004c).
If increasing poverty causes poorer land management, then downward or upward
spirals may occur, whereas if poor people manage their land as well as or better than
wealthier ones, then such spirals are less likely (Pender et al. 2004c). Upward or
downward spirals of land degradation are examples of path-dependent processes that
are caused by positive reinforcement mechanisms (Arthur 1988). If such positive
reinforcement does not occur (e.g., if poor people manage land as well as or better
than wealthier ones), or if other factors outweigh any positive reinforcement that
occurs (e.g., if improvements in technologies or access to markets lead to reduced
poverty and land degradation), then downward spirals may not occur. Thus, it is
necessary to assess the impacts of asset poverty and other factors on livelihoods and
34
JOHN PENDER, SIMEON EHUI, AND FRANK PLACE
land management in order to assess whether such downward spirals can occur and
how they can be prevented or reversed.
The empirical studies in this book are mostly based on cross-sectional data and
thus are limited in their ability to assess such dynamic issues as whether downward
spirals of land degradation and poverty are occurring and what can be done about
them. But by investigating the factors influencing households' livelihood and land
management decisions at a given time, including various dimensions of poverty,
these studies shed light on some of the issues influencing such dynamic processes.
Furthermore, the databases and findings of this research provide a foundation on
which future studies of the dynamics of poverty and land degradation can be built.
Income Strategies
Many factors affect outcomes such as agricultural productivity, household income,
and land degradation. The central focus of this book is on the determinants and
results of people's decisions about income strategies and land management prac-
tices. We define income strategies as the set of activities that households pursue to
produce or acquire income and consumption goods, such as subsistence production
of food crops, production of perishable cash crops, livestock production, forestry,
and nonfarm activities.1
We hypothesize that such strategies have important direct implications for
the outcomes of interest, and also affect them indirectly by influencing technology
adoption and land management decisions. For example, production of high-value
horticultural crops or other cash crops may lead to higher household incomes than
production of food crops simply because the profitability of such crops may be
greater than that from food crops. But they may also promote greater productivity,
land improvement, and increased income indirectly by promoting greater use of
purchased inputs, labor, or adoption of labor or capital intensive land improve-
ments because higher value production increases the value of these inputs and the
ability to finance them (e.g., Tiffen, Mortimore, and Gichuki 1994; Barrett, Place,
and Aboud 2002).
Land Management
Agricultural production and land conditions are affected by land management
practices, including both private decisions made by farm households and collective
decisions made by groups of farmers and communities. For example, farm house-
holds make decisions about land use (whether, for example, cropland or grazing
land), the crop types to plant, the amount of labor to use, and the types and amounts
of inputs, investments, and agronomic practices to use to conserve soil and water,
improve soil fertility, reduce pest losses, and so on. Communities also can influence
CONCEPTUAL FRAMEWORK AND HYPOTHESES
35
land management through their collective decisions. They may make investments
on communal land areas (e.g., erosion controls on degraded lands, tree planting) or
private lands (e.g., drainage investments as part of watershed conservation and
development efforts) or regulate use of communal land (e.g., restrictions on use of
grazing areas) or private lands (e.g., bylaws limiting burning or cutting of trees). As
argued above, these household and collective decisions affect current agricultural
production and income and affect the condition of land resources, thus influencing
potential future agricultural production and income.
Determinants of Income Strategies and Land Management
Income strategies and land management decisions are affected by many different
factors operating at different scales. These include factors that influence the relative
profitability and hence comparative advantage of different income strategies and
land management practices in a particular location, such as biophysical factors deter-
mining agricultural potential, population density, and access to markets and infra-
structure (Pender, Place, and Ehui 1999; Pender, Scherr, and Durˇn 2001). These
factors largely determine the comparative advantage of a location by affecting the
costs and risks of producing different commodities, the costs and constraints to
marketing, local commodity and factor prices, and the opportunities and returns
to alternative activities, such as farming versus nonfarm employment. These factors
may have generalized effects at the village or higher level on income strategies and
land management, such as through their influence on local prices of commodities
or inputs, or they may affect household-level factors such as average farm size.
Another important factor influencing income strategies and land manage-
ment is access to programs and services, such as government or nongovernmental
organization (NGO) technical assistance and microşfinance institutions, education
and health services, and so on. Some of these programs and services, such as access
to technical assistance and education, can affect local comparative advantages by
increasing access to technologies and information, thus expanding households'
available production and marketing possibilities. These and other programs and
services also influence household constraints that affect income strategies and land
management, such as limited access to finance and production inputs or labor con-
straints related to the health status of individuals.
Local institutions also have important influences on income strategies and land
management. In much of the East African highlands, customary land tenure insti-
tutions determine what land use rights and land management obligations farmers
have, how secure those rights are, whether those rights may be transferred or used
as collateral, how conflicts are resolved, and other questions. Such institutions
can have substantial effects on land management by regulating land use and land
36
JOHN PENDER, SIMEON EHUI, AND FRANK PLACE
management decisions, by facilitating or inhibiting collective action, and by affect-
ing households' incentive and ability to invest in land management practices
(Feder et al. 1988; Place and Hazell 1993; Platteau 1996; Otsuka and Place 2001a;
Meinzen-Dick et al. 2002; Nkonya et al. 2005a). They may also influence (and
be influenced by) households' income strategies. For example, local institutions may
limit certain types of extractive activities such as timber cutting in forests, brick
making in wetlands, or extensive livestock grazing. But these institutions may also
change in response to new income-earning opportunities and relative factor scarcities
(Boserup 1965; Hayami and Ruttan 1985; North 1990; Platteau 1996).
Although local institutions can evolve in response to changes in economic
opportunities and scarcities, they are also largely affected by history and cultural
factors and preferences; thus, institutional change may be path-dependent and
resistant to change in many circumstances (North 1990). For example, historical
changes in property rights in Ethiopia and Eritrea have not always occurred accord-
ing to the predictions of the economic theory of property rights (Joireman 2001).
In some cases changes were driven by outside influences (e.g., by feudal lords in
southern Ethiopia and Italian colonists in Eritrea) rather than being endogenous
responses to changing factor scarcities, whereas in other regions of Ethiopia (e.g., in
Shoa province) the property rights system was resilient against change despite large
changes in land scarcity. Besides differences in cultural factors, the power and inter-
ests of local political elites are also important determinants of whether and how
changes in such local institutions occur (Joireman 2001). Platteau (1996) documents
numerous cases throughout Africa in which the evolutionary theory of property
rights fails to explain the nature of change in property rights systems.
Culture is also an important determinant of local consumption preferences
and uses of factors of production. If markets are imperfect, production decisions are
not separable from consumption preferences (Singh, Squire, and Strauss 1986; de
Janvry, Fafchamps, and Sadoulet 1991); as a result, preference of a particular com-
munity for a certain type of staple food (e.g., teff in the Ethiopian highlands or
matooke in central Uganda) may greatly affect the agricultural production system.
For example, the prevalence of religious fasting periods in Ethiopia, during which
individuals do not consume meat or dairy products, greatly influences the pros-
pects for commercial livestock production for the domestic market. Similarly, reli-
gious prohibitions against consumption of pork by Muslims and Orthodox Chris-
tians limits the opportunities for pig production, and the large number of religious
holidays celebrated by Orthodox Christians in Ethiopia (e.g., more than 100 days
per year when agricultural work is prohibited; REST 1995), together with require-
ments that adults contribute 20 days of labor per year to mass mobilization labor
CONCEPTUAL FRAMEWORK AND HYPOTHESES
37
campaigns, may have a large influence on households' income strategies and land
management decisions.
Household-level factors such as households' endowments of physical assets (e.g.,
livestock and equipment), "human capital" (assets embodied in people's knowledge
and abilities, such as education, experience, and training), "social capital" (assets
embodied in social relationships, such as through participation in organizations or
informal networks), "financial capital" (access to liquid assets, including credit and
savings), and natural capital (assets embodied in natural resources, including the
quantity and quality of land, access to other resources) may also determine the
income strategy and land management practices pursued by particular households.
For example, education and access to financial and social capital may be critical in
determining households' ability to take advantage of remunerative nonfarm oppor-
tunities (Barrett, Reardon, and Webb 2001), although these advantages may have
mixed impacts on farmers' land management decisions, facilitating use of capital
inputs but possibly undermining use of labor inputs by increasing the opportunity
cost of labor (Reardon, Crawford, and Kelly 1994; Clay, Reardon, and Kangasniemi
1998; Pender and Kerr 1998). We discuss these and other hypotheses about impacts
of specific factors further in the next section.
Government Policies, Programs, and Institutions
Government policies, programs, and institutions at many levels may influence
income strategies and land management and their implications for production,
resource conditions, and household income. Macroeconomic, trade, and market-
liberalization policies will affect the relative prices of commodities and inputs in gen-
eral throughout a nation. Agricultural research policies affect the types of technolo-
gies that are available and suitable to farmers in a particular agro-ecological region.
Infrastructure development, agricultural extension, conservation technical assistance
programs, land tenure policies, and rural credit and savings programs affect aware-
ness, opportunities, and constraints at the village or household level. Policies or pro-
grams may seek to promote particular income strategies (e.g., nontraditional export
cash crop production) or may seek to address constraints arising within a given
income strategy (e.g., credit needs arising in cash crop production). Programs may
attempt to address land management approaches directly, for example, by promot-
ing particular soil fertility management practices. Policies and programs may also be
designed to affect development outcomes directly, for example, through direct man-
agement of land by the government, or through nutrition or cash-transfer programs.
The opportunities and constraints for changes in policies are of course influ-
enced by the political context, which can vary greatly from one location or temporal
38
JOHN PENDER, SIMEON EHUI, AND FRANK PLACE
context to another. The examples of the different policy environments and ap-
proaches cited in Chapter 1 illustrate this point, but different political contexts can
lead to different policy "spaces" even within the same country and time frame. For
example, decentralization policies in Ethiopia have provided differential autonomy
for regional governments to respond to local perspectives in designing and imple-
menting environmental policies and agricultural programs, with greater autonomy
allowed in the Tigray Region than in the Southern Nations, Nationalities and
People's Region (SNNPR) (Keeley and Scoones 2003). As with other contextual
factors, such as culture and local histories, the local political context may lead to
different responses and outcomes, even in areas that are otherwise similar in terms
of natural endowments, access to markets, population pressure, and other socio-
economic conditions.
Currently available information does not provide policy makers with much
guidance as to which of these intervention points will be most effective in achieving
better land management, increasing agricultural production, ensuring sustainable
use of resources, and increasing incomes and welfare. Much public action aimed at
improving land management focuses on influencing household adoption of partic-
ular technologies. Yet this may be ineffective if the technologies are not suited to the
income strategies that have potential in a given location, or it may miss opportunities
for achieving larger impacts by focusing on other areas of intervention. Further-
more, the trade-offs or complementarities of different interventions in their impacts
on development outcomes need to be assessed. This conceptual framework serves
as a basis for addressing these information gaps through the studies in this book.
Hypotheses
The central hypothesis of the research reported in this book is that appropriate
strategies for sustainable rural development and land management depend on the
comparative advantages that exist for people in a particular location.2 For example,
opportunities for development of high-value perishable commodities, such as hor-
ticultural crops or dairy, are likely to be greatest in areas with relatively high market
access and favorable agricultural potential. In such areas, investments in appropri-
ate forms of market infrastructure and institutions may yield high social returns
and facilitate a process of sustainable development. In areas more remote from
markets or having lower agricultural potential, alternative income strategies, such as
extensive livestock production or forestry, may have a greater comparative advan-
tage, and development strategies addressing these livelihoods (e.g., promotion of
improved institutions of common property resource management) are more likely
to be effective.
CONCEPTUAL FRAMEWORK AND HYPOTHESES
39
We hypothesize that different income strategies and land management prac-
tices are affected by differences in comparative advantage and that these are largely
determined by differences in agricultural potential, access to markets, infrastructure
(e.g., roads, electricity, communication), and population density. Population den-
sity indicates the relative endowment of land and labor (the two primary factors
determining production of agriculture in the East African highlands), and these,
together with the agricultural potential in a particular location and available tech-
nology, determine the agricultural production possibilities. Access to markets and
infrastructure, together with factor endowments and agricultural potential, largely
determines the local relative prices of inputs and outputs, which determine farmers'
comparative advantages in choice of outputs and inputs, as explained in further
detail below. The comparative advantage of pursuing nonagricultural versus agri-
cultural livelihoods is also largely affected by households' access to markets and
potential for agricultural production. Other factors, such as access to new tech-
nologies via technical assistance, access to credit, education, land tenure, household
wealth, and others, can also influence livelihoods and land management practices
by affecting the information that farmers have access to and the constraints that
they face, irrespective of local comparative advantages.
Agricultural Potential
Agricultural potential is an abstraction of many factors, including rainfall, altitude,
soil type and depth, topography, access to irrigation, presence of pests and diseases,
and others, that influence the absolute (as opposed to comparative) advantage of
producing agricultural commodities in a particular place. There are, of course, vari-
ations in potential depending on which commodities are being considered. Fur-
thermore, agricultural potential is not a static concept but changes over time in
response to changing natural conditions (such as climate change) as well as human-
induced conditions (such as land degradation). Throughout this section, we discuss
agricultural potential and other multidimensional concepts such as market access
in a simplified heuristic fashion to help define the generic set of hypotheses for
empirical research, recognizing that there can be complex implications of variations
in the component dimensions of these concepts that we will not be able to fully
illuminate.
If all markets were perfect and transactions were costless, farmers' production
choices would be based on maximizing profits from current production and on
maximizing the net present value of investments (Singh, Squire, and Strauss 1986;
de Janvry, Fafchamps, and Sadoulet 1991). In such a scenario (unrealistic as it is),
choices about agricultural production and land management would depend only
on exogenous prices and biophysical factors determining agricultural potential,
40
JOHN PENDER, SIMEON EHUI, AND FRANK PLACE
which together would determine the profitability of alternative agricultural decisions.
Other factors would be important in determining prices, but these would not vary
across households in the context of perfect markets. Thus, variations in agro-
ecological conditions would be the primary determinant of variations across house-
holds and locations in agricultural decisions.
In the perfect markets case, one would expect all land to be allocated to its
most profitable uses. Because different agro-ecological conditions are suitable for
different types of commodities, we would expect different income strategies to
be favored in different conditions. For example, perennial crops such as coffee and
bananas generally grow better in higher bimodal rainfall areas. On the other hand,
some annual crops, such as many cereals and cotton, grow better in less humid
environments with a single long growing period. This suggests that perennial crops
are likely to be found in the more humid bimodal rainfall zones and that many
annual crops would be found in drier unimodal rainfall zones. However, these
choices also depend on prices: if prices of cereals were high enough, they might be
grown throughout East Africa.
In areas of generally higher agricultural potential, such as in highland areas
having favorable rainfall and fertile volcanic soils, we would expect the highest-
value commodities, such as horticultural crops, tea, and coffee, to be produced.
Lower-value commodities such as cereals are more likely to be grown in areas of
lower potential, along with complementary livestock production (McIntire, Bourzat,
and Pingali 1992). Extensive livestock grazing is likely to be found in lower-rainfall
areas not well suited to continuous crop production. In a more realistic market
context, production of some of these high-value commodities, particularly perish-
able vegetables and fruits, may be inhibited by limited access to markets and infra-
structure, and food crops may need to be grown in areas of low market access to
satisfy subsistence requirements regardless of profitability (Omamo 1998).
If insurance markets are missing or imperfect, agro-ecological conditions may
also influence income strategies by affecting risks (Binswanger and McIntire 1987).
For example, households may seek to diversify their income sources and crops as
a means of coping with production or price uncertainty (Binswanger and McIntire
1987; Ellis 2000; Barrett, Reardon, and Webb 2001). Such considerations may
lead to greater diversification or to adoption of less profitable but less risky crops
in areas where rainfall is more uncertain, as in drought-prone areas. Risks of pests
and diseases also could lead to similar risk-management strategies.
Agro-ecological conditions also influence labor intensity and land management
practices. In general, higher agricultural potential is expected to be associated with
higher labor intensity and adoption of more labor and input-intensive practices,
by increasing the marginal return and/or reducing the risks of these inputs (Barrett
CONCEPTUAL FRAMEWORK AND HYPOTHESES
41
et al. 2002). For example, fertilizer use is likely to be less profitable and more risky
in low-rainfall areas because nutrient uptake may be limited by inadequate soil mois-
ture. Higher-rainfall areas may be associated with greater adoption of vegetative
land management practices such as use of agroforestry, live barriers, and mulching
because of higher biomass productivity in such areas. By contrast, adoption of
some soil and water conservation measures may be more profitable and less risky in
low-rainfall areas because they may have a larger impact on yields in the short run
by conserving scarce soil moisture and may be less prone to harboring pests and
weeds than in high-rainfall environments (Herweg 1993a,b).
The impacts of more favorable agro-ecological conditions on crop production
and incomes are expected to be positive. Higher agricultural potential is expected
to promote more intensive and productive use of inputs and production of higher-
value crops as noted above, leading to higher value of crop production and income.
Livestock incomes may be higher in such areas because of greater availability of
feed sources. On the other hand, farmers in high-potential areas may have less com-
parative advantage in livestock production because of higher profitability of crop
production and because problems of animal pests and diseases are generally greater
in more humid environments. Nonfarm opportunities linked to agricultural pro-
duction are likely to be greater in higher-potential areas (Haggblade, Hazell, and
Brown 1989; Reardon 1997; Barrett, Reardon, and Webb 2001), although house-
holds may be less prone to pursue such opportunities given the higher profitability
of farming in these areas. Overall, we expect household incomes to be higher in
higher-potential environments, controlling for differences in access to land and other
resources.
The expected impacts of agricultural potential on land degradation are mixed.
In higher-potential areas, there is likely to be more planting of perennial crops and
more vegetative cover of the soil in general, which helps to limit soil erosion. How-
ever, the higher rainfall in such areas may be more erosive, especially in steeply
sloping areas such as in the highlands. Soil nutrient depletion may be higher in
such areas as a result of greater offtake of biomass from fields, especially if use of
fertilizer or other means of soil fertility restoration is limited. Thus, some aspects
of land degradation may be worse in higher-potential zones, even if other aspects
are better.
Access to Markets and Infrastructure
Access to markets and infrastructure is critical for determining the comparative
advantage of a given location, given its agricultural potential. For example, a com-
munity with an absolute advantage in producing perishable vegetables (i.e., total
factor productivity in vegetable production is higher there than anywhere else) may
42
JOHN PENDER, SIMEON EHUI, AND FRANK PLACE
have little or no comparative advantage (low profitability) in vegetable production
if it is far from roads and urban markets. As with agricultural potential, market access
is also a multidimensional and dynamic concept (e.g., distance to roads, condition of
roads, distance to urban centers, access to foreign markets, degree of competition,
access to transport facilities).
Because of the substantial transaction costs of storing, transporting, and mar-
keting commodities, access to markets and roads is critical for determining the
comparative advantage of a particular location, given its agricultural potential. Fol-
lowing von ThŘnen (1826), we postulate that land will be allocated to its highest-
rent use, which in areas close to urban markets is more likely to be in production
of intensive high-value commodities that involve substantial transport costs (such
as vegetables and dairy products) or used for industrial purposes than in produc-
tion of lower-value and more transportable food grains or livestock using extensive
methods or natural forest (Chomitz and Gray 1996).3 Even if high-value crops are
more profitable than food commodities further from markets, farmers faced with
high transport costs may need to produce low-value crops for their subsistence
purposes rather than higher-value cash crops (Omamo 1998; Key, Saudolet, and
de Janvry 2000).
In areas of high market and road access, production of perishable high-value
crops such as horticultural crops is likely to be profitable if agro-ecological condi-
tions are suitable. These may displace other, less perishable and profitable cash crops
such as coffee to areas somewhat more remote from markets because such crops can
be transported over greater distances at lower costs than perishable commodities.
Other bulky food crops may also have a comparative advantage close to urban areas,
given their high transport costs, or be grown for subsistence purposes in more remote
areas. More storable and transportable crops, such as cereals and legumes, are likely
to have a comparative advantage further from markets and roads because they can
be stored and transported over longer distances than other commodities.
Dairy production and other intensive livestock operations are also more likely
to be found close to urban areas because of economies of scale in production and
marketing, high transport costs, perishability of the products (e.g., limited viability
of milk), and the need for market access to purchased compound feeds. Extensive
production of livestock that are relatively easy to transport, such as cattle and small
ruminants, can occur in areas far from markets and is likely to have a comparative
advantage in areas that are low in potential for crop production.
Opportunities for rural nonfarm activities are also likely to be greater closer to
urban markets and roads (Haggblade, Hazell, and Brown 1989; Reardon 1997; Bar-
rett, Reardon, and Webb 2001). This includes activities linked to agriculture, such
as processing agricultural commodities, commodity trading, and provision of agri-
CONCEPTUAL FRAMEWORK AND HYPOTHESES
43
cultural inputs as well as other activities stimulated by higher demand resulting
from higher incomes in areas of better access. Employment opportunities in urban
industries are also likely to be greater for people who live closer to urban centers.
Better access to markets and roads is expected to increase the use of purchased
inputs and the capital intensity of agriculture by increasing the profitability and
availability of such inputs and increasing farmers' access to credit (Binswanger and
McIntire 1987). However, the effects of market and road access on labor intensity
and land management are ambiguous. For example, the level of commodity prices
has a theoretically ambiguous influence on soil conservation investments (LaFrance
1992; Pagiola 1996). Higher access implies that the marginal return from labor
invested in crop production and land management is higher (because output and
land prices are increased) (Binswanger and McIntire 1987), but the opportunity
costs of labor are also likely to be higher. The net result depends on which effect
is stronger (Barbier and Bergeron 2001). The positive effect of market and road
access on input use may have further influences on use of labor-intensive practices,
depending on whether capital- and labor-intensive practices are complements or
substitutes.
The effects of market and road access on the value of crop production are also
ambiguous. To the extent that better access promotes production of higher-value
crops, increases the local prices of crops, and promotes more intensive use of inputs,
it tends to increase the value of crop production. However, as mentioned above, bet-
ter access also may reduce the labor intensity of crop production and thus could
reduce the value of output.
Given the ambiguous effects of market and road access on land management,
the effects on land degradation are also, not surprisingly, ambiguous. By increasing
the profitability of agricultural production, greater market access will promote
expansion of production into forest areas or other fragile lands if the costs of pro-
ductive factors and output prices are unaffected by market access (Angelsen 1999),
which will increase land degradation in such areas. However, if the costs of factors
rise because of constrained supply or prices fall as a result of inelastic demand, a
reduction in agricultural area (and hence the pressure on forests and other fragile
lands) is possible as productive factors are concentrated on the most profitable lands
(Angelsen 1999). Market-driven intensification may also contribute to land degra-
dation by leading to reduced fallowing (Binswanger and McIntire 1987), which
will contribute to declining soil fertility and increased erosion (from reduced vege-
tative cover) unless sufficiently offset by adoption of more intensive soil fertility man-
agement and soil conservation practices. Improved market access may contribute
to increased use of animal draft power for tillage (Binswanger and McIntire 1987),
which may contribute to soil erosion on sloping lands. Commercialization of
44
JOHN PENDER, SIMEON EHUI, AND FRANK PLACE
agricultural commodities also can contribute to depletion of soil nutrients if the
nutrients being exported from the farming system in the form of commodity sales
are not adequately replenished by fertilizers or other nutrient sources (de Jager,
Nandwa, and Okoth 1998). On the other hand, market-driven intensification may
lead to reduced erosion and improved soil fertility management as a result of the
increased incentive to invest in land improvements, given the rising value of land
relative to labor (Tiffen, Mortimore, and Gichuki 1994).
Regardless of its net influence on crop production, better market and road access
is expected to have a positive effect on income because access increases households'
income earning opportunities, whether through increased agricultural production
or through nonfarm activities.
Irrigation
Irrigation is a form of infrastructure that directly affects agricultural potential. As
with improvements in market access, irrigation investment can enable production
of higher-value crops such as horticultural crops. It likely contributes to labor inten-
sity by enabling multiple crops per year to be produced and by increasing the return
and/or reducing the risk of labor invested in crop production. If this intensification
increases the costs of productive factors (e.g., if wages rise as a result of increased
labor demand), irrigation may limit expansion of agricultural production, as in the
case of improved market access. Irrigation may promote investments in comple-
mentary soil and water conservation investments and practices, such as investments
in soil bunds and drainage (Pender and Kerr 1998). It may also encourage farmers
to adopt complementary productive inputs such as fertilizer, particularly where soil
moisture constraints limit farmers' willingness to use fertilizer (Pender, Place, and
Ehui 1999). As a result of these effects, irrigation is likely to contribute to increased
value of crop production and incomes.
The effects of irrigation on land degradation may be mixed. Irrigation increases
the incentive to invest in land improvement and soil fertility management by increas-
ing the value of such investments. On the other hand, irrigation may contribute to
problems of soil erosion or salinity if runoff and drainage are not managed ade-
quately. Irrigation can also contribute to increased soil nutrient mining by increas-
ing production and commercialization of crops unless adequate efforts are made to
replenish such nutrients. Irrigation also may have negative effects on people down-
stream as a result of reduced access to water or increased use of agrochemicals.
Population Pressure
Population pressure (indicated by higher population density) affects the expansion
of agriculture and the labor intensity of agriculture by affecting the land/labor
CONCEPTUAL FRAMEWORK AND HYPOTHESES
45
ratio. It may cause households to expand agricultural production into areas less suited
to agriculture, contributing to lower agricultural productivity and natural resource
degradation, as argued two centuries ago by Thomas Malthus and more recently by
his modern followers (e.g., World Commission on Environment and Develop-
ment 1987). But population pressure may cause households to intensify their use
of labor and other inputs on the land and may also induce innovations in tech-
nology, markets, and institutions or investments in infrastructure, thus possibly
mitigating or outweighing such negative Malthusian effects (Boserup 1965; Ruthen-
berg 1980; Hayami and Ruttan 1985; Binswanger and McIntire 1987; Tiffen,
Mortimore, and Gichuki 1994).
Population pressure is expected to increase labor intensity in agriculture by
increasing the availability (hence reducing the costs) of labor relative to land
(Boserup 1965). Higher labor intensity of agriculture can take the form of produc-
tion on more marginal lands, less use of fallow, adoption of more labor-intensive
methods of cultivation, labor-intensive investments in land improvement, and/or
adoption of more labor-intensive commodities (e.g., horticultural crops and inten-
sive livestock production) (Pender 2001). Income strategies that are land and
resource intensive, such as forestry and extensive livestock production, are likely
to be less viable in more densely populated settings. There may be greater opportu-
nities for rural nonfarm activities in more densely populated settings because
of larger markets and lower transaction costs, which will facilitate diversification of
economic activities (Tiffen, Mortimore, and Gichuki 1994).
Population pressure may also induce increases in the capital intensity of agri-
culture if capital is complementary to labor (e.g., use of draft animals; McIntire,
Bourzat, and Pingali 1992) or increase the "knowledge intensity" of agriculture
through adoption or adaptation of technologies (e.g., improved seeds, integrated
pest or soil nutrient management). It may also have more indirect (but still impor-
tant) effects by stimulating migration, investments in infrastructure, or technical or
institutional change (Pender 2001).
Population-induced intensification is likely to lead to higher yields and higher
value of crop production per hectare unless greater intensity is offset by land degra-
dation (Salehi-Isfahani 1988; Pender 2001). However, labor intensification may
lead to lower labor productivity and per capita income (as a result of diminishing
returns to labor) unless offset by technical change, improvement in infrastruc-
ture and market access, or other improvements in opportunities (Binswanger and
McIntire 1987; Salehi-Isfahani 1988; Pender 2001).
The impacts of population pressure on land degradation may be mixed. Land
degradation may increase as a result of cultivation on fragile lands, reduced use
of fallow, increased tillage, mining of soil nutrients, and other potential results of
46
JOHN PENDER, SIMEON EHUI, AND FRANK PLACE
agricultural expansion and intensification, consistent with Malthusian predictions.
On the other hand, more labor-intensive investments in land improvements and
soil fertility management practices as a consequence of lower wages relative to land
values resulting from population pressure may improve land conditions, consistent
with Boserup (Scherr and Hazell 1994; Tiffen, Mortimore, and Gichuki 1994;
Pender 2001). Considering these issues, some have argued that there may be a
U-shaped response of natural resource conditions as rural population increases,
with initial degradation followed by improvement as population and resource
degradation reach a point at which it becomes profitable to invest in conserving
and improving resources (Scherr and Hazell 1994; Pender 1998; Otsuka and Place
2001a). However, such favorable responses may not be automatic (even if invest-
ments in resources become profitable), as they depend on the existence or devel-
opment of a favorable institutional environment for investment (e.g., secure and
individualized property rights) (Scherr and Hazell 1994; Pender 1998; Otsuka
and Place 2001a).
Development Domains
These factors (agricultural potential, market access, and population pressure) inter-
act with each other in complex ways. Population density tends to be higher where
there is greater agricultural potential or greater market access because people have
moved to such areas in search of better opportunities. On the other hand, popu-
lation pressure may have contributed to land degradation, reducing agricultural
potential from what it once was. Market access tends to be better where there is a
higher population density because the per capita costs of building roads are lower
and the benefits higher in such circumstances. Market access also tends to be better
where agricultural potential is higher because the returns to developing infrastruc-
ture are greater.
Some of these relationships can contribute to self-reinforcing patterns of
development. For example, population growth in a region increases the size of the
local market and hence the profitability of local industry and agriculture (where
economies of scale or transport advantages are involved), thus leading to increased
local wages and further population growth through immigration (Krugman 1998).
On the other hand, some of these relationships may cause offsetting tendencies.
For example, population growth may lead to land degradation, which increases pro-
duction costs and undermines the potential for intensifying agriculture, even as the
demand for local agricultural production increases.
Despite these interrelationships, there is still substantial independent variation
of these factors in the East African highlands. Given such variations, and the fact
CONCEPTUAL FRAMEWORK AND HYPOTHESES
47
that most of these factors change relatively slowly over time, it is useful to consider
different development domains represented by variations in these variables. Over-
laying the indicators used in Figures 1.2, 1.3, and 1.4, we represent one pos-
sible classification of development domains in East Africa in Figure 2.2 (see color
insert).
The potentials for different income strategies, land management practices, and
the effects of policies influencing these decisions are likely to vary across such
domains (Pender, Place, and Ehui 1999). For example, commercialization of high-
value perishable crops such as fruits and vegetables may be highly profitable and
feasible in areas of high agricultural potential and favorable market access (which
are also usually densely populated), such as highland areas close to major urban
centers in central Kenya and Ethiopia (Table 2.1). Dairy production and other inten-
sive livestock production also are likely to be profitable in such regions because of
the demand for milk and meat in urban areas, its high perishability and transport
costs, and availability of feed supplies. High-value, but less perishable, crops such as
coffee and tea and lower-value food crops also can be produced in areas of high
potential and market access, though the profitability of many of these crops may
be lower than that of high-value perishable commodities in these areas. Rural
Table 2.1Hypotheses about income strategies in different development domains in the East
African highlands
Market access
Agricultural
potential
High
Medium/low
High
Central Kenya, Uganda, and Ethiopia near
Southwestern Ethiopia, western Kenya, southwestern
urban centers
and eastern Uganda
Perishable cash crops
Nonperishable cash crops
Dairy, intensive livestock
Intensive food crop production
Nonperishable cash crops
Livestock production (especially in areas of
Intensive food crop production
moderate population density)
Rural nonfarm development
Low
Parts of northern/eastern Ethiopia near
Much of northern and eastern Ethiopia
urban centers
With irrigation investment:
With irrigation investment:
Intensive food crop production
Intensive food crop production
Without irrigation investment:
Perishable cash crops
Low-external-input cereals
Dairy, intensive livestock
Extensive livestock production (in areas of low
Without irrigation investment:
population density)
Low-external-input cereals
Woodlots/forestry/beekeeping (especially in
Rural nonfarm development
low-density areas)
Emigration
Source: Adapted from Pender, Place, and Ehui (1999).
48
JOHN PENDER, SIMEON EHUI, AND FRANK PLACE
nonfarm development, linked to agricultural production through development of
input supply and agricultural processing industries and demand linkages for rural
services, also may have strong prospects in high-potential, high-access areas.
Areas with high agricultural potential but less favorable market access, such as
significant parts of the highlands of southwestern Ethiopia, western Kenya, and
eastern and southwestern Uganda, likely have a comparative advantage in producing
high-value (relative to their volume) nonperishable commodities (such as coffee)
that can be transported over relatively long distances. Given the high costs and risks
of depending on imported food in such areas, farmers may continue producing
most of their own food crops until improvements in roads and transportation ser-
vices, as well as increased production of food crops in other regions, allow imported
food to be more economical and less risky. At this stage of development, com-
plementary linkages between crop and livestock production are important, with
animals providing a source of draft power, manure, and food protein, and crop
residues an important source of feed (McIntire, Bourzat, and Pingali 1992). Thus,
opportunities for livestock production linked to crop production are also likely to
be important, particularly in areas of low or moderate population density with
sufficient available land to provide fodder. There is likely to be good potential for
adoption of purchased inputs in such areas, financed by sales of cash crops or live-
stock, as a way to improve local food supplies as well as income.
In lower-potential areas, such as the moisture-stressed highlands of northern and
eastern Ethiopia, adoption of input-intensive food crop production may be risky
and of limited profitability in rainfed conditions. Where irrigation and good market
access are available, intensive production of food and cash crops is likely to be profit-
able. Increased production of cereals and fodder in irrigated areas may also facilitate
intensive dairy or other livestock production in areas close to cities. In nonirrigated
low-potential areas, the agricultural options are more limited. Soil and water conser-
vation investments may yield significant returns in moisture-stressed areas and may
facilitate targeted and limited use of fertilizer and other inputs where soil moisture is
adequate. Where population density is high and farms are very small, farmers in such
low-potential environments may be unable to produce sufficient surplus to finance
purchase of inputs. Thus, this will be most feasible closer to urban areas where non-
farm sources of income are available, where rural industries are developing, or where
seasonal migration (or remittances from permanent migrants) is common.
In more remote low-potential areas with low population density, improve-
ment of extensive livestock production may offer development potential. Achiev-
ing this potential may require the strengthening of collective action institutions
to encourage investments in improvements of grazing lands, perhaps by planting
and managing fodder grasses and trees. Tree planting and related activities, such as
CONCEPTUAL FRAMEWORK AND HYPOTHESES
49
beekeeping, may also provide opportunities for significant incomes and welfare
improvement, especially where market access is relatively good.
The most difficult cases in terms of viable income strategies are areas with low
agricultural potential, without irrigation, that are far from markets and are densely
populated (as in parts of the northern Ethiopian highlands). In some cases, partic-
ularly in less densely populated areas close to forests, forestry and beekeeping activ-
ities can be important. Where natural forests have been depleted or are protected,
tree planting may be profitable. Small ruminants can be efficient users of available
fodder resources and can be transported long distances to market, though inten-
sification of their use will be limited by availability of fodder or grazing materials.
Rehabilitation of degraded lands, investment in soil and water conservation struc-
tures, and low-external-input methods of soil fertility enhancement also may have
significant potential to improve land productivity. Nevertheless, these seem unlikely
to solve the long-term poverty problem facing such communities. Emigration (short
or long term) is likely to be an important element of the livelihood strategy for
many households in these areas.
Income Strategies
Income strategies influence land management and labor intensity. For example,
production of high-value horticultural crops or other cash crops will promote greater
use of purchased inputs, labor, and adoption of labor-intensive land improvements
such as terraces because higher-value production increases the value of these inputs
and the ability to finance them (e.g., Tiffen, Mortimore, and Gichuki 1994; Barrett
et al. 2002). Mixed cropşlivestock producers are more likely to apply manure to
their crops because they have greater access to this bulky resource. When credit is
constrained, households with greater access to off-farm income may be more prone
to use inputs or make investments that require cash, such as fertilizer or hired labor
(Reardon, Crawford, and Kelly 1994; Clay, Reardon, and Kangasniemi 1998; Pen-
der and Kerr 1998; Reardon et al. 2001). On the other hand, households with
greater off-farm opportunities may be less prone than others to invest labor in
crop production or labor-intensive land management practices because their
opportunity costs of labor may be higher (if labor markets are imperfect) (Scherr
and Hazell 1994; Pender and Kerr 1998).
By influencing crop choice and the intensity of input use, income strategies
affect the value of agricultural production. For example, the value of crop produc-
tion is expected to be higher for producers of high-value crops than other producers.
Income strategies may also affect the value of agricultural production by affecting
the ability of households to produce and market their commodities. For example,
households that specialize in production of certain crops may develop better ability
50
JOHN PENDER, SIMEON EHUI, AND FRANK PLACE
to produce and market their crops than those that are more diversified. Livestock
producers may obtain better crop production because of deposition of animal
manure on their fields (even if they are not investing effort in collecting and apply-
ing manure). Households involved in nonfarm activities may have advantages in
liquidity and risk management that enable them to obtain better prices for their
crops (e.g., by not being forced to sell right at harvest).
Income strategies may also have impacts on land degradation. For example,
households producing higher value crops or having nonfarm income may be more
likely to replenish soil fertility by using fertilizer, or may invest more (or less) in soil
and water conservation measures, as argued above. The impacts on land degrada-
tion will depend on the net effects of decisions affecting crop choice, input use, and
land management practices.
Income strategies are also expected to affect household incomes and poverty.
Households able to rely on high-value crops, intensive livestock systems, or remu-
nerative nonfarm activities are likely to earn higher incomes than those confined to
subsistence food crop production (Tiffen, Mortimore, and Gichuki 1994; Barrett,
Reardon, and Webb 2001). On the other hand, households dependent on low-wage
off-farm employment may be poorer than even subsistence farm households.
Access to Programs and Services
As noted earlier, access to programs and services can influence the income strategies
and land management practices of communities and households by affecting their
access to information about technologies, their capacities to effectively use tech-
nologies or to organize collective action, and their financial or other constraints.
In this subsection, we consider three types of programs and organizations that are
expected to have significant influence on income strategies and land management:
technical assistance programs and organizations, credit and microfinance programs
and organizations, and educational services.
Technical assistance programs and organizations. Because natural resource man-
agement (NRM) technologies are knowledge-intensive (Barrett et al. 2002), tech-
nical assistance is likely to be an important determinant of their adoption. Presence
of programs and organizations is likely to improve delivery of NRM technologies
(Swinkels and Franzel 1997). However, the effects of participation in programs and
organizations will likely depend on their focus.
Credit. Credit programs may enable farmers to purchase inputs or acquire
physical capital, thus contributing to technology adoption and increased capital and
CONCEPTUAL FRAMEWORK AND HYPOTHESES
51
input intensity in agriculture (Feder, Just, and Zilberman 1985). This may promote
increased production and marketing of high-value crops or intensification of live-
stock production and a reduction of subsistence food crop production. If credit
availability helps to relax capital constraints, this can reduce the extent to which
households discount the future (Pender 1996; Holden, Shiferaw, and Wik 1998),
possibly leading to more investment in soil and water conservation (Pender and
Kerr 1998). Credit may also facilitate labor hiring and thus promote labor inten-
sification. On the other hand, credit availability may enable households to invest
in nonfarm activities and may thus contribute to less intensive management of
land and other agricultural resources. Also, by promoting intensification of capital
and purchased inputs, credit may reduce labor-intensive land management prac-
tices that are substitutes for these (e.g., fertilizer use may reduce use of manure and
compost). The net effects of credit on land management, crop production, and land
degradation are thus ambiguous. The impact of credit availability on income is
likely to be positive, provided households have profitable uses for it (otherwise the
effect may be nil or even negative).
Education. Education is likely to increase households' opportunities for salary
employment off farm and may increase their ability to start up various nonfarm
activities (Barrett, Reardon, and Webb 2001; Deininger and Okidi 2001). Educa-
tion may increase households' access to credit as well as their cash income, thus
helping to finance purchases of physical capital and purchased inputs. This may
help to promote production of high-value crops and intensive livestock production
as well as promoting greater use of such capital and inputs in producing traditional
food crops. Education may also promote changes in income strategies and tech-
nologies by increasing households' access to information about alternative market
opportunities and technologies, and hence households' ability to adapt to new
opportunities (Feder, Just, and Zilberman 1985). On the other hand, more edu-
cated households may be less likely to invest in inputs or labor-intensive land
investments and management practices because the opportunity costs of their labor
and capital may be increased by education. Thus, the net impacts of education on
land management, crop production, and land degradation are ambiguous. The
impact on household income is expected to be positive.
Property Rights and Land Tenure
Property rights and the form of land tenure can affect land management and pro-
ductivity for several reasons. If there is insecurity of tenure, the household oper-
ating the plot may have less incentive to invest in land improvement (Feder et al.
52
JOHN PENDER, SIMEON EHUI, AND FRANK PLACE
1988). This is not necessarily the case, however, if the household can increase
tenure security by investing in the land (Besley 1995; Otsuka and Place 2001b). In
that case, there may be more investment on land having insecure tenure.
Perhaps more important for land management than security of tenure is the
set of rights associated with the different tenure systems. Owners of freehold land
have complete rights to use, lease, sell, bequeath, and mortgage their land. Owners
or occupants of lands under other tenure systems may have more restricted rights,
including restrictions on sales, leasing, and mortgaging. These restrictions may
reduce farmers' access to credit, where land is (or could be) used as collateral for credit
(Feder et al. 1988; Place and Hazell 1993). If so, farmers having more complete
property rights (such as ownership under freehold tenure) may be more prone than
other farmers to use cash inputs or make investments. The effects of this would be
similar to the effects of increased access to credit discussed above. Also, to the extent
that land sales or lease rights enable households to recoup the value of land improve-
ments, owners with more complete transfer rights may be more likely to make in-
vestments in land improvement (Pender and Kerr 1999; Deininger et al. 2003).
Ownership of a formal title may amplify the impacts of greater tenure security
and complete land rights associated with freehold by providing proof of freehold
status. In particular, formal title may facilitate access to credit and help to prevent
or resolve land disputes (Feder et al. 1988). However, whether land titles have the
hypothesized positive impacts on tenure security, credit access, and investment
in the African context has been much debated in the literature (Shipton 1988;
Haugerud 1989; Atwood 1990; Barrows and Roth 1990; Migot-Adholla et al.
1991; Place and Hazell 1993; Bruce and Migot-Adholla 1994; Besley 1995; Plat-
teau 1996; Sjaastad and Bromley 1997; Nkonya et al. 2004). Limited or adverse
impacts of land titles on security and investment in Africa may be caused by many
factors, including adequate security of customary tenure, rent-seeking opportunities
created by titling efforts, limited availability of rural credit regardless of whether
land is usable as collateral, limited ability to foreclose on mortgaged land, use of
collateral substitutes by credit organizations, lack of updating of titles following
sales or land subdivision because of high costs, or other factors.
In addition to tenure status and land title, the means of acquisition of land
may also influence farmers' tenure security and incentives to invest in land man-
agement. For example, tenants on rented or borrowed land are unlikely to invest in
soil and water conservation measures or in perennial crops if the lease or borrowing
arrangement is relatively short term, regardless of the tenure system under which
the landholder claims the land. Tenants on sharecropped plots may have less incen-
tive to apply labor and other inputs than owner-operators or tenants using fixed
rental (Shaban 1987; Otsuka and Hayami 1988). By contrast, owners of purchased
CONCEPTUAL FRAMEWORK AND HYPOTHESES
53
land and tenants using cash rental may have more incentive than owners of inher-
ited land to produce cash crops and apply inputs in order to be able to recoup the
costs of their investment and repay any loans used to finance the investment. Land
users who have encroached on public or communal lands may face substantial
tenure insecurity; and this may prevent them from undertaking investments or fal-
lowing unless such investments are perceived as increasing the land user's tenure
security (Otsuka and Place 2001a).
Household Endowments
If factor markets (markets for land, labor, and capital) do not function efficiently,
then there may be significant differences among households in their land manage-
ment practices and agricultural productivity (de Janvry, Fafchamps, and Sadoulet
1991). In the context of imperfect labor and land markets, agricultural households
with less land or a larger family labor endowment per unit of land can be expected
to use labor more intensively in agricultural production (Feder, Just, and Zilber-
man 1985). Essentially, the impacts of smaller farm size, or larger household labor
endowment controlling for farm size, will be similar to the effects of population
density if imperfections in labor or land markets limit the extent to which differ-
ences in labor endowments can be overcome through labor or land transactions.
Greater labor availability per unit of land may also induce households facing land
constraints to pursue alternative off-farm income strategies, such as wage employ-
ment and various nonfarm activities. The effect of smaller farm size or larger family
size on the value of crop production per hectare is likely to be positive if labor and
land markets are imperfect, or zero if these markets function well. The impact of
labor availability on household income is expected to be positive (as long as the
marginal product of labor is positive), though the impact on income per capita may
not be (if there are diminishing returns to labor). As with population pressure, the
impact of labor availability on land degradation is ambiguous.
If credit is constrained, farmers who own more livestock, equipment, or other
physical assets may be better able to finance the purchase of inputs or investments,
either by liquidating assets or through better access to credit. The impacts on crop
choice, land management, and labor intensity are thus qualitatively similar to the
impacts of access to credit discussed above and are ambiguous for the same reasons.
The impact of livestock on land degradation may be mixed and depends on
the type of degradation as well as on interactions between crops and livestock. Live-
stock may contribute to soil compaction and erosion along animal walkways, and if
draft animals are used for tillage, they also may contribute to erosion and com-
paction as a result of tillage operations. Livestock usually have a more positive role
in plant nutrient cycling at the household level. If farmers apply animal manure to
54
JOHN PENDER, SIMEON EHUI, AND FRANK PLACE
their crop plots, then it is likely that farmers with more animals would have higher
nutrient balances than those with fewer animals. However, farmers may fail to apply
manure or other organic materials to their crop plots for various reasons. Farmers
often keep animals close to the homestead, which implies greater availability of
manure close to the homestead. This, together with the difficulty of transporting
manure because of its bulkiness, implies that plots further away from the home-
stead are less likely to receive manure and other bulky organic materials such as
household wastes. Thus, we expect plots away from the residence to have lower
nutrient balances than those closer.
Farm equipment may also have mixed effects on land degradation. Plows and
other machinery may contribute to soil erosion through tillage, especially if used
on sloping lands. On the other hand, equipment may be used to help construct soil
and water conservation structures or to apply fertilizer or other inputs that help to
prevent soil erosion, nutrient depletion, or other forms of degradation.
The effect of livestock and other physical assets on household income is expected
to be positive, to the extent that such assets are accumulated for purposes of
increasing income. However, there may be other reasons for accumulating assets.
For example, livestock may be kept as a store of relatively liquid wealth and as an
insurance substitute, where financial and insurance markets are poorly developed
because of problems of covariate risk (Binswanger and McIntire 1987). Livestock,
jewelry, or other assets also may be accumulated for dowry or bequest purposes.
Thus, the impacts of some physical assets on income may be limited.
Summary of Hypotheses
The hypotheses are summarized in Table 2.2. In general, most factors have theoreti-
cally ambiguous impacts on agricultural production, land management, and land
degradation. Many factors have more unambiguous expected impacts on house-
hold incomes. These hypotheses suggest that the impacts of policy and program
interventions on agricultural production and land degradation may be very context
specific, and may often involve trade-offs among the objectives of increasing agri-
cultural production, reducing land degradation and increasing household incomes.
Empirical research is essential to understand these impacts and trade-offs, given the
theoretically ambiguous nature of most of these relationships.
In the remainder of this book, we present 13 case studies from Ethiopia, Kenya,
and Uganda that investigate many of these empirical relationships using a variety
of data sources and analytical methods. Many studies use econometric approaches
to investigate the effects of different factors on land management and outcomes, con-
trolling for confounding influences. Some of these studies are based on community
Table 2.2 Summary of hypotheses
Value of
Labor
agricultural
Land
Impacts of
Livelihood strategy
intensity
Land management practices
production
degradation
Income
Higher agricultural potential
+ Higher-value crops
+
+ Labor- or capital-intensive practices
+
+/ş
+
ş Lower-value crops
+ Agroforestry, vegetative methods
ş Extensive livestock
ş Some SWC measures
+/ş Intensive livestock
+/ş Nonfarm activities
Higher market/road access
+ Perishable cash crops
+/ş
+ Capital- and input-intensive practices
+/ş
+/ş
+/0
ş Storable crops
+/ş Labor-intensive practices
ş Subsistence food crops
+ Intensive livestock
ş Extensive livestock
+ Nonfarm activities
Higher population density
+ Labor-intensive activities
+
ş Land-intensive practices (fallow, slash
+/0
+/ş
0/ş
(food crops, horticulture,
and burn)
intensive livestock)
+ Labor-intensive practices
ş Land-intensive activities
+/ş Capital- and input-intensive practices
(extensive livestock, forestry)
+ Nonfarm activities
Livelihood strategy (cf.
NA
subsistence food crops)
ş High-value crops
+
+ Labor- and capital-intensive practices
+
+/ş
+
ş Livestock
+/ş
+ Use of manure
+/ş
+/ş
+
ş Nonfarm activities
+/ş
+ Purchased inputs, hired labor
+/ş
+/ş
+/ş
Irrigation
+ Horticultural crops
+
+ Practices complementary to irrigation
+
+/ş
+
and horticultural crops (e.g., fertilizer use)
(continued )
Table 2.2 (continued)
Value of
Labor
agricultural
Land
Impacts of
Livelihood strategy
intensity
Land management practices
production
degradation
Income
Programs and organizations
? Depends on focus
?
?
?
?
?
Credit
+ Capital- and input-intensive
+/ş
+ Purchased inputs and capital (if credit
+/ş
+/ş
+/0
strategies (high-value crops,
used for agriculture)
(depends on
intensive livestock, nonfarm)
+/ş Labor-intensive practices
whether used
ş Subsistence food crops
for agriculture)
Education
+ Salary employment
+/ş
+ New technologies
+/ş
+/ş
+
+ Nonfarm activities
+ Capital- and input-intensive practices
+/0 High-value crops and
+/ş Labor-intensive practices
intensive livestock
Larger household labor
+/0 Labor-intensive activities
+/0
ş/0 Land-intensive practices (fallow, slash
+/0
+/ş
0/+
endowment or smaller
(food crops, horticulture,
and burn)
(labor)
farm size
intensive livestock)
+/0 Labor-intensive practices
ş
ş/0 Land-intensive activities
+/ş Capital- and input-intensive practices
(smaller
(extensive livestock, forestry)
farm size)
+/0 Nonfarm activities
Livestock ownership
+ Livestock activities
+/ş
+ Capital-intensive practices
+/ş
+/ş
+/0
+ Complementary cropping
+/ş Labor-intensive practices
activities (e.g., cereals)
Farm equipment ownership
+ Capital-intensive agricultural
+/ş
+ Capital-intensive practices
+/ş
+/ş
+
activities
+/ş Labor-intensive practices
Land tenure security/more
+/ş Perennial crops
+/ş
+/ş Land investments
+/ş
+/ş
+/ş
complete land rights
+/0 Capital- and input-intensive
+/0 Capital- and input-intensive practices
(e.g., freehold versus
commodities
+/ş Labor-intensive practices
others, titled versus not,
owner versus not)
CONCEPTUAL FRAMEWORK AND HYPOTHESES
57
or other meso-level data, whereas others use household and plot survey data. As
mentioned previously, most of the studies are based on cross-sectional data, limit-
ing their ability to draw conclusions about dynamic processes of change, although
a few of the case studies address dynamic issues using historical recall information.
In the fourth part of the book, reviews of results of experimental studies and farm
level work in the three study countries are used to assess the influences of land
management on agricultural productivity and other outcomes, and two other
studies use bioeconomic models to enhance understanding of the driving forces
and dynamics of changes in land management and outcomes and the potentials for
improvement in land management and incomes as a result of policy and program
options. In the final chapter, we draw conclusions and policy implications from
this wide ranging set of empirical studies.
Notes
1. This definition is similar to the concept used by Reardon and Vosti (1995). Ellis (2000,
p. 40) defined livelihood strategies similarly as the "activities that generate the means of household
survival." According to Ellis, this definition includes natural resourceşbased activities, such as col-
lection of natural resource products (e.g., forestry or fishing), cultivation of food or nonfood com-
modities, livestock rearing, and nonfarm natural resourceşbased activities (e.g., mining); and nonş
natural resourceşbased activities and sources of income (e.g., rural trade, services, manufacturing,
remittances, and other transfers) (Ellis 2000). Other authors have provided somewhat broader defi-
nitions of livelihood strategies. For example, Adato and Meinzen-Dick (2002, p. 10) define people's
livelihood strategies as "the choices they employ in pursuit of income, security, well-being, and other
productive and reproductive goals." Although land management decisions could be seen as part of
households' livelihood strategies, we wish to investigate the relationships between the major deci-
sions that households make about how to earn their income (such as in agriculture vs. nonfarm
activities) and land management decisions. Thus, we use the narrower term income strategies to dis-
tinguish this concept from the concept of land management.
2. Comparative advantage refers to the profitability of the economic activities that a group of
people may pursue, relative to other activities that could be pursued by that group (Stiglitz 1993,
p. 61). Having a comparative advantage in a given activity does not imply that the group earns more
profit from the activity than could other groups (that would be absolute advantage); rather, it means
that the group profits more by pursuing that activity than other activities and by trading with others
who have comparative advantage in pursuing other activities. Comparative advantage can be defined
for groups of different sizes at different scales (e.g., nation, region, community, household, individual),
though it is most commonly discussed at a national scale in discussions of trade theory and policy.
3. As did von ThŘnen, we take the location of urban markets as predetermined. Recent theo-
retical developments in economic geography have sought to explain the location and growth of
cities based on consideration of plant-level economies of scale, transport costs, positive externalities,
or other sources of economies of agglomeration (e.g., Krugman 1998). Consideration of these the-
ories and their implications is beyond the scope of this book.
C h a p t e r 3
Development Pathways in Medium-
to High-Potential Kenya:
A Meso-Level Analysis of Agricultural
Patterns and Determinants
Frank Place, Patti Kristjanson, Steve Staal, Russ Kruska,
Tineke deWolff, Robert Zomer, and E. C. Njuguna
The highlands of East Africa have been endowed with a combination of mod-
erate temperatures, adequate rainfall (falling in two distinct seasons for much
of the highlands), and productive soils that make the region one of the best
suited for agricultural development in all of Africa. As a consequence, the area has
a long history of human habitation and supports some of the highest rural popula-
tion densities in Africa (Hoekstra and Corbett 1995; Pender, Place, and Ehui 1999).
The good news is that in some areas in the highlands, it is clear that land use
change has been part of a productive and sustainable pattern of agricultural devel-
opment. Two examples of successful agricultural intensification are found in the
central highlands of Kenya. The Mt. Kenya highlands have been the home for many
studies (see Chapter 8) that have found improvements in living conditions and
land quality. Similarly, the nearby Machakos District had a high prevalence of soil
erosion, pasture degradation, and deforestation with very low agricultural produc-
tivity and income in the 1930s and was considered to be overpopulated (Tiffen,
Mortimore, and Gichuki 1994). By 1990, however, the population had increased
fivefold. Surprisingly, not only was there less resource degradation, but the value of
agricultural output per head was estimated to be three times larger than 60 years
earlier. A recent Government of Kenya study also suggests that most of the districts
that comprise the central highlands of Kenya (Nyeri, Kiambu, Kirinyaga, and Meru)
60
FRANK PLACE ET AL.
have much lower levels of poverty than other rural areas of Kenya (Ministry of
Planning and Finance, Government of Kenya 2000). This is corroborated by a
recent study by Tegemeo Institute and Michigan State University showing agricul-
tural productivity, value of production, and incomes per hectare to be significantly
higher in central Kenya than elsewhere (Argwings-Kodhek et al. 1999).
The bad news is that the trend in the majority of the highlands appears to be a
downward spiral of increasing population pressure and land degradation, stagnant
or declining agricultural production, and entrenched poverty (Cleaver and Schreiber
1994). In many parts of the highlands people are now living in abject poverty.
Over 50 percent of the rural population in western Kenya lies below the poverty
line (Ministry of Planning and Finance, Government of Kenya 2000). In many
of these same areas, poverty has been accompanied by resource degradation.
Reductions in woody vegetation, declines in soil fertility, and increases in soil ero-
sion appear to be the norm in much of western Kenya, where recent studies in the
Nyando River Basin have found a high proportion of physically degraded land as a
result of poor land management practices (Shepherd and Walsh 2001).
The success stories are few and far between. Poverty and land degradation
characterize most of the highlands. Why is this so? Nonfarm employment oppor-
tunities are growing slowly in East Africa, continuing to place pressure on agricul-
ture to support roughly 80 percent of workers (World Bank 2002b). The road to
sustainable livelihoods for rural households is difficult. The agricultural options
available to communities are conditioned to some, perhaps a large, extent by phys-
ical and climatic conditions. But the policy environment plays a key role in the
structure and performance of supporting systems to agriculture (e.g., extension) as
well as in the promotion of markets for agricultural goods and services.
The key development challenge this chapter addresses is how the cases of suc-
cessful intensification can be replicated or adapted in the wider highlands to over-
come widespread poverty and land degradation in a manner that leads to sustain-
able improvement in livelihoods. What are successful land uses and management
strategies, and are they feasible only in certain physical and climatic environments,
or can they be catalyzed in diverse areas given proper market development?
In particular, we examine the following hypotheses:
Ě The prominence of high-value agricultural enterprises is not only predicated by
climatic conditions; market development plays a significant role.
Ě Market development has a greater influence on higher-value agricultural enter-
prises in more favorable zones.
DEVELOPMENT PATHWAYS IN KENYA
61
Ě Higher-value agricultural enterprises (cash crops, dairy, and tree growing) are
associated with greater wealth.
Ě Higher-value agricultural enterprises (cash crops, dairy, and tree growing) are
supportive of improved natural resource management.
The remainder of the chapter is as follows. Section 2 describes the methodol-
ogy involved in the collection and analysis of the data. Section 3 identifies different
development domains for rural Kenya based on population pressure, agricultural
potential, and market access. Section 4 describes different types of land use strate-
gies pursued by rural communities in Kenya. An analysis of the major underlying
factors associated with observed land uses is found in Section 5. Section 6 evaluates
the effects of different agricultural enterprises on wealth and natural resource
management. Finally, Section 7 summarizes the key findings and discusses ways
forward for policy.
Methodology and Data Sources
In this section, we first present the empirical models tested, followed by a descrip-
tion of the specific variables available. The final subsection then provides more
detail on the types of statistical tests undertaken to test the hypotheses.
Developing Econometric Models
The first step is to better understand the types of agricultural strategies adopted by
farming communities in the arable areas of Kenya. Our unit of analysis is the com-
munity or landscape scale, and thus we are interested in the choice of the scale of
cereal production or its proportion of area versus cash crops versus woodland, for
example. Decisions for land use are taken at the household level for the most part.
Household decisions are determined strongly by the profitability or, more gener-
ally, provision of utility of different land uses (e.g., Chomitz and Gray 1996; Place
and Otsuka 2000; Nelson and Geoghegan 2002). Farm-level profitability depends
on the prices of inputs and outputs faced by the farmer and, in the case of imper-
fect markets, her endowment of resources, including management skills. If these
concepts are projected to a larger scale, agricultural profitability depends critically
on production possibilities that are in turn dependent on agro-ecological condi-
tions. Data on prices of inputs and outputs would be ideal to include in a model.
In their absence, factors hypothesized to determine prices may be market access
and factor ratios (e.g., captured by population density).
62
FRANK PLACE ET AL.
One may therefore posit a model of land use at the community level as follows:
Land use = f (conditioning factors, driving forces)
(1)
where conditioning factors are the exogenous physical and climatic factors such
as soil type, rainfall, altitude, and temperature, and driving forces are the more
dynamic drivers of landscapes such as population density and market access.
If the conditioning factors explain an overwhelming proportion of the varia-
tion, this implies traditional development and transfer of agricultural technologies
appropriate to specific agro-ecological zones may well be a sufficient strategy for
agricultural development. The interpretation of the coefficients for the driving
forces may be made difficult if the driving forces are related to the conditioning
factors. For instance, Chomitz and Gray (1996) discuss the likelihood of endo-
geneity of road development in the case of Belize. Thus, in order to understand the
importance of individual variables, it would be appropriate to account for such
relationships among the explanatory variables. As will be explained below, the
availability of variables at a meso level (i.e., the middle levels roughly from village
to district) is poor. This turns out to be the key constraint to ideal causal analysis
because many of the key variables related to land use, such as climate, land tenure,
population pressure, and market access, vary significantly at this meso scale.
If effects between conditioning factors and driving forces can be isolated,
results from equation (1) will enable the confirmation of the importance of popu-
lation density (through effects on factor ratios) and market access on agricultural
strategies. Of particular importance will be the market variables because these are
more clearly related to policy decisions. Another challenge for modeling land use is
that there are several possible land use outcomes. This suggests that a system-of-
equations approach is appropriate. The practical difficulty of implementing this is
the lack of variables to identify the different land use equations. Indeed, as will be
shown below, the major limitation of analyses covering wide geographic areas is
lack of available variables.
Analysis of the land use model would provide some insights into what types of
land uses are observable or attainable under various conditions and, to some extent,
how such systems can be promoted. However, it does not provide evidence of why
certain land uses should be promoted over others. For this, it would be important
to evaluate the land use systems in regard to their impacts on productivity, poverty,
or resource management variables, which are of importance to individuals and
society. For instance, are cereal-dominated systems more productive than others?
Are they linked to lower poverty rates, or do they lead to better-managed soils? Such
an analysis is shown in equations (2a) and (2b), which use poverty as an example:
DEVELOPMENT PATHWAYS IN KENYA
63
Poverty = f (conditioning factors, driving forces)
(2a)
Poverty = f (conditioning factors, driving forces, land use)
(2b)
The effects of land use on poverty (or other indicators of utility) may not be straight-
forward because the nonfarm sector may play a vital role in providing incomes to
families. Of particular interest will be to identify the specific types of land use sys-
tems that are found to generate high levels of wealth. This question may be difficult
to disentangle because the direction of causality between land use and poverty levels
is ambiguous from a theoretical point of view. In other words, it is conceivable that
more wealth leads to different choices as to which crops to sow or livestock to buy,
but which crops or livestock products you produce may also influence how well off
you are.
We present findings regarding the relationship among different land uses,
wealth, and the percentage of tree cover. However, reliable meso-level data for
other indicators of degradation, production, or productivity do not exist beyond
small geographic areas. The regression results from equation (1) may be interpreted
as identifying relationships from the explanatory variables to the land use variable
because the explanatory variables are exogenous, and some of them are not modifi-
able at all. However, we are unable to disentangle the direction of causality between
land use (and implied enterprise choice) on the one hand and poverty and environ-
mental indicators on the other hand. In that case, we merely attempt to describe
associated patterns that merit further attention.
The Data Set
The data used in the analysis reflect different spatial units and are drawn from dif-
ferent sources. Many of the variables, including the land use variables, are gener-
ated from aerial photos of 45-hectare-sized areas. Because all the land use data are
generated from the aerial photos, this 45-hectare area is the basis for almost all the
statistical analysis and is what we refer to as the "site." Others may relate to square
kilometer resolution or data collected at divisional level (administrative unit
below a district). These are described in more detail. In all cases, variables are geo-
referenced, allowing them to be scaled up or down to link with other data. The
aerial photos are geo-referenced in a crude way. The center point for the photo is
identified before the flight, but the actual photo may deviate slightly from this as a
result of human error in flying and taking the photo.
Available data on physical and climatic conditioning factors include altitude,
slope, rainfall, length of growing season, temperature, and the precipitation to poten-
tial evapotranspiration ratio (Corbett et al. 1999). These variables are available for
64
FRANK PLACE ET AL.
all of Kenya and have been catalogued by ILRI (2003). These variables constitute the
most relevant variables for agriculture, with the possible exception of soil type. How-
ever, there is no reliable, recent, and high-resolution information on soil types for
Kenya.
There are potentially many important driving forces behind land use deci-
sions. At the national level, these include peace and security, economic stability,
exchange rates, financial liquidity, urban growth, and facilitation of agroprocessing.
Such factors would be critical in a dynamic model of land use change or intensifi-
cation. However, because our land use data are from a single year, these national
variables become constant across all our sites. Thus, we focus on driving forces that
differ across sites within Kenya. Among these are population density and growth,
market access and growth, rural nonfarm growth, presence of development projects,
ethnicity, and effectiveness of extension programs. However, our data set includes
population density and various measures of market access only. There is insuffi-
cient data coverage for information on the other driving forces. Population density
information pertains to 1989 (the last census that has been made available to the
public) and is available at the sublocation level (lowest administrative unit) for all
of Kenya. Market access surfaces have been generated by ILRI and ICRAF and
include distances to different types of roads and urban markets as well as estimates
of travel times to different urban areas. These variables are available for the medium-
to high-potential areas of Kenya.
Land use variables were generated from interpretation of low-altitude aerial pho-
tographs (1,500 meters above ground level) that were taken toward the end of the
long rainy season of 1997 (MayşJune). Each photo represented 45 hectares, and
photos followed a grid pattern at 2.5-kilometer intervals along transects that were
separated by 5 kilometers. So although there is a good density of coverage, it is not
complete, and we cannot produce land use surfaces. Thus, the ability to generate ex
situ spatial variables, such as land use in adjacent areas, is inhibited. The original
flight coverage included all areas where maize might be grown, so this excluded the
north of Kenya as well as the more arid areas of southern and eastern Kenya. The
available photos number over 8,200, but because of financial constraints, 5,546
photos from 30 districts were interpreted. The excluded photos are largely from
the drier, lower-elevation areas. Interpretation of land use variables was done by
projecting the photos onto a 100-dot grid paper on a wall and counting the num-
ber of times a certain land use intersects with a dot.1 Tree canopy cover was calcu-
lated by visual inspection over the entire photo. Finally, data on cattle density are
from 1993ş97 division-level reports of the Ministry of Agriculture and Livestock
Development.
DEVELOPMENT PATHWAYS IN KENYA
65
The low-altitude aerial photography allowed very detailed interpretation of
land use, including specific type of crop, for example, maize, sorghum, or potato. A
total of 97 land use or cover variables could potentially be distinguished, and these
include not only different crops but nonagricultural land covers such as water bodies,
roads, and man-made structures. Because the photos covered entire 45-hectare
tracts, there is considerable noncultivated area in the resulting land use data. To
make our analysis tractable, we aggregated land use into a handful of discrete cases:
maize, other staples, legumes, cash and horticulture,2 grazing and pasture land
(including planted forages), wooded land, other land, water, and man-made struc-
tures. In our analyses, we focus mainly on explaining differences in maize, cash/
horticultural production, and woodlots, as other land types were neither common
nor sizable. These calculations are made for each of the 5,546 images. We also
attempt to explain the current intensity of cattle and dairy cattle raising. These data
are available from the International Livestock Research Institute (ILRI) at the divi-
sional level (a district may be composed of 5ş10 divisions).
High-resolution data on poverty, productivity, and natural resource manage-
ment are not yet available for wide areas of Kenya. Thus, we again turned to the aer-
ial photographs to generate such information. For poverty, we used the proportion of
roofs that were high value (tile or tin) as opposed to thatch. Although there are cer-
tain cultural preferences as to roof type, this variable is widely considered to be asso-
ciated with more robust poverty measures. As for natural resource management, the
percentage of land under tree canopy cover is the only useful variable at our disposal
for each of the 5,546 sites. We attempted to measure soil degradation by visual iden-
tification of gullies. However, this proved to be feasible only in the drier areas because
sheet and gully erosion could be hidden under vegetation in the more humid areas.
Delineation of Kenya into Development Domains
In this section, we focus on the highlands of Kenya, defined as areas exceeding
1,200 meters above sea level. Most, but not all, medium- to high-potential land is
found in the highland areas. Figure 3.1 (see color insert) shows that the highlands
cover much of the southwest quarter of Kenya. The easternmost area is known as
the central highlands, and the westernmost area is the western highlands. The west-
ern highlands extend almost all the way to Lake Victoria, which is at 1,100 meters
above sea level. In between the two is the rift valley, which, although it lies below
the enveloping higher hills, still falls into our definition of the highlands. In addi-
tion to this large contiguous area, there are fragmented highland areas extending to
the southeast and to the northwest.
66
FRANK PLACE ET AL.
In order to define distinctive and meaningful development domains, the high-
lands were partitioned into zones according to agricultural potential, population
density, and market access (defined in detail below). These three variables are
selected because they are expected to have a significant influence on agricultural
strategies or pathways (this has been shown in other studies, including Pender,
Place, and Ehui 1999; Kristjanson et al. 2002). Agricultural potential has an obvi-
ous link to agricultural strategies in that it essentially defines what options are fea-
sible from a technical point of view.3 Market access influences the extent to which
agricultural commodities can be marketed and inputs and services obtained and is
expected to influence the degree of adoption of commercial enterprises. Because
population density is a general proxy for average landholding size, it is expected that
high population density will lead to the adoption of more labor-intensive strategies
and, according to Boserup (1965) and Ruthenberg (1985), will lead to more inten-
sified agriculture. Population density can also be seen as reflecting market demand
for local goods and services.
The actual variables used in the delineation of Kenya's highland areas were:
1. Agricultural potential: total precipitation/potential evapotranspiration ratio
(or P/PE, where the numerator and denominator are both measured in
millimeters).4
2. Market access: travel time (by vehicle in minutes) to the nearest urban area
of at least 2,500 people, using assumed mean travel speeds for the main
road types.
3. Population density: population density from the 1989 census.
Identifying cutoffs for each of these variables is a bit subjective. We undertake two
separate exercises, one that attempted to give a more realistic yet complex picture
of the variation across highland sites and another to provide a more simplistic
but manageable view. The first retained four categories of population density, four
levels of market access, and four agricultural potential zones and in the end found
61 different development domains in the highlands, 28 of which represented at least
1,000 square kilometers. These are not discussed in detail but serve as a reminder
that the highland landscape is complex and varying. The multivariate analyses that
follow later in this chapter will take this into full account, though for descriptive
purposes we now simplify the picture.
The simplified delineation of development domains assumes only two cate-
gories for each of the three variables (high and low), which in combination can yield
DEVELOPMENT PATHWAYS IN KENYA
67
a maximum of eight distinct outcomes. The cutoffs used were 0.75 for P/PE, 30
minutes in travel time to a small center of at least 2,500 persons, and 200 persons
per square kilometer. All eight possible outcomes do in fact emerge, and these are
depicted in Figure 3.2 (see color insert). The different green shades are areas with
relatively good market access, while those with red shades have relatively poor mar-
ket access. Figure 3.2 clearly shows that the highlands near Nairobi, as well as those
in the densely populated western highlands, have good access to urban markets.
Market access is worse on the northernmost and southernmost reaches of the
highlands. Among the low-market-access areas, almost all have low population den-
sity and low agricultural potential. There is much more variation in population
density and agricultural potential within the high-market-access zones.
This is borne out by the data in Table 3.1. Of the low-market-access areas,
81.5 percent are also characterized by low agricultural potential and low population
density. On the other hand, the high-market-access areas have large areas with
low agricultural potential combined with low population density, high agricultural
potential combined with low population density, and high agricultural potential
combined with high population density. Contrasting across population density
class, the high-population zones are dominated by high agricultural potential and
Table 3.1 Description and importance of development domains in the Kenya highlands
Importance of development domains
Development domains
TotalTotal
Agricultural
Market
Population
area
population
Population
potentialaccess
density
[km2 (%)]
(%)
density
Low
Low
Low
44,599
734,897
16
(32.9)
(4.6)
Low
Low
High
309
102,279
331
(0.2)
(0.6)
Low
High
Low
31,550
1,736,525
55
(23.3)
(10.8)
Low
High
High
5,691
3,453,481
607
(4.2)
(21.6)
High
Low
Low
9,481
372,802
39
(7.0)
(2.3)
High
Low
High
359
126,070
351
(0.3)
(0.8)
High
High
Low
25,728
2,312,963
90
(19.0)
(14.4)
High
High
High
17,848
7,177,320
402
(13.2)
(44.8)
Total
135,565
16,016,337
118
68
FRANK PLACE ET AL.
high market-access characteristics (73.7 percent), followed by low agricultural poten-
tial but high market-access features (23.5 percent). Conversely, the low-population-
density zones are distributed across different levels of agricultural potential and
market access. Finally, if one begins with agricultural potential, it is obvious that
there are no dominant patterns between areas of high and low potential.
In terms of population size, four development domains stand out:
1. high agricultural potential, high market access, high population density
(7.2 million people)
2. low agricultural potential, high market access, high population density
(3.5 million people)
3. high agricultural potential, high market access, low population density
(2.3 million people)
4. low agricultural potential, high market access, low population density
(1.7 million people)
These correspond reasonably well to the most important domains in terms of area
covered, with the exception that the largest development domain in terms of area is
the low-agricultural-potential, low-market-access, low-population-density domain
(44,599 square kilometers), which ranks only fifth in terms of number of people
covered. The domain categories are useful for descriptive purposes. However, for
econometric analyses, we decompose the domain categories into the respective
component variables. This is done to distinguish the effects of specific variables and
to reduce the confounding influences of exogenous (e.g., rainfall) and endogenous
(e.g., population density) variables.
Description of Land Use in Kenya
From this section onward, we make a slight departure from the exclusive focus
on the highlands. Data on land use are available for the highlands and other
areas, primarily the slightly lower-lying areas adjacent to the highland areas. We have
included these additional sites (down to 1,000 meters above sea level) for several
reasons: (1) many of the same agricultural enterprises are found in these outlying
areas, (2) they enable the analysis to be enriched by more variation in conditioning
factors and driving forces, and (3) there is no accepted definition of highlands.
DEVELOPMENT PATHWAYS IN KENYA
69
Table 3.2 Percentage area under different land uses
Land use
Cases where observed (%)
Mean area (%)
Median area (%)
Grazing/fallow/pasture
94.4
45.2
43.0
Maize and intercrops
75.7
18.3
13.0
Bare/bush land
80.8
13.4
7.0
Traditional cash cropsa
34.6
8.3
0.0
Wooded land
47.1
7.5
0.0
Man-made structures
67.6
2.5
2.0
Other staple foods
29.1
1.8
0.0
Water bodies
16.9
1.4
0.0
Horticultureb
6.0
0.3
0.0
Legumes
4.2
0.2
0.0
Note: n = 5,547 45-hectare units.
aCoffee, tea, cotton, sugar cane.
b Fruits and vegetables.
As noted in the methodology section, a large number of distinct land uses
were identified in the aerial photo interpretation. In order to make the analysis
tractable, we have combined the numerous observed land uses into 10 categories.
Table 3.2 lists the 10 categories according to mean area, also indicating the median
area and the percentage of nonzero observations (among the 5,546 photos). The
mean area is based on a total area of 100 (recall the 100 gridpoints used to collect
the information), so it can also be treated as the percentage of total area.
As can be seen, noncultivated land occupies the majority of land area. The
largest single category is grazing, pasture, and fallow land, which is found in nearly
all the 5,546 sites and has a mean percentage area of 45.2 percent. Bare or bush
land occupies 13.4 percent of land, wooded land (woodlots, plantations, forests,
woodlands) another 7.5 percent, and other noncultivated area 3.9 percent. Some
of this land may well be part of a cultivation rotational practice, but at the time of
the photos it was not under cultivation.
As for crops, maize and maize intercrops dominate in the areas covered. Eigh-
teen percent of the landscape was devoted to maize, and the crop was found in
nearly 76 percent of sampled sites (recall that the sites are restricted to medium- to
high-potential areas). About one-fifth of sites show between 1 percent and 10 per-
cent of land area in maize, and about 13 percent have over 40 percent of area in
maize. When cultivated land is used as the denominator (and thus omitting cases
where there is no cultivated land), the proportion of area under maize soars. Only
7.3 percent of sites with cultivation recorded no maize, and as many as 38.5 per-
cent of these sites are characterized by complete dominance of cultivation by maize.
Maize comprises 75 percent or more of cultivated area in 60 percent of the sites.
70
FRANK PLACE ET AL.
Traditional cash crops of coffee, tea, sugar cane, and cotton occupy around
8 percent of total land area. However, these crops are found in only about 36 per-
cent of 5,546 cases. Figure 3.3 (see color insert) shows the geographic distribution
of cash crops and provides a view of the area covered by the aerial photographs. As
can be seen, there is a high concentration in central Kenya north of Nairobi (coffee
and tea), in the western rift valley (tea), and in pockets of western Kenya (mainly
sugar cane). Other crops are of only minor importance at the landscape scale.5
Data for cattle and dairy density (at divisional level) indicate that the mean
number of cattle per square kilometer is 101 with a median of 72. Almost every site
for which data are available reports the existence of cattle. Presence of dairy cattle
is also nearly ubiquitous, though the numbers and density are significantly lower
than for all breeds taken together. The average dairy cow density is 39 per square
kilometer with the median being 20. There are pockets of high dairy cattle density:
17 percent of sites report dairy cow density of over 75 per square kilometer.
Planted woodlots (by farmers) were identified in 37.5 percent of sites. Most of
these (32.7 percent of all sites) exhibited modest woodlot coverage, at 10 percent
of land cover or less. Thus, only 4.8 percent of sites showed relatively high concen-
trations of woodlots (i.e., over 10 percent), and the mean across all sites was 2.1 per-
cent of land cover (only a portion, therefore, of total wooded area). The overall tree
canopy cover is expressed as the proportion of all area under tree canopy cover (Fig-
ure 3.4; see color insert). It is estimated from visual inspection of the aerial photo
and thus independent of the land use assessments based on a grid sampling. For
example, it considers tree density on wooded land as well as trees found on other
land uses such as cultivated land. The mean tree canopy cover across all sites was
15.8 percent, and as many as 21.2 percent are estimated to have at least one-fifth of
area under tree cover. At the other extreme, about 17 percent of sites have virtually
no tree cover.
Factors behind Agricultural Enterprise Choice
Farming households in these areas typically have many choices confronting them
as to how to best allocate their land. In a nutshell, they can plant maize or other
cereal crops, beans or other legumes, a range of horticultural or cash crops, Napier
grass or other animal feed crops, plant trees for fruit or fodder or soil fertility (or a
combination), or dedicate some land to pastures. In this section, we analyze the
factors associated with choice of agricultural enterprise. The particular enterprises
examined are maize (including intercrops) area, cash and horticultural area, cattle
and dairy cattle density, and woodlot area. Other specific agricultural enterprises
are not examined mainly because of lack of prominence.
DEVELOPMENT PATHWAYS IN KENYA
71
Because of a restricted number of available explanatory variables, we do not
develop causal models but rather models of association or prediction (though there
is little reason to believe that causality runs from land use to the explanatory vari-
ables). Essentially, although it is clear that population density and travel time to
markets are related to climatic conditions (and each other), it was not possible to
distinguish these "subrelationships." To compensate, a number of models were run,
with and without individual variables, in order to better understand the relation-
ships among explanatory variables and the resulting direct and indirect effects
that they may have on agricultural enterprise choice. In some cases where there
was high correlation among variables, one or more were removed to avoid multi-
collinearity problems. Because of the limited number of variables, we are also
obliged to run single-equation models. This type of situation lends itself to a seem-
ingly unrelated regression model, but that procedure offers no improvement to
single-equation models when the explanatory variables are the same across equations.
Further, systems equation models are more complicated when limited dependent
variables are concerned.
Tables 3.3ş3.6 show regression results for maize, cash crops, cattle, and wood-
lots, respectively. The models presented are those that include both conditioning
factors and driving forces. Results from other specifications will be discussed, but
are not presented in tables because of space limitations. We ran models with and
without district dummy variables. Because most of the results are the same in terms
of sign and significance level, we present only those from the model in which they
Table 3.3 Tobit regression of maize area and percentage of cultivated area under maize
Cultivated area
Maize area
under maize (%)
Coefficient
Significance
Coefficient
Significance
Variable
estimate
level
estimate
level
Constant
ş37.47938
0.010
0.41234
0.400
Altitude (meters)
0.014152
0.404
0.0001
0.786
Altitude squared
ş0.000006
0.158
ş0.00000004
0.696
Precipitation (millimeters)/evapotranspiration
106.0421
0.009
0.34531
0.619
(millimeters) ratio (PPE)
PPE squared
ş67.2070
0.005
ş0.36486
0.368
Travel time to urban area (hours)
0.03581
0.054
0.000715
0.082
Travel time squared
ş0.000057
0.007
ş0.000001
0.007
Population density (persons/km2)
0.066772
0.000
0.000025
0.894
Population density squared
ş0.000042
0.000
ş0.00000002
0.845
Number of observations
5,515
4,501
Note: District dummy variables included but not reported in the table.
72
FRANK PLACE ET AL.
Table 3.4 Tobit regressions of cash crop area and percentage of cultivated area under cash crops
Cultivated area
Cash crop area
under cash crops (%)
Coefficient
Significance
Coefficient
Significance
Variable
estimate
level
estimate
level
Constant
ş94.9848
0.002
ş1.60977
0.000
Altitude (meters)
0.03528
0.253
0.001169
0.055
Altitude squared
ş0.00001
0.199
ş0.0000003
0.077
Precipitation (millimeters)/evapotranspiration
163.6994
0.004
1.28654
0.235
(millimeters) ratio (PPE)
PPE squared
ş77.1062
0.017
ş0.42426
0.475
Travel time to urban area (hours)
ş0.07860
0.016
ş0.001422
0.015
Travel time squared
0.000056
0.091
0.0000016
0.014
Population density (persons per km2)
0.054827
0.006
0.000246
0.423
Population density squared
ş0.000034
0.008
ş0.00000015
0.441
Number of observations
5,515
4,501
Note: District dummy variables included but not reported in the table.
are included. For the sake of space, the coefficient estimates on the district dummies
(31 of them) are not included in the tables. In all regressions, many of the district
variables turn out to be very important and significantly raise the explanatory
power of the models. We also tried to account for the nonindependence of obser-
vations (i.e., spatial autocorrelation) through a clustering technique offered in
Table 3.5 OLS regressions of density of cattle and dairy cattle
Cattle
Dairy cattle
Coefficient
Significance
Coefficient
Significance
Variable
estimate
level
estimate
level
Constant
97.5708
0.044
ş79.23615
0.196
Altitude (meters)
ş0.01653
0.743
0.09026
0.006
Altitude squared
ş0.0000027
0.838
ş0.00002
0.018
Precipitation (millimeters)/evapotranspiration
112.2307
0.337
157.8382
0.096
(millimeters) ratio (PPE)
PPE squared
ş47.0445
0.513
ş94.8817
0.083
Travel time to urban area (hours)
0.005150
0.960
ş0.035043
0.338
Travel time squared
ş0.000032
0.738
0.000026
0.475
Population density (persons per km2)
0.09932
0.006
0.03498
0.102
Population density squared
ş0.000025
0.298
ş0.000015
0.224
R 2
0.403
0.549
Number of observations
4,766
4,766
Note: District dummy variables included but not reported in the table.
DEVELOPMENT PATHWAYS IN KENYA
73
Table 3.6 Tobit regressions of area under woodlots
Model 1
Model 2
Coefficient
Significance
Coefficient
Significance
Variable
estimate
level
estimate
level
Constant
ş37.02432
0.000
ş36.28394
0.000
Altitude (meters)
0.015225
0.010
0.012687
0.029
Altitude squared
ş0.0000036
0.020
ş0.000002
0.123
Precipitation (millimeters)/evapotranspiration
35.34481
0.008
34.2274
0.009
(millimeters) ratio (PPE)
PPE squared
ş16.68914
0.014
ş15.4829
0.020
Travel time to urban area (hours)
ş0.010756
0.083
ş0.00621
0.287
Travel time squared
0.000006
0.346
0.000002
0.742
Population density (persons per km2)
0.019333
0.000
0.01654
0.000
Population density squared
ş0.000011
0.000
ş0.000009
0.000
Slope (average change in meters)
0.036862
0.351
0.067665
0.091
Area under off-farm woody vegetation
ş0.17840
0.000
(percentage of 45-hectare site)
Number of observations
5,515
5,515
Note: District dummy variables included but not reported in the table.
STATA. This enabled us to treat observations from the same district as non-
independent and thereby generate more conservative (i.e., higher) estimates of
standard errors for the coefficient estimates.6
The dependent variables have been discussed previously, so here we briefly
describe the main explanatory variables included in the models. Altitude and the
precipitation-toşpotential evapotranspiration ratio (P/PE) are used as the condi-
tioning factors. Other variables such as rainfall and length of growing period are
essentially captured by P/PE. The squares of each are also used because of the
expected reduction in suitability of many crops at very high altitudes or very humid
conditions. The mean altitude across all observations is 1,615 meters above sea
level. About 22 percent of cases are below 1,200 meters and almost 38 percent are
above 1,800 meters. The mean P/PE value is 0.75, which is relatively favorable for
a range of crop growth. Population density and travel time to the nearest urban
center of at least 2,500 people (and their squared terms) are the two driving forces
included. The mean human population density (in 1989) is 233 per square kilo-
meter. Fewer than 18 percent of the sites had relatively low population densities of
below 50, and 27 percent of sites had densities of over 250. The mean travel time
to the nearest town of 2,500 persons is 1.85 hours. Just about 14 percent of the
sites had to travel for 3 hours or more to reach a substantial market, whereas 12 per-
cent could reach one in approximately one-half hour. A measure of slope is also used
74
FRANK PLACE ET AL.
in the woodlot estimation, which measures the difference in elevation at the site
compared to adjacent areas.
Tables 3.3 and 3.4 show the results of regressions on maize and cash crop area
as well as the percentage of cropped area under each. We ran models with the
absolute land area and the percentage area to better understand the influence of
population pressure. For instance, it is expected that population pressure will lead
to greater cultivated area, possibly of all types of crops. But the absolute area equa-
tions are able to assess the population densities at which this expansion diminishes
and possibly stops. On the other hand, the percentage share regressions focus more
on the relative importance of cash crops and maize as population density increases.
Both types of information are important. Because there are zero values, a high
number in the case of cash crop area, censored (Tobit) regressions are used.
In terms of total area, the results show that the maize and cash crop area
increases with improved climate and greater population density, but at diminishing
rates for both. So favorable climate and population pressure induce conversion of
nonagricultural land to maize and other agricultural enterprises. Market access
has different influences on maize and cash crops with improved access associated
with higher cash crop area and percentage area under cash crops.7 The opposite effect
occurs for maize.
Some interesting results arise from the models in which maize and cash crop
area as a percentage of all cultivated area are the dependent variables. The effect of
P/PE becomes insignificant, and for cash crops, altitude becomes important. Thus,
it is particularly at the relatively high altitudes where cash crops displace maize
systems. But the average rainfall has little effect on the ratio of cash to maize crop
production. Interestingly, although population pressure leads to expansion of
cropped area, it does not directly influence the balance between maize and cash
crop cultivation. Such a result has been found in a number of household studies
that indicate dual pressures for food production and income generation are equally
felt by households constrained by small farm size (e.g., Owuor 1999).
Separate regressions included interaction terms for P/PE and travel time to
market variables in order to test whether market access has a greater impact on cash
crop area in areas with favorable climates. Indeed, this was confirmed: the nega-
tive and significant coefficient estimate indicates that the effect of market access is
greater where climate is more favorable.
Table 3.5 shows the factors influencing overall cattle density as well as the den-
sity of dairy cattle in particular. Cattle density is not highly linked to the included
variables. This is because of the different types of cattle breeds and production sys-
tems in Kenya. Some less favorable zones for cropping are attractive habitats for
local zebu. Similarly to cash crops, climate and altitude play a role in predicting dairy
DEVELOPMENT PATHWAYS IN KENYA
75
cattle density. Surprisingly, market access and population density did not have added
effects on dairy cattle numbers. This contrasts to a previous wide-scale household-
level study of dairy production in Kenya (Staal et al. 2002).8
Table 3.6 shows results from regressions aimed at explaining factors influenc-
ing a household's decision on how much land to devote to woodlots. Model 2 dif-
fers from Model 1 by the inclusion of off-farm wooded area; the hypothesis is that
such areas may reduce incentives for farmers to plant their own woodlots. Wood-
lots are promoted by favorable climate, population density, and to a lesser extent by
market access. This is not surprising because, in Kenya, woodlots provide impor-
tant sources of income, particularly fast-growing eucalyptus poles. Further, there
was only weak support for the hypothesis that farmers plant trees on more sloped
land because of the comparative advantage of trees over crops on such land. Finally,
it does appear that farmers have access to trees off-farm and that this access greatly
reduces incentives for investing in woodlots on their farms.
Impacts of Agricultural Enterprise Choice
A natural reaction to the analysis above may be to ask why any particular agricul-
tural enterprise might be preferred over another. In other words, is there any evi-
dence that certain agricultural enterprises are more productive, profitable, or take
better care of the natural resource base than others? The one proxy variable calcu-
lated from the aerial photos relevant to profits or poverty was the percentage of
roofs made of high-quality material (i.e., tin or tiles). This variable is often used as
one component of a wealth index of households. Table 3.7 shows the results of
censored regressions to explain this ratio. Model 1 contains the same explanatory
variables as used in the agricultural enterprise regressions. Model 2 adds three
enterprise variables: the percentage of area under cash crops, the density of dairy
cattle, and the area under woodlots. These are endogenous variables, but the inten-
tion here is to identify whether these choice variables appear to have an impact on
poverty and the environment and therefore draw attention for further investigation.9
This wealth indicator is related in much the same way to the conditioning
factors and driving forces as were the higher-value agricultural enterprises. Agricul-
tural potential, market access, and population density all have a significant influ-
ence on household wealth (and the expected signs). Only altitude and travel time
remain significant after the three enterprise variables are added in. Cash crops,
dairy cattle, and woodlots are each positively related to high-quality roofs, though
cash crops are only weakly significant. Although it is not possible to state unequiv-
ocally that these land uses promote wealth accumulation, this finding strongly sug-
gests that such enterprises are important ingredients in wealth-generating processes.
76
FRANK PLACE ET AL.
Table 3.7 Tobit regressions of ratio of high-quality roofs to total roofs
Model 1
Model 2
Coefficient
Significance
Coefficient
Significance
Variable
estimate
level
estimate
level
Constant
ş0.69617
0.000
ş0.48198
0.001
Altitude (meters)
0.000897
0.000
0.000821
0.000
Altitude squared
ş0.0000002
0.004
ş0.0000002
0.004
Precipitation (millimeters)/evapotranspiration
0.65680
0.046
0.29138
0.341
(millimeters) ratio (PPE)
PPE squared
ş0.36297
0.052
ş0.19265
0.254
Travel time to urban area (hours)
ş0.000783
0.002
ş0.00077
0.006
Travel time squared
0.0000007
0.088
0.0000005
0.308
Population density (persons per km2)
0.000216
0.018
0.0001198
0.158
Population density squared
ş0.0000001
0.137
ş0.00000007
0.262
Density of dairy cattle (number per km2)
0.000347
0.037
Percentage cropped area under cash crops
0.001168
0.141
Area under woodlots (percentage of
0.00850
0.001
45-hectare site)
Number of observations
4,181
3,640
Note: District dummy variables included but not reported in the table.
A study by Rommelse (2001a) in western Kenya supports the importance of these
enterprises. Of the top ten most common income-generating agricultural enterprises,
four were livestock related (e.g., eggs and chickens), three were tree related (e.g.,
fruits and poles), and the top category was a horticultural enterprise (vegetables).
In addition, Nicholson et al. (1999) report significantly higher incomes among
dairy producer households in coastal Kenya, compared to nondairy households.
Many of these results are supported or strengthened by recent nationwide
research by Tegemeo Institute (Egerton University) and Michigan State University.
First, Nyoro (1999) presents data from the Ministry of Agriculture and Rural
Development that shows recent (1990ş95) expansion of cropped area to be fastest
for horticultural crops, followed by traditional cash crops and finally by maize.
Second, Owuor (1999) found that commercialization (share of total production
that is marketed) is strongly related to value of crop per hectare. This explains a
high proportion of the differences in per-hectare value of production both inter-
regionally as well as between households within regions. Last, work by Argwings-
Kodhek et al. (1999) demonstrate the large differences in income across different
farming zones in Kenya. In areas with high concentrations of traditional cash crops
or horticultural crops, such as the central highlands, households annually earn about
$1,780 per farm from crops and livestock. In the western highlands, where farms
DEVELOPMENT PATHWAYS IN KENYA
77
are more or less the same size (i.e., very small, less than 1.5 hectares), the average
farm earnings were only $613.
A final analysis looked at the impact of land use on the percentage of tree cover
across the entire landscape of each site (i.e., the entire 45-hectare photograph). As
shown in Table 3.8, tree cover is highest in the lower altitudes and then decreases,
but at slower rates, as altitude increases. Tree cover is also much greater in areas
with more sloping land, perhaps because of the difficulty in cultivating these
lands. Climate, controlled for altitude, was not related to overall tree cover. Market
access and population pressure were negatively related to tree cover, as would be
expected. Model 2 tests for the relationship between high-value agricultural enter-
prises and tree cover. It can be seen that all three variables (dairy cattle density,
woodlot area, and percentage of cultivated land under cash crops) are positively
associated with tree cover, and in the case of woodlots, the coefficient is significant.
This means that these agricultural enterprises, which positively impact on wealth,
have a neutral or positive impact on vegetation cover as well. Whether this is pri-
marily because of effects within agricultural land or due to pressures on resources
outside of agricultural land is not clear, however.
Table 3.8 Tobit regressions of percentage tree cover
Model 1
Model 2
Coefficient
Significance
Coefficient
Significance
Variable
estimate
level
estimate
level
Constant
26.695
0.039
41.0265
0.000
Altitude (meters)
ş0.06675
0.001
ş0.05232
0.003
Altitude squared
0.000023
0.000
0.000015
0.003
Precipitation (millimeters)/evapotranspiration
8.15459
0.713
ş1.94683
0.919
(millimeters) ratio (PPE)
PPE squared
8.78486
0.465
8.45311
0.419
Travel time to urban area (hours)
0.067249
0.001
0.025639
0.008
Travel time squared
0.000066
0.000
0.000008
0.328
Population density (persons per km2)
ş0.02023
0.053
0.011158
0.061
Population density squared
0.000014
0.056
0.0000069
0.131
Slope (average change in meters)
0.92345
0.000
0.56921
0.000
Density of dairy cattle (number per km2)
0.016944
0.3194
Area under woodlots (percentage of
0.45054
0.000
45-hectare site)
Percentage of cultivated area under
10.61746
0.369
cash crops
Number of observations
5,515
5,515
Note: District dummy variables included but not reported in the table.
78
FRANK PLACE ET AL.
Conclusions
Major Empirical Findings
The major empirical findings can be summarized as follows:
Ě As expected, climate and altitude are important in explaining land use, but
other factors also play important roles.
Ě Population pressure positively influences the area under cultivation but does
not automatically lead to adoption of higher-value crops.
Ě Good market access is critical for promoting production of higher-value
agricultural enterprises, especially in the more favorable climate zones.
Ě Dairy and woodlots contribute to wealth generation (as measured by house
quality) and at the same time have neutral or positive effects on overall tree
cover.
Methodological Challenges
Our analysis focused on the visible side of rural livelihoods, namely agriculture.
However, it is well known (e.g., Argwings-Kodhek et al. 1999) that the nonfarm
economy plays a critical role in household strategies directly as well as indirectly
through agriculture. This large sector could not be addressed by this analysis. A sec-
ond limitation is the use of single-equation models that ultimately may show only
patterns of association rather than causal relationships. Further progress in this
area is constrained mainly by lack of breadth in variables that exist for such wide
coverages at sufficient levels of disaggregation. Nonetheless, many of the relation-
ships demonstrated in this analysis are supported by other studies. Qualitative
research, such as focus group discussions, have proven very valuable in disentangling
timelines of change in variables, which ultimately may enable the distinguishing of
causes from effects (e.g., Kanbur 2003; Krishna et al. 2004).
A third limitation concerns the existence of spatial autocorrelation in our
dataset without sufficient treatment in our statistical analysis. In case of spatial
autocorrelation, the information content of the sample is lowered, rendering it less
efficient than uncorrelated counterparts, so parameter estimates are inefficient,
although asymptotically unbiased (Anselin 2001). Moreover, the omission of a
spatially correlated and important variable may result in biased estimates. We have
partially dealt with this issue through clustered regression techniques. Further work
to address spatial autocorrelation in limited-dependent variable models is required.
DEVELOPMENT PATHWAYS IN KENYA
79
Policy Implications
The promotion of markets through investment in roads and other infrastructure is
an obvious implication of our results. This is especially true in the more favorable
climatic zones. Support for this result in Kenya for the dairy sector is seen in Staal
et al. (2002), and regarding impact on household incomes, in Argwings-Kodhek et
al. (1999). This broad-based intervention is a good strategy because evidence shows
that farmers like to diversify among many agricultural enterprises, including food,
feed, and cash crops. Having said that, there is still scope for promoting markets for
long-standing and new cash crops and for disseminating information about their
management. In the less favorable areas, there is the additional need to identify and
develop higher-value enterprises suitable to these areas (in addition to cattle raising,
which is already practiced by households) because road development does not seem
to have the same strong impact with the currently available cash crops as it does in
the higher-potential zones. Finally, given our results regarding the positive influence
cash crops, dairy cattle, and woodlots have on wealth, the predominant role of maize
in smallholder agriculture should be seriously addressed within Kenya's Poverty
Reduction and Rural Development strategies, and support to these other options
pursued.
Notes
1. There was an attempt to "train" GIS software to distinguish among different land uses, but
this would have been enormously expensive and risky if the intention was to keep as many as 90 dif-
ferent land use categories. The analysts who did the job were the same who had been doing similar
interpretation for over 4 years.
2. Cash and horticultural crops include industrial crops such as sugar, tea, coffee, and py-
rethrum, vegetables, and fruits.
3. This is particularly the case in Kenya, where area under irrigation is minuscule.
4. An increase in P/PE of 0.1, holding temperature constant, is approximately equivalent to
an increase in rainfall of 143 millimeters annually.
5. These figures match fairly well with other available farm-level surveys, except for Napier
grass, which has been found to be quite prominent in many districts yet almost absent in the aerial
photo interpretation (Staal et al. 1997).
6. These were the svyreg and svyintreg commands in STATA.
7. The results from the regressions show a curvilinear relationship between market access and
land use. For all but a handful of observed values for market access, the effect of improved market
access is indeed positive.
8. Indeed, under the assumption of independent observations, market access becomes highly
significant in our estimations.
9. As noted earlier, ideally one would use a two-stage procedure to remove biases that may
emerge. However, lack of available exogenous variables at this scale prevent such an analysis.
C h a p t e r 4
Village Stratification for Policy Analysis:
Multiple Development Domains in the
Ethiopian Highlands of Tigray
Gideon Kruseman, Ruerd Ruben, and Girmay Tesfay
Many countries in Sub-Saharan Africa suffer from problems related to pov-
erty, natural resource degradation, and the complex interactions between
these phenomena (Cleaver and Schreiber 1994). In the northern Ethiopian
highlands of Tigray region, problems of poverty and degradation are extremely
severe: population density is very high, rainfall is scarce and erratic, and soil fertil-
ity is low. Under such conditions, farmers need to rely on external inputs and soil
conservation practices in order to stabilize or increase yields. Within the current
land use pattern, a wide range of different options are available for intensification
of production systems. The selection of appropriate pathways for intensification may
be different for specific locations. Therefore, village stratification can be used to select
technologies and practices that are applied under particular agro-ecological, socio-
economic, and institutional conditions.
The concept of development domains is used to facilitate the targeting of
development interventions. As discussed in Chapter 2, major dimensions of devel-
opment domains include the agricultural resource potential, market access, and
population density. These aspects may distinguish between situations where Mal-
thusian or Boserupian development is likely to take place (Pender 1998). Areas
with high population density, low agricultural potential, and low market access can
be expected to follow a Malthusian development path, where land resources typi-
cally suffer from soil mining and resource degradation. Boserupian development
82
GIDEON KRUSEMAN, RUERD RUBEN, AND GIRMAY TESFAY
tends to occur when there is sufficient market access that enables specialization,
leading to a more efficient use of scarce resources, as illustrated in the study More
People--Less Erosion (Tiffen, Mortimore, and Gichuki 1994). In these settings, the
proximity of markets allows the adoption of more sustainable agricultural practices.
However, in many parts of Africa, soils are so poor that the maximum carrying
capacity is reached at rather low population densities (Kruseman 2000).
The identification of development potentials is often addressed in an anec-
dotal fashion, whereas quantitative analysis is required for identifying more pre-
cisely the possibilities for targeting of interventions. This implies a search for an
accurate definition of the critical dimensions that broadly determine different strate-
gic development options. Following Pender, Place, and Ehui (1999), the dimen-
sions we use for distinguishing among development domains are (1) agricultural
potential (i.e., biophysical environment), (2) population density, and (3) market
access (i.e., socioeconomic environment). These dimensions are largely exogenous
to the households that try to cope with the biophysical and socioeconomic envi-
ronment. Household decisions regarding land use practices and production tech-
nologies result in particular livelihood strategies. We can differentiate with the three
criteria a total of eight different situations. We discuss each of these settings and
identify their importance for the selection of typical land use practices.
Identification and quantification of development domains has an important
practical meaning. It offers a framework for the design of particular development
interventions that are appropriate for certain areas. Village stratification is consid-
ered useful in order to identify the structural factors that influence the choice of
certain livelihood strategies. When diversity among villages is more important than
heterogeneity among households in the same village, targeting can be safely done
at the community level (Bigman and Fofack 2000).
Geographic targeting can also be interesting when patterns of heterogeneity
within villages are comparable regarding the presence of better- and poorly endowed
households, female-headed households, and landlessness. This is broadly the case
in Tigray region, where a common cultural, ethnic, and political background pro-
vides a shared legacy that results in relative socioeconomic homogeneity among the
population.1 If household resources are relatively homogeneous, the key dimensions
we mentioned before (i.e., agricultural potential, population density, and market
access) primarily define the development domains. Poverty and productivity in a
broad sense are directly linked to such geographic considerations, even if there
remains some heterogeneity among households within villages. Differences between
villages tend to be more appealing because what constitutes a rich farmer in one vil-
lage may be considered a poor one in another village. These differences are mainly
explained by the development domain dimensions. Geographic targeting can then
VILLAGE STRATIFICATION FOR POLICY ANALYSIS
83
be considered an effective strategy for selectively enhancing a process of agricultural
intensification.
In this chapter we develop a generic methodology for stratifying villages into
development domains using multivariate analysis of data derived from a commu-
nity survey. We determine the relative importance of the critical dimensions of the
development domains for particular livelihood strategies. The degree of correspon-
dence between these aspects indicates to what extent geographic targeting is justified.
The results of the analysis confirm the close correspondence between development
domains and resource use practices.
The remainder of this chapter is structured as follows. In the next section the
concept of development domains is discussed within the context of the Ethiopian
highlands of Tigray. Next, we outline the methodology used for deriving the main
dimensions of the development domains. Hereafter, we discuss the relevance of these
development domains for crop choice and land use practices in Tigray. We con-
clude with some implications for the targeting of development interventions.
Development Domains in Tigray
The northern Ethiopian highlands of Tigray face serious problems related to high
population density and limited agro-ecological potential. Regional programs for soil
and water conservation have been launched that are intended to increase land and
labor productivity. However, given the modest public resources that are available,
choices have to be made about where to target specific activities. Not all activities
are suitable for each community, and different communities are likely to benefit
most from specific types of interventions. Under these conditions, we cannot rely
on a "one-size-fits-all" strategy, and specific criteria must be developed in order to
differentiate among kushets (communities) and to select the most appropriate devel-
opment strategies.2
The concept of development domains can be used to identify the critical
dimensions that influence the adoption of certain resource management practices
(Hagos, Pender, and Gebreselassie 1999; Pender, Place, and Ehui 1999).3 This
approach is based on the notion that it is possible to disentangle the core elements
of past local development strategies in terms of adopted technologies. These can be
used as a first step to analyze what selective array of technologies or services might
be offered to potentially benefit other communities with similar development
domain dimensions. Patterns of cropping and livestock activities per se do not
indicate successful local development strategies, nor do they represent less-than-
preferable outcomes. The successful adoption of technology, however, is an indica-
tor of potential development pathways.
84
GIDEON KRUSEMAN, RUERD RUBEN, AND GIRMAY TESFAY
One of the main hypotheses of the development domains concept is the exis-
tence of differences in comparative advantages for adopting alternative livelihood
strategies, giving rise to essentially different development pathways. These differ-
ences in comparative advantage can be attributed to three main factors: agricultural
potential, market access, and population pressure.
Agricultural potential is a complex aggregate of various biophysical and agro-
climatic factors that can be decomposed in a number of different underlying fac-
tors, including rainfall, soil type and quality, altitude, slope, topography, and the
presence of pests and diseases. These aspects are, to a large extent, exogenous to
the farm households but are of overriding importance for determining the com-
parative advantage of producing different types of agricultural commodities in a
specific setting. The role of the agricultural potential varies for different commodities
and over time as a result of human-induced (e.g., soil degradation) and exogenous
change (e.g., climate change). The multidimensional aspect of agricultural poten-
tial, especially the fact that it can change over time, should be taken into account
in developing medium- and long-term strategies. Taking a cross section of a larger
region that captures to some extent different stages of human-induced and exogenous
change makes the use of a comparative static approach acceptable in the absence of
a long time series of relevant data.
Market access is equally important for determining the comparative advantage
of a specific locality for producing certain tradable commodities. Market access also
involves various dimensions and encompasses such components as distance to roads,
quality of roads, travel time, distance to markets and urban centers, degree of com-
petition, information costs, and transport opportunities. Although many factors
play a role, travel time is usually considered most crucial for market exchange
and input purchase decisions. Travel time is the result of some of the previously
mentioned variables (e.g., distance, quality of roads, and transport opportunities)
and determines others (information costs). It is therefore important to define a
measurable proxy for this factor. Market access is closely linked to the concept of
transaction costs whereby the penalty related to lack of market access influences
farm household decisions related to consumption and production (Omamo 1998;
Goetz 1992).
Population pressure has long been acknowledged as being a major driving force
with respect to the labor intensity of agriculture, creating a conducive environment
for innovations in technology, institutions, markets, and infrastructure (Boserup
1965; Ruthenberg 1980; Hayami and Ruttan 1985; Binswanger and McIntire
1987). It refers to both the density of population and the local available purchasing
power. Population pressure affects labor utilization decisions and hence agricultural
management practices as well as the return to different types of investments.
VILLAGE STRATIFICATION FOR POLICY ANALYSIS
85
These three main factors obviously interact with each other in complex ways.
In general, population pressure tends to be higher in areas with a greater agricul-
tural potential and with better market access or both, allowing the existing pop-
ulation to make a decent living while encouraging immigration from less favored
areas. On the other hand, increased population pressure is considered a major
contributing factor to the severe land degradation found in many parts of Africa,
thus affecting the agricultural potential. Market access tends to be better in highly
populated areas, where the per capita costs of infrastructure investment are lower.
Availability of infrastructure also tends to be better in high-agricultural-potential
areas that guarantee higher returns to investment. In their seminal study Machakos,
Tiffen, Mortimore, and Gichuki (1994) made a case for increased population pres-
sure leading to less soil degradation. In this specific case, better market access per-
mitted the necessary investments to reverse the process of soil degradation, allow-
ing alternative employment outside agriculture to reduce population pressure. The
absence of such market outlets in other parts of eastern Africa has led to accelerated
degradation. In Tigray, off-farm employment opportunities are limited primarily
to food-for-work and food-for-cash schemes of public goods provision. In areas
with low population density and limited agricultural potential where market access
is constrained, small demographic changes can occasion a chain of events leading
to degradation beyond the point of no return, as illustrated by the case of the Mossi
plateau in Burkina Faso (Savenije and van Zutphen 1991).
In summary, the variables of market access and population pressure are very
often correlated at the local level. Increasing population pressure may lead to better
market access, and improved market access tends to attract immigration and hence
increasing population pressure. Similarly, agricultural potential may be related to
population pressure, but this relationship is easily offset under conditions of scarcity
of market infrastructure.
In the northern Ethiopian highlands of Tigray we can identify settings with
high and low population density in both remote and accessible regions. In addi-
tion, there is no clear correspondence between population density and the available
agro-ecological potential. This is largely because population movements were orig-
inally induced by health considerations (escaping from malaria incidence in the
lowlands) and in later stages by political factors (moving away from conflict areas).
Tenure policies assigning land according to household size and family needs further
reinforced relatively equal factor distribution at the village level. In addition, recur-
rent droughts in the early 1970s and mid-1980s led to a general process of asset loss
and destitution that affected both poor and better-off households (Devereux, Sharp,
and Amare 2004). Finally, during the two decades of military conflict, farm invest-
ment decisions were seriously affected.
86
GIDEON KRUSEMAN, RUERD RUBEN, AND GIRMAY TESFAY
Methods and Data
In order to develop a spatial classification of different village-level development
domains for the northern Ethiopian highlands of Tigray, a statistically robust
methodology is required. We used multivariate statistical techniques to identify
critical development dimensions and their implications for crop choice and land
use practices. Therefore, we perform an analysis in three stages, addressing the
following issues:
Ě Identification of the main dimensions of village development domains
Ě Analysis of the mutual independence of the development domain
dimensions, in order to adequately distinguish what kind of interventions
might be useful
Ě Identification of the linkages between the development domain dimensions
and selected land use and cropping practices
The methods used in this chapter rely on the availability of a village level sur-
vey conducted by IFPRI, ILRI, and Mekelle University in 1998 and 1999.4 The
goal of this survey was to capture main characteristics of the villages in terms of
physical and social infrastructure, predominant economic activities, and develop-
ment indicators. We used this survey to classify each village (kushet) in the region
into a three-dimensional matrix of factors influencing development potential. At the
same time, predominant production systems and livelihood strategies were derived
from the same survey, giving an indication of the selected development strategies in
these particular settings.
The development domains are differentiated according to three key factors:
agro-ecological potential, market access, and population density. Major factors con-
tributing to agricultural potential are rainfall, altitude, and initial soil quality. The
community-level survey also provides data with respect to altitude and both quan-
titative and qualitative measures of soil quality.5 Rainfall data from other sources
were combined with the community survey. The factor market access is measured in
terms of distances and walking times to roads, services, towns, and market outlets.
The factor population density is directly derived from survey data.
For each of these dimensions there are usually a number of different variables
available. Choosing the useful proxy variables is not always easy. Especially in the
case of agricultural potential, which by definition includes multiple dimensions,
we should be careful to avoid arbitrariness. We relied on factor analysis methods to
reduce the data, deriving single quantitative measures for each main factor. This has
VILLAGE STRATIFICATION FOR POLICY ANALYSIS
87
the advantage of using all the variables in the data set that are relevant to the analy-
sis while preventing the occurrence of dependency among the factors used to define
development domain dimensions. Because we are not able a priori to determine
whether the development domain dimensions are completely independent, we test
for this using a two-stage least-squares and seemingly unrelated regression.
Once we quantified the development dimensions, we performed a detailed
analysis of the effects of these variables on the choice of particular land use systems
and cropping practices. This provides insight into the determinants of different
livelihood strategies and development opportunities within the communities.6
This analysis is based on regressing the development domain dimensions with vari-
ables related to land use (i.e., crop choice, livestock) and related production tech-
nologies (i.e., fertilizer use, animal feeding regimens, soil conservation practices).
In addition, we analyze the impact of the development domains on credit use
and some welfare indicators (housing, education). The latter variables represent the
outcomes of the current development pathways for the communities in Tigray and
are likely to depend to some degree on the development domain dimensions.
Once we have determined the relative importance of the development domain
dimensions, we are able to stratify the villages in the survey. Instead of using cluster
analysis to categorize households into quasi-arbitrary groups, we opt for a more
structural approach to identify the extremes using the available dimensions. For
this purpose, we divide the villages into three groups for each dimension depend-
ing on whether they have a high, low, or intermediate score on each dimension. We
prefer this procedure because development domain dimensions in general tend to
present themselves on a sliding scale.
Identifying Development Domains
This section presents the results from the village-level analysis of critical develop-
ment domains and compares these to the hypothetical development opportunities
(as identified by other authors, including Hagos, Pender, and Gebreselassie 1999).
Population density is directly captured by the corresponding variable in the com-
munity survey.7 With respect to agricultural potential, we differentiate between soil
quality and rainfall or altitude. For soil quality, two different dimensions are distin-
guished that explain 60 percent of the variation (see Table 4.1).8 The explanatory
variables include proportions of different quality classes of cultivated and grazing
land. Factor analysis results for defining agricultural potential indicate the impor-
tance of land degradation and soil quality (see Table 4.1).
Other components of the agricultural potential dimension are elevation and
precipitation.9 By combining these factors into the factor analysis, normalized
88
GIDEON KRUSEMAN, RUERD RUBEN, AND GIRMAY TESFAY
Table 4.1 Factor analysis results for soil quality in agricultural potential
Factor loadings
Variable
Level of degradation
Soil quality
Proportion of severely eroded cultivated land
0.822
0.103
Proportion of moderately eroded cultivated land
0.578
0.461
Proportion of severely eroded grazing land
0.779ş0.03
Proportion of moderately eroded grazing land
0.863
ş0.07
Proportion of good soil
ş0.303
0.882
Percentage of variance loaded onto the factor (extraction sums of
49.04
20.14
squared loadings)
Note: Extraction method: principal-component analysis.
values can be obtained (see Table 4.2). Note that data on elevation were obtained
from two different sources.10
Market access is divided into two separate factors. The first factor relates to
physical distance from markets and infrastructure (see Table 4.3), and the second
relates to the presence of external institutions that facilitate market access (see Table
4.4).11 Table 4.3 shows that remote villages have a consistently high score on all
distance variables.
Table 4.4 shows the importance of the presence of local institutions. The first
factor represents the local water associations in charge of the promotion of irri-
gation and the distribution of water. The second factor loads the presence of coop-
eratives and indicates that there is a negative correlation between the presence of
cooperatives and the availability of credit by other agencies (NGOs and state
Bureau of Agriculture). The third factor loads the activities of the Bureau of Agri-
culture, delivering credit and actively involved in the promotion of improved crop
Table 4.2 Factor analysis results for rainfall and altitude in agricultural potential
Factor loadings
Variable
Elevation
Rainfall
Expected annual precipitation (millimeters)
0.053
0.997
Elevation (meters above sea level)
0.989
ş0.010
Lower bound on altitude (meters above sea level)
0.937
ş0.115
Upper bound on altitude (meters above sea level)
0.901
0.048
Mean altitude (meters above sea level)
0.980
0.023
Percentage of variance loaded onto the factor (extraction sums of squared loadings)
72.65
20.21
Note: Extraction method: principal-component analysis.
VILLAGE STRATIFICATION FOR POLICY ANALYSIS
89
Table 4.3 Factor analysis results for market access (distance)
Factor
loading
Variable
Market access
Walking time to market center (minutes)
0.932
Walking time to bus service (minutes)
0.876
Walking time to all-weather road (minutes)
0.919
Distance to town (kilometers)
0.875
Distance to all-weather road (kilometers)
0.881
Percentage of variance loaded on factors (extraction sums of squared loadings)
80.44
Note: Extraction method: principal-component analysis.
and livestock practices. The fourth factor loads the delivery of credit by the NGO
Relief Society of Tigray (REST) in areas where commercial credit (traders and
moneylenders) do not have a strong presence.
Testing for Independence of Development Domain Dimensions
The interesting element in this analysis is that it is not clear a priori whether these
factors are endogenous or exogenous. It could be the case, for instance, that insti-
tutional presence is the result of some of the other dimensions in development
domains. We therefore need to test for the independence of these aspects.
Summarizing the factors determining development domains, we included the
following factors for the agricultural potential: precipitation (RF ); two variables
Table 4.4 Factor analysis results for market access (institutions)
Irrigation
Bureau of
NGOs
Factor
institutions
Cooperatives
Agriculture
(REST)
Market cooperative
0.37
0.65
0.21
0.00
Consumer cooperative
0.37
0.77
ş0.08
0.05
Water association
ş0.71
0.390.31
0.15
Credit by REST
0.35
ş0.03
ş0.34
0.64
Credit by Bureau of Agriculture
0.22
ş0.47
0.70
0.06
Irrigation promoted
ş0.75
0.24
0.26
0.23
Livestock improvement promoted
0.41
0.00
0.61
0.45
Commercial credit
0.26
0.18
0.33
ş0.61
Percentage of variance loaded on factors
21.8
18.6
16.3
13.2
(extraction sums of squared loadings)
Note: Extraction method: principal-component analysis, variables all of yes/no type.
90
GIDEON KRUSEMAN, RUERD RUBEN, AND GIRMAY TESFAY
defining soil properties, soil quality (SQ ) and degradation level (DL); and elevation
(EL). Population density (PD) and market access (MK ) are captured in single vari-
ables. We can test for independence or linkages among these factors through the
following system of equations:12
DL = f (SQ, RF, PD, MK )
(4.1)
when the inherent soil quality, rainfall, market access, and population density may
influence degradation level.
PD = f (DL, SQ, RF, EL, MK )
(4.2)
where population density may be caused by a variety of factors relating to other
biophysical or institutional factors determining development domains.
MK = f (SQ, RF, EL, PD)
(4.3)
where market access may be related to biophysical factors and to geographic location.
For each of the institutional factors (IF ) we test,
i
IF = f (SQ, DL, PD, MK, EL)
(4.4)
Results of the independence tests indicate that in this system of equations the
independent variables are almost completely independent, so they are not likely to
be endogenously determined.13 The variables that are not endogenously determined
are inherent soil quality, elevation, and rainfall. Degradation level is only slightly
correlated with rainfall; population density with inherent soil quality, elevation,
and rainfall; and market access is correlated with elevation. This poses no major
problems for the subsequent analysis because there is no endogenous determination.
In the case of institutional factors, a minor problem with endogeneity emerged
because some of the factors depend on population density and market access in
addition to being slightly correlated to exogenous factors. This implies that to be
on the safe side, we need to use three staged least-squares to determine which right-
hand-side variables should be used in the equations. Arguably, equations (4.1)ş
(4.4) might contain some omitted variables because factors pertaining to develop-
ment domain dimensions include only a limited number of underlying variables as
a result of data availability. We consider, however, that the model captures the
major development domain dimensions as indicated by theoretical considerations
regarding rural development.
VILLAGE STRATIFICATION FOR POLICY ANALYSIS
91
Village Stratification
For a further analysis of the village development domains we can now use the fol-
lowing six dimensions: market access, population density, and four aspects related
to the agricultural potential--altitude, rainfall, soil quality, and degree of degrada-
tion. Stratifying the communities according to the specific development domains is
used to identify different homogeneous settings. In the graphs of Figures 4.1ş4.3,
the villages are plotted according to the main development dimensions.
From Figure 4.1 we notice important differences in market access and pop-
ulation density among the villages. The diversity in these dimensions is wide, and
situations with high and low population density occur in both well-endowed and
poorly endowed villages.
Figure 4.2 depicts the data concerning altitude and rainfall. It illustrates basi-
cally three different situations: villages with low altitude and high rainfall, villages
with high altitude and low rainfall, and only a few cases with high altitude and high
rainfall. Variability in rainfall is, however, only between 475 millimeters and 770
millimeters per annum, whereas altitudes range from 1,500 to more than 3,000
meters above sea level. Scarcity of rainfall in this area generally represents a major
limiting factor for arable cropping.
Figure 4.3 indicates a rather even distribution of soil quality and degradation
over the communities. Soil degradation occurs both in villages with good soil quality
Figure 4.1 Development domain dimensions: Population density and market
access
3
2.5
2
1.5
1
0.5
0
2
1
0.5 0
1
2
3
4
P
opulation density
1
1.5
2
Market access
92
GIDEON KRUSEMAN, RUERD RUBEN, AND GIRMAY TESFAY
Figure 4.2 Development domain dimensions: Altitude and precipitation
4
3
2
1
Precipitation
0
3
2
1
0
1
2
3
4
1
2 Altitude
and in villages with poor soils. However, the impact of degradation is substantially
stronger in settings characterized by low intrinsic soil quality.
When we combine all the information available from 45 villages, the sample
can be classified into eight different development domains (see Table 4.5). We used
the factor scores on the three dimensions discussed before and excluded the data
ranges close to zero. In the case of agricultural potential we used a weighted average
of rainfall, soil quality, and degree of degradation to determine overall potential.14
The communities in the area are distributed fairly evenly over high- and low-
altitude areas, except that the communities with low market access, high population
density, and low agricultural potential are concentrated in the high-altitude areas.15
This diversity implies that farmers exhibit different choices or preferences regard-
ing suitable land use practices and market orientation that are most appropriate to
their local conditions.
Land Use Patterns and Production Systems
We analyze the importance of different critical dimensions of the village develop-
ment domains in order to identify the most important elements for the correspond-
ing development pathways. Therefore, we examine the influence of the exogenous
VILLAGE STRATIFICATION FOR POLICY ANALYSIS
93
Figure 4.3 Development domain dimensions: Soil quality and degree of
degradation
2.5
2
1.5
1
0.5
radation
deg
0
3
2
1
0
1
2
3
4
ree of
0.5
Deg
1
1
1.5
2
2.5
Soil quality
indicators of agro-ecological potential (population density, distance to markets, and
access to institutions) for the resource management strategies. The latter strategies
represent choice variables at the level of farm households.
We can distinguish three specific domains of household decisionmaking. First,
strategies for land use are discussed, focusing on cropping and livestock activities.
Crop choice is expected to depend mostly on differences in agricultural potential but
Table 4.5 Village stratification
Agricultural
potential
Market access
Population density
Low
High
Low
Low
6
6
High
4
3
High
Low
6
4
High
7
9
Note: N = 45.
94
GIDEON KRUSEMAN, RUERD RUBEN, AND GIRMAY TESFAY
is also influenced by market access and population density. These factors together
determine the comparative advantage for the agricultural production activities. Live-
stock activities involve long-term investments for the purchase and maintenance of
animal numbers and require the availability of pastures and institutional support.
The second aspect we explore refers to technology choice. The selection of appro-
priate cropping and livestock management regimes tends to be influenced by land
and labor resource endowments, market outlets, and institutional support. Given
the importance of rural financial services for the adjustment of land use practices,
we explicitly discuss the determinants of credit use.16 Finally, we discuss a number
of social development indicators in Tigray region that reflect differences in welfare.
The data analysis is focused on the relationship between the structural village
dimensions and the land use and production systems that reflect specific livelihood
strategies. The dimensions of development domains are considered to be indicators
for the possibility of relying on a certain development pathway. We used three-stage
least-squares (3SLS)17 to estimate the relationship between the endogenous and
exogenous variables. Endogenous variables are variables such as activity and tech-
nology choice that form part of predominant livelihood strategies. Exogenous vari-
ables are the development domain dimensions and institutional dimensions. Only
those factors related to livelihood strategies and development pathways with an
adjusted R2 higher than 5 percent are included to avoid spurious correlation.18
Activity Choice
The community survey data provide information on the proportions of arable crop-
ping activities within agricultural systems. This can be considered as the aggregate
outcome of individual choices at village level. Main cereal crops in the area are
barley, teff, maize, wheat, sorghum, and finger millet. The selection of cereal crops
strongly depends on the agro-ecological conditions, especially rainfall. In addition,
some pulses are grown, including chick peas, fava beans, and field peas. To a very
small extent cash crops are grown, such as flax, sunflower, sesame, and haricot beans.
The single-year production pattern masks to some extent the occurrence of crop
rotations, but intercropping appears in the overall land use pattern.19 Livestock
activities are particularly important for the highland communities, but not all
households are equally involved. The survey indicates that about 25 percent of the
households have no oxen, 40 percent possess only one ox, 25 percent possess two
oxen, and 10 percent have more than two oxen. The distribution of livestock indi-
cates that there are marked differences within communities with respect to live-
stock holdings.
The factors pertaining to elevation and rainfall are most important in deter-
mining cropping patterns (see Table 4.6). This confirms the key importance of
Table 4.6 Relation between crop choice and development domain dimensions using three-stage least-squares
Niger
Fava
Field
Haricot
Dimension
Barley
Maize
Wheat
Sorghum
Teff
seed
Chickpea
beans
Lentils
peas
Doliches
beans
Constant
0.2119***
0.1276***
0.1060***
0.0972***
0.2024***
0.0079***
0.0269***
0.0446***
0.0181***
0.0235***
0.0025***
0.0113***
Soil degradation
ş0.0411***
ş0.0036
ş0.0182*
ş0.0083
0.0376**
0.0027
ş0.0066
ş0.0079ş0.0012
ş0.0010
ş0.0009 0.0026
Soil quality
0.0006
0.0283**
ş0.0135
0.0181
ş0.0131
ş0.0006
ş0.0005
ş0.0025
ş0.00090.009
7
0.0005
ş0.0030
Elevation
0.1491***
ş0.0209
0.0623***
ş0.0641***
ş0.0909***
ş0.0044**
ş0.0084*
0.0499***
0.0186***
0.0132*
0.0076***
ş0.0070*
Rainfall
ş0.0895***
0.0696***
ş0.0386***
0.0435***
0.0662***
0.0036**
0.0097**
0.0196**
0.0061*
0.0057
0.0033***
0.0031
Population density
ş0.0441***
ş0.0303**
0.0163
ş0.0156
0.0326*
0.0031*
0.0083*
0.0061
0.0010
0.0078
ş0.0033***
ş0.0058
Distance to markets
0.0093
0.0164
0.0038
0.0398**
ş0.0544***
ş0.0008
ş0.0020
0.0039
0.0062
0.0022
0.0009
0.0061
Cooperatives
ş0.0372**
0.0316**
0.0140
ş0.0164
0.0346*
0.0002
0.0042
ş0.0083
ş0.0041
0.0072
0.0010
0.0017
NGO credit
0.0087
0.0480***
ş0.0135
ş0.0081
ş0.0009ş0.0003
0.0012
0.0110
ş0.0010
0.0057
0.0020
ş0.0037
Irrigation institutions
0.0303**
0.0137
ş0.00090.0107
ş0.0332*
0.0010
ş0.0002
0.0136
0.0025
ş0.0035
0.0021*
0.0000
Adjusted R 2
0.5364
0.3172
0.3935
0.3532
0.2808
0.0477
0.0567
0.2693
0.2326
0.0895
0.4027
0.1492
Note: Dependent variable is proportion of farm households growing a specific crop.
*, **, *** mean coefficient is statistically significant at 10 percent, 5 percent, and 1 percent level, respectively.
96
GIDEON KRUSEMAN, RUERD RUBEN, AND GIRMAY TESFAY
rainfall and altitude (temperature) as major limiting factors for crop production in
Tigray, whereas intrinsic soil fertility only plays a secondary role (except for maize).
Wheat and barley are both grown in high-elevation areas with low rainfall. Given
its lower labor demands, barley tends to be grown in less-populated areas where
there are no cooperatives and there is a presence of irrigation institutions. The cere-
als cultivated in the higher-rainfall areas (maize, sorghum,20 teff ) show differences
with respect to soil quality requirements. Teff production is found in areas with a
high degree of land degradation, whereas maize is selected in areas where better
soils are more prevalent. In addition, teff is cultivated in areas with better market
access, and sorghum is found in more remote villages. Maize cultivation is favored
by the presence of cooperatives and NGOs that guarantee input provision and
technical support.21 Likewise, teff cultivation is positively correlated with the pres-
ence of cooperatives, but this crop is replaced by higher-value horticulture crops
when irrigation institutions are active. With respect to pulses and other diversifica-
tion crops, the factors elevation and rainfall are of major importance. Doliches is
grown in low-population-density areas where irrigation institutions are present,
whereas chickpeas and niger seed are found in higher-density population areas.
The factor rainfall is also influencing livestock strategies in the area (see Table
4.7). More rainfall, better soils, and lower population density are positively related
to ox availability, indicating that both the quality and the quantity of resource en-
dowments are relevant for ox acquisition. Market access and cooperative presence
tend to favor the proportion of farmers with more than two oxen, who usually
operate more input-intensive and commercially oriented farming systems. Cows
are found in remote areas with less degraded soils, sheep are maintained in settings
with low population density and high elevation, whereas goats are located in vil-
lages with the opposite characteristics. Beekeeping is located in remote but highly
populated areas.22 The effect of the livestock promotion programs by the Bureau
of Agriculture (BoA) is clearly noticed in the growing proportion of households
with two oxen but is inversely related to goatkeeping. It is also clear that the involve-
ment of local NGOs in livestock promotion is rather minimal.
Technology Choice
In Tigray region, a wide range of different land use technologies have been pro-
moted and adopted by rural households. Table 4.8 provides an overview of the
proportion of farmers who make use of external inputs (i.e., fertilizers, seed), rely
on improved land use practices, and made fixed investment for soil conservation,
pasture development, or anti-erosion works. Intercropping and crop rotation, agro-
forestry, and terracing are adopted by more than half of the farmers, but irrigation
is limited to some selected locations. Fertility-enhancing practices such as green
Table 4.7 Relationship between livestock ownership and development domain dimensions
More than
Dimension
No oxen
One ox
Two oxen
two oxen
Cows
Sheep
Goats
Beehives
Constant
0.2411***
0.4291***
0.2461***
0.0946***
0.3888***
0.2987***
0.2860***
0.1749***
Soil degradation
0.0094
ş0.0046
ş0.0012
ş0.0028
ş0.0683***
ş0.0327
0.0103
ş0.0160
Soil quality
ş0.0320**
ş0.01190.0240*
0.0240***
ş0.009
7
0.0357
ş0.0234
ş0.0153
Elevation
0.0209
ş0.0106
ş0.0160
ş0.0047
ş0.0561**
0.0595**
ş0.0799***
ş0.0095
Rainfall
ş0.0149ş0.0285*
0.0256**
0.0248***
0.0228
ş0.0132
0.0332
0.0016
Population density
0.0193
0.0321*
ş0.0380***
ş0.0225**
0.0056
ş0.0517**
0.0467*
0.0343**
Distance to markets
0.0074
ş0.0320*
0.0007
0.0268**
0.0491**
ş0.0115
0.0299
0.0418**
Cooperatives
ş0.0116
0.0256
ş0.0074
0.0403***
ş0.0227
ş0.0100
ş0.0117
0.0212
NGO credit
0.01090.0212
ş0.0057
ş0.0170
0.0218
0.0370
ş0.0253
0.0059
Bureau of Agriculture
0.0009
ş0.0141
0.0165*
0.0037
ş0.0110
0.0131
ş0.0499***
ş0.0051
Adjusted R 2
ş0.0042
0.0981
0.1340
0.3418
0.1385
0.0511
0.1127
0.0422
Note: Bureau of Agriculture factor has a strong component related to livestock promotion.
Dependent variable is proportion of farm households having specific livestock units.
*, **, *** mean coefficient is statistically significant at 10 percent, 5 percent, and 1 percent level, respectively.
98
GIDEON KRUSEMAN, RUERD RUBEN, AND GIRMAY TESFAY
Table 4.8 Land use technologies
Technology
Mean
S.D.
Proportion of farmers using:
Fertilizers
0.672
0.278
Pesticides
0.137
0.236
Herbicides
0.030
0.103
Improved seed
0.290
0.247
Livestock vaccine
0.728
0.276
Purchased feed
0.400
0.300
Proportion of farmers who:
Burned to clear land
0.630
0.406
Fallowed fields for more than a year
0.185
0.299
Used improved fallow
0.015
0.082
Rotated crops
0.864
0.248
Used intercropping
0.499
0.394
Contour plowed
0.957
0.126
Mulched
0.006
0.051
Manured
0.623
0.280
Composted
0.208
0.251
Plowed in crop residues
0.072
0.206
Used green manure
0.002
0.014
Proportion of farmers making investments (since 1991) in:
Stone terraces
0.515
0.305
Soil bunds
0.226
0.304
Check dams and gully stabilizers
0.408
0.298
Drainage ditches
0.148
0.297
Irrigation wells
0.0090.053
Irrigation canals
0.241
0.314
Grass strips
0.013
0.066
Tree planting
0.575
0.364
Live fences
0.412
0.324
Private nurseries
0.001
0.010
manure, mulching, and plowing under crop residues are only rarely applied. Chemi-
cal fertilizers, livestock vaccines, and contour plowing are applied by more than
two-thirds of the households. On the opposite end, herbicides, improved fallow,
mulch, green manure, irrigation wells, grass strips, and private nurseries are used by
fewer than 5 percent of the households.
We can identify some of the structural variables that influence the choice of
land use practices and technologies (see Table 4.9). Fertilizers tend to be used on
lower-quality soils in settings with higher population density and with good mar-
ket access. Under these conditions, intensification of land use is mainly a demand-
driven option. Pesticide use is similarly related to higher population density, which
VILLAGE STRATIFICATION FOR POLICY ANALYSIS
99
requires more intensive pest and disease control. Improved seeds are mainly used in
areas with less-degraded soils. Vaccinations are mainly applied in high-potential
agricultural areas. Improved feeding practices (i.e., more balanced feed menus based
on crop residue grazing, cut and carry grass harvesting, and feed purchase) are
found in low-rainfall areas with little institutional presence.
We notice that fallow is practiced on less-degraded soils in areas with low pop-
ulation density. Less population pressure allows fallowing as a practice for control-
ling degradation. Manure and composting are mostly applied in low-rainfall areas.
The latter practice is most often found in areas with relatively good soils, and where
NGOs and irrigation institutions are present.
Investments in soil and water conservation structures show some interesting
results. Stone terracing is constructed where severe soil degradation is present. Live
fences are found where soils are degraded but soil quality is inherently good and
higher population densities permit labor-intensive investments. Other investments
such as soil bunds, drainage ditches, and tree planting are also found in less-degraded
areas. Cooperatives seem to enhance terracing but are less effective in tree planting.
Availability of NGO credit is particularly linked to soil bunds and drainage ditches.
Credit Use
The most important sources of credit in the region are friends or relatives and
NGOs, followed by the state BoA. Professional moneylenders and traders play an
important role in some communities. Most credit provision is not very closely
related to agro-ecological conditions (Table 4.10). Only the NGO REST focuses
its activities mainly in highly populated areas with low rainfall and high soil degra-
dation. Money lenders are the most important source of credit in villages where
cooperatives and irrigation organizations are active. Formal credit provision is
generally concentrated in areas with less degraded or good soils, where prospects
for semi-commercial production prevail.
Welfare Implications
In Table 4.11 we present some development indicators extracted from the survey.
These provide insight into the investments made for housing and schooling. Most
houses have a dirt floor, but major differences appear with respect to the roof. Metal
roofs are found in higher-rainfall areas with better market access and presence of
cooperatives. The high rainfall makes an investment in metal roofs more impor-
tant, and returns from trade and loans from local institutions allow farmers to make
these investments. Literacy rates are higher in areas with less rainfall and higher
population density. The presence of irrigation institutions and livestock promotion
programs of the BoA is positively correlated with education efforts.
100
GIDEON KRUSEMAN, RUERD RUBEN, AND GIRMAY TESFAY
Table 4.9 Relationship between technology choice and development domain dimensions
Improved
Improved
feeding
Soil
Dimension
Fertilizers
Pesticides
seed
Vaccinations
practices
bunds
Constant
0.6636***
0.1455***
0.2904***
0.7229***
0.4184***
0.2249***
Soil degradation
ş0.0179ş0.0440
ş0.0728***
ş0.0805***
0.0409ş0.0772**
Soil quality
ş0.0795***
0.0024
0.0381
0.0630**
ş0.0590*
0.1058***
Elevation
0.0004
ş0.0234
ş0.0071
0.0100
0.0122
ş0.0501
Rainfall
0.0230
ş0.0142
ş0.0437*
ş0.0257
ş0.1025***
ş0.0493
Population density
0.1076***
0.0767***
0.0254
0.0032
0.0438
0.0128
Distance to markets
ş0.0625*
0.0044
ş0.0185
ş0.00290.0009
ş0.0172
Cooperatives
0.0209
0.0438
0.0329
0.0499
ş0.0944***
0.0109
NGO credit
0.0192
ş0.0287
0.0264
ş0.0005
ş0.1004***
0.0651*
Irrigation institutions
0.0222
0.0183
0.0234
0.0304
Bureau of Agriculture
0.0240
ş0.0010
Adjusted R 2
0.1588
0.0670
0.0661
0.0698
0.1515
0.1586
Note: Dependent variable is proportion of farm households using a specific technology.
*, **, *** mean coefficient is statistically significant at 10 percent, 5 percent, and 1 percent level, respectively.
Synthesis
The three core dimensions of the village development domains in Tigray have
important implications for rural development options. Biophysical aspects, espe-
cially rainfall and temperature--and to a minor extent soil fertility--determine the
Table 4.10 Relationship between credit use and development domain dimensions, by credit source
Women's
NGO
Bureau of
Society
Money
Family
Factor
REST
Agriculture
of Tigray
lenders
Traders
and friends
Constant
0.4618***
0.2264***
0.0008
0.0470***
0.0010
0.5981***
Soil degradation
ş0.0661**
ş0.0025
ş0.0003
0.0032
ş0.0016*
ş0.0989**
Soil quality
ş0.0287
ş0.0093
0.0032***
ş0.0109
ş0.0002
ş0.0474
Elevation
0.0183
ş0.0277
ş0.0018
ş0.0052
ş0.0007
ş0.0264
Rainfall
ş0.0741**
ş0.0437
0.0023**
ş0.0085
ş0.0008
ş0.0661
Population density
0.0994***
0.0261
0.0015
ş0.0031
ş0.0005
ş0.0394
Distance to markets
0.0375
ş0.0582
ş0.0013
0.0138
0.0005
ş0.0775
Cooperatives
ş0.0248
ş0.0973***
ş0.0012
0.0161
0.0066***
ş0.0486
NGO credit
0.0504
0.01290.0011
ş0.0565***
0.0000
ş0.0863*
Irrigation institutions
0.0716**
0.0653*
0.0010
0.0215**
0.0036***
ş0.1503***
Bureau of Agriculture
ş0.0024
0.1733***
0.0005
0.0234***
0.0029***
0.0275
Adjusted R 2
0.1502
0.32290.09
67
0.3414
0.4355
0.1301
Note: Dependent variable is proportion of farm households using specific credit sources.
*, **, *** mean coefficient is statistically significant at 10 percent, 5 percent, and 1 percent level, respectively.
VILLAGE STRATIFICATION FOR POLICY ANALYSIS
101
Gully
Drainage
Manure
Compost
Irrigation
Stone
Tree
stabilization
ditches
Fallow
application
application
canals
terraces
planting
0.3973***
0.1389***
0.1780***
0.6282***
0.2555***
0.5058***
0.5973***
0.1958***
0.0427
ş0.0672**
ş0.0643*
ş0.0071
ş0.0327
0.1025***
ş0.0671*
0.0054
0.1342***
0.0679**
ş0.0003
ş0.0433
0.0312
ş0.0257
ş0.0068
0.0447*
0.0626**
0.0196
0.0035
ş0.0379
0.0074
ş0.0041
0.0501
ş0.0015
0.1093***
0.0719**
ş0.0458
ş0.0662**
0.0726**
0.0188
ş0.0930**
ş0.0628***
ş0.0424
ş0.0470
ş0.0990***
ş0.0368
0.0014
0.0141
0.0580
0.0366
0.0063
ş0.0296
0.0305
0.0216
0.0601
0.0515
ş0.0202
ş0.0291
ş0.0312
ş0.0328
ş0.0007
0.0155
0.0052
0.0820**
ş0.1235***
0.0021
ş0.0171
0.0963***
0.0499
0.0268
0.0474
0.0223
ş0.0054
0.0699**
ş0.0262
0.0632***
ş0.0280
0.0165
ş0.1036***
0.0352
0.0862**
0.0427*
0.0227
0.3535
0.1825
0.0392
0.0634
0.0758
0.1232
0.1067
0.1725
scope for crop choice and livestock production. Population density influences the
degree of input intensification of cropping systems, whereas livestock intensifi-
cation takes place in areas with lower population density. Formal credit is mainly
concentrated in high-potential areas, but NGOs target credit to resource-poor
regions and households. Market access and institutional organization appear as key
Table 4.11 Relationship between human development indicators and development
domain dimensions
Houses with
School-age children
metal roofs
Adult literacy
attending school
Constant
0.0916***
0.5304***
0.6573***
Soil degradation
0.0096
ş0.0150
ş0.0254
Soil quality
ş0.0039ş0.0076
0.0283
Elevation
ş0.0243
ş0.0332
ş0.0012
Rainfall
0.0457**
ş0.0427**
ş0.0473**
Population density
0.0562***
0.0506**
0.0750***
Distance to markets
ş0.0604***
ş0.0025
ş0.0296
Cooperatives
0.0429*
0.0114
0.0387
NGO credit
ş0.0193
0.0151
0.0244
Irrigation institutions
ş0.0102
0.01690.0621***
Bureau of Agriculture
0.0205
0.0726***
0.0301*
Adjusted R2
0.1308
0.1445
0.1698
Note: Dependent variable is proportion of farm households meeting the human development indicator criterion.
*, **, *** mean coefficient is statistically significant at 10 percent, 5 percent, and 1 percent level, respectively.
102
GIDEON KRUSEMAN, RUERD RUBEN, AND GIRMAY TESFAY
incentives for cropping systems intensification and for enhancing investments in
soil and water conservation activities. In a similar vein, investments in housing are
made under more favorable agro-ecological, market, and institutional conditions,
whereas investments in schooling are an attractive device for enhancing engage-
ment in nonfarm employment in low-potential areas with high population density.
Discussion and Conclusions
We developed in this chapter a quantitative methodology for identifying relevant
dimensions for village development domains that determine the scope for specific
land use and production systems. This analysis can be useful both for extension
and policy purposes; results can be used as a first step for the definition of recom-
mendation domains for technical assistance services and for the identification of
effective incentive regimes that permit farm household resource intensification. In
addition, the methodology gives insight into the different local development path-
ways and the critical factors that influence farmers' livelihood strategies.
With the data derived from community surveys, it proved to be possible to
extract the relevant dimensions of local development domains. We distinguished
among agro-ecological potential, population density, and market access. The agro-
ecological potential is by far the most complicated dimension because it includes
multiple aspects: rainfall, soil quality, soil degradation, and elevation. Rainfall and
soil quality determine the cropping potential, and altitude (as a proxy for tempera-
ture) needs to be taken into account because it determines the feasible options for
crop diversification within the agricultural system. The distance to market outlets is
relevant to determine whether these activities can be made economically attractive.
The relative independence of the critical dimensions of the development
domains has been evaluated using regression methods. The correlations among these
development domain dimensions are very low: the correlation is less than 1 percent
between the level of degradation and rainfall and between population density and
soil quality, and less than 4 percent between market access and altitude. The R2 for
most regressions is so low that we can safely ignore these interdependencies in our
further analysis.
Understanding current production systems in terms of cropping patterns, live-
stock activities, and technology choice in relation to development domain dimen-
sions gives a good indication of how development has occurred in the past. Although
the past is not the only determinant of future pathways, and dynamic factors are
not captured explicitly, it constitutes a relevant frame of reference. The systematic
quantification of development domains and the predominant livelihood strategies
therein provide a benchmark against which development strategies can be evaluated.
VILLAGE STRATIFICATION FOR POLICY ANALYSIS
103
The occurrence of predominant cropping systems mainly depends on the vari-
ables pertaining to rainfall and altitude (temperature). These variables determine the
suitability of a certain agro-ecological zone for certain land use systems. Soil qual-
ity and degradation only play a secondary role. In some cases crop choice depends
on factors such as population density and market access. Maize production is found
in more densely populated areas where otherwise sorghum would prevail. Better
market access in the low-altitude areas seems to favor millet production. Market
access is very important in the adoption of cash crops.
The development of livestock production depends on different factors. Rain-
fall and availability of pastures and feed are required for the maintenance of oxen.
Ox ownership is fairly widespread in Tigray to guarantee timely land preparation.
However, the number of oxen per household varies considerably. More oxen per
household are found in settings where soils are of better quality and population
densities are lower, permitting the availability of sufficient pasture and feed of good
quality. Ox ownership tends to be greater in more remote areas. Under conditions
of poor soil quality, dairy production and beekeeping arise as alternative strategies
for farmers who possess stable market outlets. When markets are more remote,
small stock production for local use appears as a useful alternative.
The selection of suitable and appropriate land use technology depends strongly
on soil quality and the level of land degradation. The use of improved seeds depends
on market access, whereas the use of external inputs is related to higher population
density. In a similar vein, gully stabilization mainly occurs in erosion-prone areas
located at higher elevations receiving higher rainfall on terrains with relatively good
soil, whereas compost application is mostly done in low-rainfall settings to main-
tain soil fertility and improve moisture retention. This implies that farmers seem to
be more inclined toward intensification of their land use systems in villages with
high population pressure, especially when soil degradation is not yet a large prob-
lem. In general, adoption of improved land use technologies is positively correlated
with better soils or less-degraded soils.
Geographic targeting of interventions requires the identification of appropriate
technologies, followed by the application of suitable incentives. This means that tech-
nology packages should be oriented toward the specific development domains, taking
into account the institutional and market conditions that prevail in each village.
Institutional factors appear to play a major role in defining the incentive frame-
work. However, institutional support by the state or NGO agencies is not fully
independent of the other development dimensions. The presence of marketing insti-
tutions is relevant for the selection of commercially oriented cropping activities,
and credit proved to be important for the expansion of oxen traction. For the adop-
tion of improved land use practices, the availability of credit plays an overriding role.
104
GIDEON KRUSEMAN, RUERD RUBEN, AND GIRMAY TESFAY
Access to markets tends to be less important than institutional support. There
are indications that farmers are able and willing to make the necessary investments
for improving production and yields under conditions of increasing population pres-
sure because some investment indicators are positively correlated with population
density. Financial services also play an important role in controlling land degrada-
tion. Formal credit from state development agencies tends to be concentrated in
less degraded areas because demand for credit is higher in better-endowed areas. By
contrast, NGO credit provisions focus on less-favored areas.
The results in this chapter indicate some promising perspectives for further
research. Making use of community-level surveys for collecting information on
resource endowments, predominant land use patterns, and production systems
enables the identification of some common dimensions of different development
domains. Although this does not directly provide an indication of appropriate
development pathways per se, the results from this analysis are useful for identify-
ing feasible options when combined with location-specific information. Although
the methodology in itself is sufficiently robust, further research at the farm house-
hold level is required to identify the farm household's responsiveness to specific
policy incentives. The results of the stratification can also be used for developing bio-
economic household and village models that reveal the welfare and sustainability
implications of different incentive regimes (see Kruseman 2000; Ruben, Kruseman,
and Kuyvenhoven 2006).
The methodology developed in this chapter generates structural information
that needs to be complemented by local case studies that could reveal other more
behavioral motives for farming systems choice and livelihood strategies. This
approach can be considered as a step toward differentiating predominant develop-
ment patterns from idiosyncratic situations. Moreover, the approach offers a more
generalized analysis compared to location-specific farming systems research, which
provides a useful benchmark for comparing alternative development interventions. It
is not meant to offer exact policy recommendations, however, but rather provides
guidance to the directions in which these policy recommendations might be found.
Notes
The authors are grateful to John Pender (IFPRI, Washington, D.C.) and Berhanu Gebremedin
(ILRI, Addis Ababa) for their support with the data analysis and interpretation. Data collection
took place under a collaborative program among IFPRI, ILRI, and Mekelle University. We sincerely
thank Mekelle University authorities for their willingness to share the data for this purpose. We are
grateful to Sam Benin (ILRI, Addis Ababa) and two anonymous referees for comments on an earlier
version of the chapter.
VILLAGE STRATIFICATION FOR POLICY ANALYSIS
105
1. Diversity between household configurations in terms of differences in life cycle and intra-
household relations can, of course, be registered, as indicated by Bauer (1977) and Abate (1995).
2. The lowest administrative level in Ethiopia is the tabia. In Tigray a number of kushets
(hamlets) can be distinguished within the tabia. In this chapter we refer to kushets as villages, although
some of the data we use are at the tabia level.
3. The notion of recommendation domains with fine-tuned development interventions was
suggested as a general methodological framework in Farming Systems Research (FSR) in the 1980s.
These approaches tended to be less formalized with a much broader set of criteria defining the
domains than we use in our analysis. By narrowing down the criteria to three broad dimensions, we
make the approach much more comparable across geographic locations, thus addressing one of the
major criticisms against FSR as being too site-specific.
4. For details on the village survey, see Pender et al. (2001a).
5. Farmers' perceptions of soil properties are based on farmer perceptions of soil quality and
are therefore a good measure of perceived short- and medium-term land use potential.
6. The use of SUR with identical X matrices takes into account that the analysis considers
the activities as being done not in isolation but as parts of broader livelihood strategies. We report
on this elsewhere in more detail (Kruseman, Ruben, and Tesfay 2006).
7. We choose to include population density in the factor analysis in order to get a normalized
value for this variable.
8. In order to maintain meaningful variables, we combined some of the variables through a
number of data reduction steps.
9. Only total rainfall is used as a determinant of development domain dimension because
data on interannual and intraseasonal variation is either missing or incomplete.
10. Tigray is a mountainous area, and indicators for altitude depend on the criteria used for
defining what is relevant. By using two data sources we attempt to reduce biases. One source is the
village-level survey, and the other is based on general geographic information.
11. We have chosen not to use all the variables related to distance available in the community
survey. A number of variables related to walking time and distance to local (grain mills) and social
infrastructure (schools and medical services) are excluded from the analysis. They load on a separate
factor that is not expected to have an important influence on development domains.
12. Soil quality (SQ) is considered as inherent soil quality based on prevalent soil types, not
the result of cultivation practices. Testing for endogeneity does not indicate otherwise.
13. We relied on three-stage least-squares to determine the interdependence of the develop-
ment domain dimensions using the truly exogenous factors (inherent soil quality, rainfall, and ele-
vation) as instruments. Although some coefficients are significantly different from zero, all adjusted
R2 values are well below zero, indicating that the system of equations cannot adequately explain any
variation. It can thus be concluded that there is no correlation among the error terms.
14. The weights used range between 1 and ş1 to indicate how the factor scored on agricul-
tural potential.
15. Superimposing the results of this analysis with recently defined agro-ecological zones of
the country might be helpful in guiding research priorities and development needs.
16. We focus on actual use of credit, given the supply by local institutions, because credit use
is an endogenous decision of farm households.
17. Three-stage least-squares is the seemingly unrelated regression method with correction for
endogeneity. The seemingly unrelated regression method (SUR) applies to a system in which each
106
GIDEON KRUSEMAN, RUERD RUBEN, AND GIRMAY TESFAY
equation has an endogenous variable on the left side and only exogenous variables on the right side.
As in the standard regression case, the disturbances are assumed to be uncorrelated with the exoge-
nous variables. Each equation of this kind of system could be estimated by regression, equation by
equation. However, if the disturbances of the equations are correlated, the SUR estimator is more
efficient because it takes into account the entire matrix of correlations of all the equations. The SUR
estimator minimizes the determinant of the covariance matrix of the disturbances.
18. The excluded endogenous variables all represent minor activities with only few observations.
19. The existence of some rotations appears when factor analysis is done on cropping patterns
(not reported here).
20. This is an interesting finding because sorghum is usually not considered as a high-rainfall-
demanding crop. However, rainfall is limited in the highlands of Tigray, even in relatively "higher
rainfall" parts of this region.
21. This does not exclude the fact that maize is also grown in areas with little NGO presence.
22. The statistical relationships found in the data do not exclude the occurrence of other sit-
uations, such as beekeeping in low-population-density areas, but rather, they indicate predominant
patterns.
C h a p t e r 5
Land Management, Crop Production,
and Household Income in the Highlands
of Tigray, Northern Ethiopia:
An Econometric Analysis
John Pender and Berhanu Gebremedhin
Low agricultural productivity, poverty, and land degradation are critical and
closely related problems in the Ethiopian highlands. These problems are
particularly severe in the highlands of Tigray in northern Ethiopia. Cereal
yields average less than 1 ton per hectare in this region, and over half of the area of
the Tigray highlands has been characterized as severely degraded, according to one
study (Hurni 1988).1 The average farm size is only 1 hectare, and most households
subsist on incomes of less than $1 per day (based on results of the survey discussed
in this chapter).
In recognition of these problems, the regional government of Tigray has under-
taken a massive program of investment and resource conservation since the fall of
the Derg regime in 1991. The regional development strategy of conservation-based
agricultural developmentşled industrialization has focused on promoting conser-
vation of natural resources and improvement of agricultural productivity and wel-
fare through a broad program of rehabilitation of natural resources, investment in
infrastructure, agricultural extension, education, and other services. These efforts
built on the philosophy of self-reliance and strategies of local democratic participa-
tion and community mobilization for local conservation and development efforts
that were initiated during the struggle of the Tigray People's Liberation Front (TPLF)
against the Derg regime (Young 1996; Hagos, Pender, and Gebreselassie 1999; Hailu
108
JOHN PENDER AND BERHANU GEBREMEDHIN
and Haile 2001) and have been given high priority as a result of the recurrent famines
in the region.
Empirical evidence of the impacts of these policies and identification of spe-
cific areas where problems need to be addressed are needed. Addressing this infor-
mation need is the primary objective of this study.
This study is based on econometric analysis of household and plot-level sur-
veys conducted in 100 villages in 50 tabias (the lowest administrative unit in Tigray,
usually comprising four or five villages) in the highlands of Tigray during 1999ş
2000.2 It builds on a prior study based on tabia- and village-level surveys in the
same communities in 1998ş99 (Pender et al. 2001a), which were used in the empir-
ical work reported in Chapter 4. This broad sample and the information collected
at different levels enable investigation of the impacts of community-level factors
such as population density, investments in irrigation and roads, as well as house-
hold and plot-level factors such as household wealth, education, land tenure, and
other factors on land management and the implications for agricultural productivity
and land degradation.
Empirical Model, Methods, and Hypotheses
Empirical Model
The key outcomes of interest in this study are agricultural production and per
capita income.3 We consider the proximate causes of each of these, including house-
hold choices regarding income strategies, land management, and other decisions,
and the underlying determinants of these choices.
Crop production. For agricultural production, we focus on the value of crop
production per hectare. We assume that the value of crop production by household
h on plot p ( y ) is determined by the amount of inputs (labor, ox power, fertilizer,
hp
seeds) used (IN );4 the land management practices (manure or compost, burning,
hp
contour plowing, reduced tillage, intercropping) used (LM ); the "natural capital"
hp
of the plot (NC ) (biophysical characteristics and presence of land investments);
hp
the tenure characteristics of the plot (T ) (how plot was acquired, i.e., whether
hp
allocated in prior land distribution, inherited, leased [sharecropped in almost all
cases], received as gift, or borrowed); the household's endowments of physical cap-
ital (PC ) (land, livestock, radio [reflecting access to information as well as wealth],
h
human capital (HC ) (education, age, and gender of household head, size of house-
h
hold), financial capital (use of credit and accumulation of savings), and "social cap-
ital" (SC ) (assets in form of relationships, indicated by participation in programs
h
AN ECONOMETRIC ANALYSIS IN THE HIGHLANDS OF TIGRAY
109
and organizations); the household's income strategy (IS ) (primary and secondary
h
income sources); village-level factors that determine local comparative advantages
(X ) (agro-ecological conditions, access to markets and infrastructure, and popula-
v
tion density); and random factors (u
):
yhp
y
= y(IN , LM , NC , T , PC , HC , FC , SC , IS , X , u
) (5.1)
hp
hp
hp
hp
hp
h
h
h
h
h
v
yhp
Equation (5.1) is not a production function but rather a gross revenue func-
tion. As such, it aggregates the value of production per hectare of different crops
and depends on the farm-level prices of the crops produced.5 Because different
crops are produced by different households in different locations in Ethiopia, we
do not explicitly include crop prices as determinants of crop revenue per hectare;
this would result in many missing observations for farm level prices. Instead, we
assume that farm-level prices are determined by village-level factors determining
local supply, demand, and transportation costs of commodities (X ) and household-
v
level factors affecting households' transactions costs and marketing abilities (HC ,
h
FC , SC , IS ). Land tenure (T ) can affect productivity, for example, by affect-
h
h
h
hp
ing incentives to apply labor effort and other inputs to sharecropped land compared
to owner-operated land (Shaban 1987).6 Household endowments of physical cap-
ital (PC ) can also affect crop production if there are imperfect factor markets. For
h
example, ownership of oxen may influence crop production even after controlling
for the amount of ox labor used because owners of oxen have preferential access to
ox power at times of peak demand. In addition, agro-ecological conditions, house-
holds' human and social capital, and their farming experience may also influence
agricultural productivity, even if these factors have no impact on prices.
Input use and land management. In equation (5.1), input use and land man-
agement are choices in the current year, determined by the natural capital and tenure
of the plot; the household's endowments of physical, human, social, and finan-
cial capital at the beginning of the year; the household's income strategy; agro-
ecological conditions, access to markets and infrastructure, and population density
(X ); and unobservable factors (u
and u
):
v
INhp
LMhp
IN
= IN(NC , T , PC , HC , SC , FC , IS , X , u
)
(5.2)
hp
hp
hp
h
h
h
h
h
v
INhp
LM
= LM(NC , T , PC , HC , SC , FC , IS , X , u
)
(5.3)
hp
hp
hp
h
h
h
h
h
v
LMhp
Most of the determinant factors in equations (5.2) and (5.3) are either exoge-
nous to the household (e.g., X ) or state variables that are predetermined at the
v
110
JOHN PENDER AND BERHANU GEBREMEDHIN
beginning of each year (e.g., NC , PC , HC , and FC ). Income strategies may
hp
h
h
h
change from year to year but are usually slow to change because of irreversible
investments in human and social capital (required for such changes as development
of new skills and investments in developing market connections are needed to
shift from subsistence to cash crop production).7 Thus, we assume that households'
current income strategies are determined by fixed or slowly changing factors and
therefore are predetermined in equations (5.1)ş(5.3).
Participation in programs and organizations (SC ) and use of credit (FC )
h
h
may be partly or wholly determined in the current year and hence potentially
affected by current decisions about input use and land management. In the econo-
metric analysis (discussed in more detail below), we use predicted participation in
programs and organizations and predicted use of credit as instrumental variables to
address this potential endogeneity concern. We predict participation in programs
and organizations and use of credit using village-level factors affecting local com-
parative advantages and placement of programs (X ), household endowments of
v
land (NC ), and human capital (HC ).8 For example, membership in an agricul-
h
h
tural cadre requires literacy and some experience in modern agricultural practices,
access to credit may depend on the household's endowment of land, and placement
of programs may depend on local comparative advantages.
SC = SC(HC , NC , X )
(5.4)
h
h
h
v
FC = FC(HC , NC , X )
(5.5)
h
h
h
v
The determinants of value of crop production will be estimated using the struc-
tural model (accounting for potential endogeneity bias, as discussed below) repre-
sented by equation (5.1) as well as in reduced form. The reduced form is obtained
by substituting equations (5.2)ş(5.5) into equation (5.1):
y
= y(NC , T , PC , HC , IS , X , u )
(5.6)
hp
hp
hp
h
h
h
v
yhp
Per capita income. We assume that household per capita income is determined
by the same endowments that determine land management and input use deci-
sions, except that plot-level factors are aggregated to the household level:9
I = I(NC , T , PC , HC , SC , FC , IS , X , u )
(5.7)
h
h
h
h
h
h
h
h
v
Ih
Equation (5.7) is a reduced-form equation because we do not include endoge-
nous decisions that affect income such as input use and land management practices,
AN ECONOMETRIC ANALYSIS IN THE HIGHLANDS OF TIGRAY
111
as in equation (5.1). It is not a fully reduced form, however, because it includes FCh
and SC , which are potentially endogenous variables as noted above. These vari-
h
ables are included in this specification because we want to investigate the impacts
of these factors on household income. Substituting equations (5.4) and (5.5) into
equation (5.6), we also can derive the fully reduced form version of equation (5.7):
I = I (NC , T , PC , HC , IS , X , u )
(5.8)
h
h
h
h
h
h
v
Ih
Equations (5.1)ş(5.8) are the basis for the econometric estimations.
Methods
Data Sources
This study is based on a survey of 500 households in 100 villages in 50 commu-
nities (tabias) in the highlands of Tigray conducted in 1999 and 2000. Tabias less
than 1,500 meters above sea level elevation were excluded from the sample frame.
A random sample of tabias was used, stratified by distance to the woreda (district)
town and whether an irrigation project was present in the tabia. Two villages were
randomly selected within each sample tabia, and five households were randomly
selected from each village. In addition to household-level information, information
was collected on all plots owned or operated by the respondent households. The
survey data were supplemented by data from tabia and village surveys on prices and
other factors, secondary data from the 1994 Population Census on the population
of each tabia, and maps of the boundaries of each tabia (used to calculate popula-
tion density).
Econometric Approach
The dependent variables analyzed in this study include the amounts of inputs used
on each plot in 1998 (labor, draft animal power, and seeds), adoption of the most
common crop and land management practices in 1998 (use of fertilizer, improved
seeds, manure or compost, burning to clear the plot, contour plowing, reduced
tillage, and intercropping or mixed cropping), the value of crop production on the
plot, per capita income of the household, and whether the household head partici-
pated in the extension program, used formal or informal credit, or participated as a
member in certain community organizations (tabia council, village council, mar-
keting cooperative, or agricultural cadre).10 The econometric model used depends
on the nature of the dependent variable. For use of labor, ox-power, and seeds, the
value of crop production, and per capita income, least-squares regressions were used.
112
JOHN PENDER AND BERHANU GEBREMEDHIN
For explaining whether various land management practices were used, whether
the household participated in agricultural extension, various organizations, or used
credit, probit models were used.
The explanatory variables include indicators of agricultural potential (average
rainfall and altitude); population density; access to roads and markets (walking time
to nearest all-weather road and to the woreda [district] town); wealth (land and
livestock owned); human capital (gender, age, and education of household head,
and household size, a proxy for family labor endowment); income strategy (pri-
mary and secondary income source); ownership of a radio (a determinant of access
to information); availability of cash savings; household social capital (membership in
various organizations); use of formal or informal credit; contact of the household
with the agricultural extension program; and various plot-level factors, including
land use of cultivated plots11 (whether homestead, rain-fed, or irrigated), land
tenure (how plot acquired), presence of investments on the plot (stone terrace, soil
bund, fence), and several indicators of different aspects of quality of the plot (size
of plot, distance of the plot to the farmer's residence, plot slope, position on slope,
soil depth, color, texture, and presence of gullies).
In the crop production regression and the input use regressions, we used a log-
arithmic Cobb-Douglas specification. We included interaction terms between fer-
tilizer use and presence of a stone terrace, a soil bund, or irrigation to test whether
there is complementarity between fertilizer use and these investments, because
of the expected impact of these investments on soil moisture availability. Because
inputs and land management practices are endogenous choice variables in the crop
production regression, and participation in programs and organizations and use of
credit may be endogenous, we use instrumental variables (IV) estimation, using
instruments for input use, land management practices, participation in programs
and organizations, and use of credit. We also estimate the full model using ordinary
least squares (OLS) and test for endogeneity bias using a Hausman (1978) test.
Predicted values of the endogenous discrete explanatory variables from probit regres-
sions (equations [5.2]ş[5.5]) were used as instrumental variables. Exclusion restric-
tions for other instrumental variables excluded from the regression were based on
joint statistical Wald tests (only variables that were jointly statistically insignificant
at the 20 percent level or greater in both OLS and IV models were excluded). We
also estimate the reduced form (RF) specified in equation (5.6) and report the
robustness of our results across specifications.12 The reduced form gives an indi-
cation of the total effect of underlying explanatory variables on crop production,
allowing for change in input use, land management practices, participation in pro-
grams and organizations, and use of credit. We also investigate indirect effects using
simulations as discussed below.
AN ECONOMETRIC ANALYSIS IN THE HIGHLANDS OF TIGRAY
113
We also use IV estimation in the input use and income per capita regressions
to account for possible endogeneity of participation in programs and organizations
and use of credit, as noted above, and report the robustness of our results. In the
land management (probit) regressions, IV estimation could not be used.13 We used
predicted values of the potentially endogenous variables as explanatory variables.
Because of space limitations, we do not report the results of the probit regressions
used to predict participation in programs and organizations and use of credit.14 As
for the value of crop production, we also estimate the determinants of per capita
income in reduced form (equation [5.8]).
We tested the regression specifications for problems of multicollinearity but
found this not to be a serious problem in any of the specifications.15 Various regres-
sion diagnostics were used to identify outliers and influential observations and to find
and correct data errors. All models used the Huber-White estimator of the covari-
ance matrix, which is robust to heteroskedasticity, accounted for clustering of the
data by household (i.e., estimated standard errors are robust to nonindependence
of observations from the same household), and accounted for the stratification and
probability of sampling each village and household in the sample frame (StataCorp
2003). The results are thus robust to potential problems of heteroskedasticity and
nonindependence and are statistically representative of the highlands of Tigray.
Predicted Impacts of Selected Variables
In a complex structural model, such as estimated in this study, a change in a partic-
ular causal factor may have impacts on outcomes of interest through many different
channels, given the many intervening response variables that may be affected. For
example, improvements in education may affect agricultural productivity directly
by affecting farmers' ability to use technologies that affect productivity. But it may
also influence productivity indirectly, for example, by affecting households' choice
of land management practices or participation in extension. Such indirect effects
must be accounted for if we are to understand the full effect of causal factors on
agricultural production and income.
In studies in which the empirical relationships are linear and involve continu-
ous variables, the predicted total impacts of changes in explanatory variables can
be determined using total differentiation of the system (Fan, Hazell, and Thorat
1999). In this study, this approach is not practical because of the nonlinear limited
dependent variable models estimated. To address this issue, we simulate the pre-
dicted responses implied by the estimated econometric relationships under alterna-
tive assumptions about the values of the explanatory variables for the entire sample
and carry these predicted responses forward to determine their influence on subse-
quent relationships in the system.16
114
JOHN PENDER AND BERHANU GEBREMEDHIN
Agriculture and Land Management in the
Highlands of Tigray
Biophysical and Socioeconomic Conditions
The average annual rainfall is generally less than 1,000 millimeters in the semiarid
highlands of Tigray and averages about 650 millimeters for all sample households
(Table 5.1). Altitude in the highlands averages 2,174 meters above sea level and
ranges from 1,500 to well over 3,000 meters above sea level.
The rural population is growing rapidly at more than 3 percent per annum,
and population pressure is high in the Tigray highlands, with average population
density of 137 persons per square kilometer in the sample communities. As a result,
the average farm size in the Tigray highlands is only 1 hectare. Land is relatively
equally distributed in the Ethiopian highlands because of the radical land reform
program begun in 1975 by the Derg regime (Rahmato 1984; Bruce, Hoben, and
Rahmato 1994; Abate 1995; Amare 1995) and the continued prohibition of land
sales and mortgages under the current government of the Ethiopian Peoples Revo-
lutionary Democratic Front (EPRDF), a policy enshrined in the new Ethiopian
constitution.17 Hence, the maximum farm size in our sample was only about 4
hectares. Almost all households own livestock, with cattle most important (in value
terms), followed by sheep and goats. The average household size is 5.4.
Access to roads, transportation, and other services has improved substantially
in Tigray since 1991. Nevertheless, most households are still far from roads, trans-
portation services, and markets. In 1998, the average walking time (the dominant
mode of transport) to the nearest all-weather road was more than 2 hours, while
walking time to the nearest woreda town averaged 3.5 hours.
Education has improved dramatically in Tigray since 1991 as a result of the
greatly increased number of schools and literacy campaigns. Still, only about 15
percent of household heads had formal schooling by 1998 (only 6 percent had
more than 2 years), and 7 percent had participated in a literacy campaign.
The availability of agricultural extension and credit services has also greatly
expanded. Nearly three-fifths of households had access to credit from formal sources
in 1998. Development agents of the extension service were involved in virtually
every community, though only about 11 percent of sample households had direct
contact with an extension agent.
About 6 percent of households have members in a marketing cooperative that
is involved in marketing agricultural (mainly crop) outputs and providing inputs.
About 2 percent of households have a member in an agricultural cadre that focuses
on improving agricultural production. A similar small proportion of households
are involved as community leaders in the local tabia or village council.
AN ECONOMETRIC ANALYSIS IN THE HIGHLANDS OF TIGRAY
115
Table 5.1 Descriptive statistics of households in Tigray highlands survey, 1998
Variable
Number of observations
Mean (standard error)
Annual rainfall (millimeters)
480
652 (5)
Altitude (meters above sea level)
500
2,174 (22)
Population density (persons/km2)
490
136.8 (4.4)
Female head of household
500
21.8 (2.2)
Age of household head (years)
500
46.0 (0.7)
Household size (number)
500
5.4 (0.1)
Education of household head (percentage of households)
1ş2 years
500
9.2 (1.6)
3+ years
500
6.1 (1.3)
Literacy campaign
500
7.3 (1.5)
Walking time to nearest (hours)
All-weather road
496
2.33 (0.l3)
Woreda town
497
3.54 (0.17)
Ownership of assets
Land (hectares)
477
0.98 (0.04)
Oxen (number)
496
1.12 (0.05)
Other cattle (number)
496
2.71 (0.16)
Small ruminants (number)
496
4.95 (0.54)
Pack animals (number)
496
0.71 (0.06)
Radio (percentage owning)
500
13.2 (1.9)
Cash savings (percentage having)
500
54.4 (2.7)
Secondary income source (percentage of households)
No secondary source
496
20.6 (2.2)
Cereals
496
2.9 (0.9)
Perishable annuals
496
3.3 (1.1)
Perennial crops
496
3.6 (1.2)
Cattle
496
35.0 (0.9)
Small ruminants
496
2.2 (0.9)
Beekeeping
496
0.4 (0.3)
Food-for-work
496
6.1 (1.1)
Salary employment
496
1.6 (0.6)
Farm employment
496
1.4 (0.6)
Trading
496
6.5 (1.3)
Food/other assistance
496
6.5 (1.3)
Other nonfarm
496
10.0 (1.7)
Membership in organizations (percentage of households)
Tabia council
500
1.6 (0.7)
Village council
500
2.0 (0.9)
Marketing cooperative
500
6.4 (1.2)
Agricultural cadre
500
1.6 (0.7)
Use of credit (percentage of households)
Formal credit
500
57.7 (2.7)
Informal credit
500
18.9 (2.1)
Contact with extension (percentage of households)
500
11.4 (1.7)
Household income (birr)
477
1,924 (120)
Per capita income (birr)
477
388 (22)
116
JOHN PENDER AND BERHANU GEBREMEDHIN
Poverty is severe in the highlands of Tigray. Average per capita income among
the sample households was only 388 EB in 1998 (less than $60).18 Per capita income
is even lower among female-headed households and larger households.
Income strategies. For at least 2,000 years, the predominant farming system and
income strategy in the northern Ethiopian highlands has been cereal cultivation sup-
ported by ox-plow tillage (McCann 1995). Not surprisingly, the dominant source
of income in the highlands of Tigray is still cereal crop production, which is the
primary source of income for 97 percent of sample households. Different income
strategies are thus distinguished more by differences in the secondary source of
income. One-fifth of households have no secondary source of income; cereal
crop production is their sole income source. In about one-third of households, the
secondary source of income is cattle production. Nonfarm activities--including
trading activities, food-for-work, salary employment, and other nonfarm activities--
are the secondary income source of about one-fourth of households. Other less
common secondary sources of income include production of perishable annual or
perennial crops, small ruminants, beekeeping, farm wage labor, and food aid and
other forms of assistance.19
Land management. Preharvest labor use in crop production averaged 86 per-
son-days per hectare, most of this for plowing, planting, and weeding (Table 5.2).
Draft animal use (mainly oxen) averaged 25 animal days per hectare. Seed use
averages 118 kilograms per hectare. Fertilizer was used on 27 percent of plots, and
manure or compost on about 20 percent of plots in 1998. Improved seeds were
used on only about 2 percent of plots.
The most common investments in land improvement in Tigray are stone ter-
races and soil bunds. Stone terraces existed on nearly 37 percent of cultivated plots
in 1998, while soil bunds existed on about 8 percent. These investments have been
widely promoted in Tigray during the past few decades through food-for-work pro-
grams and community labor mass mobilization campaigns,20 as well as resulting
from farmers' own private investment initiatives (Hagos, Pender, and Gebreselassie
1999; Kinfe 2002; Hagos and Holden 2005). Although public conservation invest-
ments are most common, private soil and water conservation investments are also
relatively common, and the intensity of such investment is greater where private
investment is involved (Hagos and Holden 2005). Other less common investments
included constructing a fence or planting a live fence, and planting trees.
Several land management practices are commonly used in Tigray, including con-
tour plowing, burning to prepare fields, reduced tillage, and intercropping or mixed
cropping. Contour plowing is very common, practiced on nearly 90 percent of plots.
Table 5.2 Descriptive statistics of plots in Tigray highlands survey, 1998
Variable
Number of observations
Mean (standard error)
Land investments (percentage of plots)
Stone terrace
1,785
36.5 (1.9)
Soil bund
1,785
8.3 (1.0)
Constructed fence
1,785
3.8 (0.7)
Live fence or barrier
1,785
3.1 (0.6)
Land use (percentage of plots)
Homestead
1,785
19.7 (1.0)
Rainfed cultivated
1,785
73.7 (1.1)
Irrigated cultivated
1,785
6.6 (1.0)
Use of inputs
Labor (person-days/hectare)
1,785
86.4 (9.5)
Oxen power (animal-days/hectare)
1,785
25.3 (1.9)
Seed (kilogram/hectare)
1,785
118.1 (7.7)
Improved seed (percentage of plots)
1,785
2.4 (0.5)
Fertilizer (percentage of plots)
1,785
27.0 (1.6)
Use of land management practices (percentage of plots)
Burning to prepare field
1,785
11.0 (1.3)
Contour plowing
1,785
87.5 (1.6)
Reduced tillage
1,785
12.3 (1.2)
Intercropping/mixed cropping
1,785
11.4 (1.2)
Manure or compost
1,785
22.8 (1.3)
Value of crop production (EB/hectare)
1,593
1816 (176)
How plot acquired (percentage of plots)
Leased in
1,785
13.7 (1.3)
Allocated by tabia
1,785
84.0 (1.4)
Inherited
1,785
1.4 (0.5)
Received as gift/other
1,785
0.9 (0.3)
Plot area (hectares)
1,508
0.30 (0.01)
Walking time to residence (hours)
1,780
0.39 (0.02)
Plot slope (percentage of plots)
Flat
1,779
57.8 (2.0)
Gentle
1,779
32.3 (2.0)
Steep
1,779
9.9 (1.4)
Position on slope (percentage of plots)
Top
1,785
13.1 (1.4)
Middle
1,785
21.1 (1.6)
Bottom
1,785
28.0 (2.2)
Not on slope
1,785
37.9 (2.2)
Soil depth (percentage of plots)
Deep
1,767
21.9 (1.4)
Medium
1,767
38.1 (1.7)
Shallow
1,767
40.0 (1.8)
Soil color (percentage of plots)
Black
1,767
27.8 (2.2)
Brown
1,767
12.4 (1.1)
Grey
1,767
22.9 (1.8)
Red
1,767
36.8 (2.0)
Soil texture (percentage of plots)
Clay
1,767
27.6 (2.2)
Loam
1,767
31.7 (2.0)
Sand
1,767
29.7 (1.8)
Silt
1,767
11.1 (1.3)
Gullies on plot (percentage of plots)
1,785
5.1 (0.7)
118
JOHN PENDER AND BERHANU GEBREMEDHIN
Crop production. The average estimated value of crop production on surveyed
plots was 1,815 EB per hectare in 1998.21 The average value of production was
higher on plots where inorganic fertilizer was applied (2,184 EB/hectare) than
where no fertilizer was applied (1,684 EB/hectare). The average value of produc-
tion was substantially higher on irrigated plots (6,726 EB/hectare) than on non-
irrigated homestead plots (1,838 EB/hectare) or rain-fed field plots (1,428 EB/
hectare). These figures are the total value of production during the year, including
multiple crops, which is why the irrigated production value was so much higher.
These differences may also result from other factors besides fertilizer use or irriga-
tion (such as differences in cropland quality); multivariate analysis is needed to
control for such factors.
Results of Econometric Analysis
Input use and land management practices. Population pressure is associated with higher
use of labor and animal draft power per hectare and with a higher probability of use
of fertilizer and intercropping (Table 5.3). We also find that households that own
more land are less likely to apply fertilizer to a particular plot and more likely to use
Table 5.3 Determinants of input use and land management practices in crop production, 1998
Labor
Oxen
ln(person
ln(animal-
Seeds
Variablea
days/ha)b
days/ha)b
ln(kg/ha)b
Fertilizerc
ln(Population density/km2)
0.122**+
0.154***+++
0.079
0.076**++
Female head of household
ş0.415***şşş
ş0.207***şş
0.241**
ş0.050
ln(Age of household head) (years)
0.224**++
ş0.045
0.216
0.071
ln(Household size) (number)
0.123*
0.061
0.152*
ş0.019
Education of household head
3+ years
0.319***++
ş0.001
0.201
ş0.009
Literacy campaign
0.047
0.119
ş0.005
ş0.012
Walking time to (hours)
All-weather road
ş0.081***şşş
ş0.016
ş0.001
ş0.048***şşş
Woreda town
0.016
ş0.044***şşş
ş0.009
0.006
Plot from residence
ş0.125
ş0.026
0.077
ş0.095**şş
Ownership of assets
Land (tsimad)
0.015
ş0.005
ş0.025
ş0.059**ş
Oxen (number)
0.087**+
0.071**++
0.039
0.013
Other cattle (number)
0.012
0.007
0.022*+++
0.011**++
Small ruminants (number)
ş0.008**şş
ş0.006***şş
ş0.014***şşş
ş0.002
Pack animals (number)
ş0.004
ş0.009
0.026
ş0.015şş
Radio (yes/no)
0.028
ş0.127**şş
0.096
0.052+
Cash savings (yes/no)
0.080+
ş0.008
0.125
0.058*+++
AN ECONOMETRIC ANALYSIS IN THE HIGHLANDS OF TIGRAY
119
reduced tillage. These findings support the Boserup (1965) hypothesis that popu-
lation pressure causes farmers to intensify use of labor and other inputs and to
adopt more intensive land management practices, and are consistent with the find-
ings of Kruseman, Ruben, and Tesfay in Chapter 4.22
Access to roads, markets, and farmers' fields also affects the intensity of land
management. Households closer to an all-weather road use more labor per hectare
and are more likely to use fertilizer, burning, and contour plowing, also consistent
with findings in Chapter 4.23 Households closer to a woreda town use more draft
animal power per hectare but are less likely to contour plow. Farmers are more
likely to use fertilizer, improved seeds, and manure or compost on plots closer to
their residence, probably because of the difficulty of transporting inputs to distant
plots. This is consistent with the findings of Gebremedhin and Swinton (2003a),
who found that farmers in central Tigray were more likely to use stone terraces on
plots nearer to the homestead, in the sense that more intensive land management is
used on plots closer to the residence.
Income strategies affect land management. Households for which cereals are
a secondary income source use less ox power per hectare and are more likely to use
Intercropping/
Improved
Manuring/
Burning to
Contour
Reduced
mixed
seedc
composting
prepare fieldc
plowingc
tillagec
croppingc
0.0002
0.0491*
ş0.0025
ş0.0048
ş0.0160
0.0605***+++
ş0.0018
ş0.0871***şşş
0.0245
ş0.1112***
0.0018
ş0.0199
0.0024*+++
ş0.0464
0.0347*+++
0.0466*++
ş0.0325
0.0182+++
ş0.0006
ş0.0138
ş0.0043++
0.0049
ş0.0472*
0.0199++
0.0014+++
0.0171
0.0220+++
0.0278++
ş0.0126
ş0.0148++
0.0020
0.0489
0.0442+++
ş0.0075
ş0.0118
ş0.0063
0.0009
ş0.0097
0.0156***şşş
ş0.0143**ş
0.0069
0.0049
ş0.0012*
0.0061
0.0054+++
0.0114**++
ş0.0036
ş0.0110**
0.0082***şşş
ş0.3178***şşş
0.0106
ş0.0317*ş
0.0381
ş0.0280ş
ş0.0009
ş0.0136
0.0072
0.0276**
0.0551***++
ş0.0082
0.0008+
0.0388***++
0.0097
0.0378***+++
ş0.0359***şş
0.0153*+
0.0000
0.0043
0.0046**+
0.0000
0.0021
0.0024
ş0.0001
0.0017
ş0.0028***şşş
0.0009
0.0018
ş0.0019**ş
ş0.0014***şşş
ş0.0143
ş0.0056
0.0064
0.0026
ş0.0195***şş
ş0.0014
0.0051
ş0.0150
ş0.0030
0.0402
ş0.0362*şş
0.0003
ş0.0659**şş
0.0058
ş0.0231
ş0.0063
ş0.0050
(continued )
120
JOHN PENDER AND BERHANU GEBREMEDHIN
Table 5.3 (continued)
Labor
Oxen
ln(person
ln(animal-
Seeds
Variablea
days/ha)b
days/ha)b
ln(kg/ha)b
Fertilizerc
Secondary income source
Cereals
ş0.112
ş0.404**şş
0.003
ş0.009
Perishable annuals
0.534**
ş0.108
0.004
ş0.012
Perennial crops
0.247*+
0.039
0.001
ş0.009
Cattle
ş0.188**şş
ş0.211***şş
0.145
ş0.012
Small ruminants/beekeeping
ş0.272*ş
ş0.215
0.163
ş0.009
Food-for-work/farm work
ş0.438***şşş
ş0.368***şşş
0.248*
ş0.012
Salary employment
0.129
ş0.067
0.192
ş0.009
Trading
0.019
ş0.119
ş0.189
ş0.012*
Food/other assistance
ş0.310*
ş0.351***şşş
0.321*
ş0.009
Other nonfarm
0.006
ş0.099
0.083
ş0.012
Contact with extension
ş0.095
ş0.120*ş
ş0.061
ş0.046
Membership in organizations
Tabia council
ş0.041
ş0.036
ş0.263
ş0.057
Village council
0.644***+++
0.178
0.243
0.119
Marketing cooperative
ş0.111
0.007
0.250*+
0.013
Agricultural cadre
ş0.301**
0.079
ş0.778***
0.191
Use of credit
Formal credit
0.023
ş0.006
0.179**
0.191***
Informal credit
0.048
ş0.064
ş0.066
0.038
Land use (cf. rain-fed plot)
Homestead plot
0.426***+++
0.160***+++
0.236***+++
0.006
Irrigated plot
0.875***+++
0.308**++
ş0.025
0.160*+
Initial investment on plot
Stone terrace
0.023
ş0.028
0.068
0.091***+++
Soil bund
0.064
0.090++
0.024
0.052
Fence (live or constructed)
0.367***+++
0.002
0.053
0.016
Intercept
7.215***+++
6.652***+++
3.394
NR
Number of observations
1,402
1,353
1,435
1,607
Mean of dependent variable
3.932
3.184
4.229
0.2698
Mean predicted dependent variable
3.932
3.184
4.229
0.2685
R 2 or pseudo-R 2
0.5314
0.3357
0.4913
0.2125
Note: NR means that the intercept is not reported by the Stata procedure showing marginal effects in probit models.
*, **, *** mean coefficient is statistically significant at 10 percent, 5 percent, and 1 percent levels, respectively.
+, ++, +++ and ş, ş ş, ş ş ş mean coefficient is positive (negative) and statistically significant at 10 percent, 5 percent, and
1 percent levels, respectively in IV regressions and probit models using predicted values of participation in extension, credit,
and organizations.
aCoefficients of biophysical variables (annual rainfall, altitude, plot slope, position on slope, soil depth, soil color, soil texture,
and presence of gullies), plot area, and how plot acquired not reported to save space. Full results available upon request.
AN ECONOMETRIC ANALYSIS IN THE HIGHLANDS OF TIGRAY
121
Intercropping/
Improved
Manuring/
Burning to
Contour
Reduced
mixed
seedc
composting
prepare fieldc
plowingc
tillagec
croppingc
ş0.0005
ş0.1002
ş0.0192
ş0.0439
0.1922**++
ş0.0356*
0.1522***+++
0.0180
0.0123
ş0.1398*
0.1838**++
0.0631
0.0592***+++
ş0.0790
ş0.0377*şş
ş0.0248
ş0.0255
d
0.0044*+
ş0.0092
ş0.0681***şş
ş0.0367
0.0295
ş0.0419**
d
ş0.0935**şş
0.0271
0.0578
0.0501
ş0.0493***şşş
0.0163**+
ş0.0520
ş0.0337*ş
ş0.0711*
0.0715++
0.0015
0.0041
ş0.0981*ş
ş0.0291
ş0.0043
ş0.0445
ş0.0112
0.0079
ş0.0193
ş0.0277
0.0245
0.1383**+++
0.0025
0.0087+
ş0.0852**şş
ş0.0448**şşş
ş0.0561
0.0407
ş0.0430**şş
0.0088
ş0.0667
ş0.0142
ş0.0391
ş0.0011
0.0238
0.0013şşş
ş0.0207
ş0.0190şşş
0.0171ş
ş0.0039şş
0.0185ş
d
ş0.0713ş
0.0349
e
0.0312
d
0.2415***++
0.2785***+++
d
e
ş0.0476
0.2535**+
0.0001
0.0174
ş0.0326*şş
ş0.0110
0.0389
0.0189
ş0.0017*
ş0.0755ş
0.0548
ş0.0036
ş0.0265
0.0007şş
0.0024**+
0.0060
0.0183ş
0.0305*
0.0001
ş0.0249
ş0.0011+++
ş0.0304
0.0238++
0.0143+
0.0292+
ş0.0224+
ş0.0028***şşş
0.4402***+++
0.0092
0.0365*+
0.0371
0.0228
0.0156**++
0.1125
0.0380
ş0.0171
0.125***+++
ş0.0382
ş0.0004
0.0274
0.0137
0.0361**++
0.0193
0.0068
ş0.0015ş
ş0.0188
0.0773***+++
0.0387
0.0196
0.0154
0.0020
0.2783***+++
0.0096
0.0375
ş0.0259
0.0015
NR
NR
NR
NR
NR
NR
1,528
1,607
1,559
1,524
1,588
1,528
0.0236
0.2429
0.1078
0.8803
0.1181
0.1176
0.0233
0.2437
0.1078
0.8674
0.1182
0.1171
0.3512
0.4241
0.2717
0.2951
0.1748
0.2747
b Least squares regression. Coefficients and standard errors adjusted for sampling weights, clustering, and stratification.
Hausman test failed to reject OLS model in all cases (P = 1.000).
c Probit regression. Reported coefficients represent effect of a unit change in explanatory variable on probability of use at the
mean of the explanatory variables.
d No positive values of dependent variable for positive values of the explanatory variable. Observations with positive values
of the explanatory variable dropped from the regression.
eOnly positive values of dependent variable for positive values of the explanatory variable. Observations with positive values
of the explanatory variable dropped from the regression.
122
JOHN PENDER AND BERHANU GEBREMEDHIN
reduced tillage. Producers of perishable annuals and perennial crops are more likely
to use improved seed than cereals-only producers. Producers of perishable annuals
also are more likely to use reduced tillage. Cattle producers use less labor and draft
power in crop production than cereals-only farmers and are less likely to use burn-
ing, suggesting that cattle producers are less focused on intensive crop production
than cereals-only producers. Similarly, small ruminant producers are less likely to
apply manure or compost or to use intercropping. Households dependent on food-
for-work or farm employment use less labor and draft power than cereals-only pro-
ducers but are more likely to use improved seeds. Households involved in trading are
more likely to use reduced tillage, probably because of labor and capital constraints.
Households dependent on food aid or other assistance use less draft power and are
less likely to apply manure or compost, to use burning, or to use intercropping.
Such households apparently lack the ability to farm as intensively as others.
As expected, irrigation increases use of labor, ox power, improved seeds, and
fertilizer (impact on fertilizer weakly significant at the 10 percent level) because of
the production of multiple crops per year.24 Irrigation also promotes reduced tillage.
Fertilizer use and contour plowing are more likely on plots with a stone terrace,
suggesting complementarity of such soil and water conservation investments with
use of inputs and contour plowing. Labor use and use of manure and compost are
greater on plots that have a fence, suggesting that fences help to promote labor-
intensive practices. Burning is more common on plots with soil bunds; perhaps
such bunds contribute to problems with weeds (Herweg 1993b).
Not surprisingly, use of formal-sector credit is strongly associated with greater
use of fertilizer and improved seeds. This is because this credit is used primarily to
purchase such crop inputs.25 Informal credit is not significantly associated with use
of any crop inputs or land management practices, perhaps because informal credit
is used for other purposes than agricultural production. Surprisingly, contact with
the extension program is not significantly associated with use of inputs or land
management practices. It appears that it is not the extension program per se that is
leading to significant increases in use of fertilizer in Tigray but, rather, availability
of credit and other factors.
Ownership of livestock and other assets affects land management. Households
that own more oxen use more labor and ox draft power per hectare, suggesting
that oxen and labor are complements and that imperfect markets for hiring oxen
constrain households that own fewer oxen. Greater ox ownership also increases use
of manure and compost and contour plowing but decreases use of reduced tillage.
Greater ownership of other types of cattle is associated with greater use of seeds and
fertilizer, probably because income generated from cattle products helps farmers
afford to buy these inputs. Consistent with this explanation, households with cash
AN ECONOMETRIC ANALYSIS IN THE HIGHLANDS OF TIGRAY
123
savings are more likely to use fertilizer and less likely to use manure and compost,
suggesting that cash constraints limit use of fertilizer. By contrast, greater owner-
ship of small ruminants is associated with less use of labor, draft power, seeds, and
burning. This suggests that small ruminant producers focus less of their effort on
crop production.
Human capital affects land management. Female-headed households use sig-
nificantly less labor and draft power, probably because of labor constraints and a
cultural taboo against women plowing and threshing in Tigray.26 Consistent with
this, female-headed households also are less likely to apply manure or compost and
less likely to use contour plowing. Older household heads use more labor, probably
because of greater availability of family labor old enough to be involved in crop
production. Farmers who have completed three years of education use more labor
than uneducated heads.
Social capital also affects land management. Households with members of a
village council use more labor per hectare and are more likely to use improved
seeds, manure or compost, and intercropping. Such households appear to be more
oriented toward intensive crop production than other households.
Crop production. The amounts of seed and ox power used have relatively large
and statistically significant positive impacts on production (elasticities of 0.27 and
0.20 in the OLS model) (Table 5.4). By contrast, the impact of human labor is
quantitatively small (elasticity = 0.04) and statistically insignificant. This suggests
that surplus labor exists in crop production in Tigray, with additional labor yield-
ing little positive impact, although capital and seed inputs are key constraints. This
is not surprising, given the very small farm sizes and marginal agricultural condi-
tions in Tigray, and it implies that population growth can have very negative con-
sequences for human welfare because the additional labor may not be productively
used in agriculture (Lewis 1954). Of course, as we have seen, population pressure
and small farm sizes contribute to adoption of more intensive practices such as use
of oxen and fertilizer, which can increase yields. Thus, the negative consequences of
population pressure can be mitigated to some extent by such Boserupian responses.
We investigate the extent of this mitigation below.
Several land investments and land management practices have large and statis-
tically significant influences on the value of crop production. The predicted value
of production is 23 percent higher on plots with stone terraces controlling for labor
use, land management practices, and other factors.27 Use of burning to prepare
the field is associated with 29 percent lower yields, and reduced tillage with 45 per-
cent higher yields. Use of fertilizer is associated with 14 percent higher yields, and
manure or compost with 13 percent higher yields (both effects statistically significant
124
JOHN PENDER AND BERHANU GEBREMEDHIN
Table 5.4 Determinants of value of crop production per hectare, 1998
ln(Value of crop production/hectare)
Variablea
OLSb
IVb
RF
ln(Population density/km2)
ş0.013
ş0.154
0.016
Female head of household
ş0.551***
ş0.478**
ş0.481***
ln(Age of household head) (years)
ş0.148
c
ş0.090
ln(Household size) (number)
ş0.145*
ş0.212*
ş0.090
Education of household head
3+ years
0.139
c
0.235*
Literacy campaign
0.003
c
0.066
Walking time to (hours)
All-weather road
0.017
c
0.014
Woreda town
ş0.056**
ş0.028
ş0.069***
Plot from residence
0.066
c
0.052
Ownership of assets
Land (hectares)
ş0.009
c
ş0.019
Oxen (number)
ş0.043
c
ş0.035
Other cattle (number)
0.052***
0.014
0.063***
Small ruminants (number)
0.006
c
0.005
Pack animals (number)
ş0.046*
c
ş0.032
Radio (yes/no)
ş0.147*
c
ş0.078
Cash savings (yes/no)
0.098
c
0.027
Secondary income source (cf. none)
Cereals
0.263
c
0.121
Perishable annuals
ş0.250
ş0.413
ş0.337
Perennial crops
0.269*
d
0.199
Cattle
ş0.226*
ş0.245*
ş0.223*
Small ruminants/beekeeping
0.049
c
0.080
Food-for-work/farm employment
0.007
c
0.133
Salary employment
ş0.197
c
ş0.190
Trading
0.106
c
0.193
Food/other assistance
0.403**
0.319
0.604***
Other nonfarm
ş0.016
c
ş0.009
Contact with extension
ş0.142*
0.104
e
Membership in organizations
Tabia council
0.435**
d
e
Village council
0.227
c
e
Marketing cooperative
0.342***
0.073
e
Agricultural cadre
ş0.130
c
e
Use of credit
Formal credit
0.067
c
e
Informal credit
ş0.067
c
e
Land use (cf. rain-fed plot)
Homestead plot
0.147**
ş0.359
0.425***
Irrigated plot
ş0.173
ş0.714
0.134
Initial investment on plot
Stone terrace
0.206***
0.397***
0.163**
Soil bund
0.153
ş0.458
ş0.100
Fence (live or constructed)
0.083
0.086
0.068
AN ECONOMETRIC ANALYSIS IN THE HIGHLANDS OF TIGRAY
125
Table 5.4 (continued)
ln(Value of crop production/hectare)
Variablea
OLSb
IVb
RF
Use of inputs
Fertilizer (1 = yes)
0.130*
0.799*
e
Fertilizer Î stone terrace
ş0.076
ş0.804**
e
Fertilizer Î soil bund
ş0.455***
0.369
e
Fertilizer Î irrigation
0.131
0.663
e
ln(Seed/hectare) (kilograms/hectare)
0.268***
0.617***
e
Improved seed (1 = yes)
0.162
0.352
e
ln(Labor/hectare) (days/hectare)
0.040
ş0.124
e
ln(Oxen labor/hectare) (days/hectare)
0.199***
0.819*
e
Use of land management practices
Burning to prepare field
ş0.336***
ş0.728
e
Contour plowing
0.099
0.276
e
Reduced tillage
0.375***
1.571***
e
Intercropping/mixed cropping
ş0.043
ş0.048
e
Manure or compost
0.125*
0.628
e
Intercept
18.159***
11.231**
23.124***
Number of observations
1,160
1,020
1,340
R 2
0.4948
0.0735
0.3758
Note: Least-squares regressions. Coefficients and standard errors adjusted for sampling weights, clustering, and
stratification.
*, **, *** mean coefficient is statistically significant at 10 percent, 5 percent, and 1 percent levels, respectively.
aCoefficients of biophysical variables (annual rainfall, altitude, plot slope, position on slope, soil depth, soil color, soil
texture, and presence of gullies), plot area and how plot acquired not reported to save space. Full results available on
request.
bHausman test failed to reject OLS model (P = 1.000).
cVariables jointly statistically insignificant in full version of both OLS and IV models dropped from reported version of
IV model.
dVariable coefficient not estimable due to multicollinearity. Variable dropped in IV estimation.
eEndogenous variable excluded from reduced form.
only at the 10 percent level). Presence of a soil bund reduces the predicted return
to fertilizer. This may be because of weed or pest problems caused by the combina-
tion of these technologies.
Almost all of these impacts are robust to the regression specification. The im-
pacts of stone terraces, fertilizer, seed, ox labor, and reduced tillage are still statistically
and quantitatively significant in the IV model.28 Stone terraces also have a significant
positive impact on crop production in the reduced form specification.
126
JOHN PENDER AND BERHANU GEBREMEDHIN
Population pressure and farm sizes have a small and statistically insignificant
impact on crop production per hectare in all regressions, even though we found
that higher population density and smaller farm size promote greater use of some
inputs. Larger households attain lower crop yields (significant at the 10 percent
level). These findings do not support the Boserupian optimistic perspective about
the responses of households to population pressure leading to increased yields and
suggest that food production per capita will not keep pace with increasing popula-
tion as farm sizes decline because there is very little possibility to expand area under
crop production in the densely populated highlands of Tigray. Unless households
are able to depend on alternative livelihoods, food insecurity is thus likely to worsen
as population continues to grow.
Households with better access to a woreda town had higher values of crop pro-
duction, probably because of greater production of high-value products closer to
towns. For example, teff (the highest value cereal produced in Tigray) production is
negatively correlated with distance to the nearest woreda town (correlation = 0.12,
0.6 percent significance level).29
Most income strategies have an insignificant impact on crop production. One
exception is households dependent on food aid or other assistance, whose yields
are surprisingly significantly higher than those of other households. We also find
that households dependent on food aid and other assistance have higher incomes
per capita than cereals-only households (results for income discussed in the next
subsection). These findings may be related to a lack of targeting of food aid in
Ethiopia, as has been observed by other authors (Clay, Molla, and Habtewold
1999; Jayne, Strauss, and Yamano 2002; Barrett and Clay 2003; Gebremedhin and
Swinton 2003b).
We do not find a statistically significant effect of irrigation on the value of crop
production, other factors being equal. However, irrigation increases crop produc-
tion indirectly by increasing the use of inputs, including labor, oxen, fertilizer, and
improved seeds. Below, we estimate the impacts of these indirect effects of irriga-
tion and other factors.
Use of credit (formal or informal) is not associated with significant increases in
crop production, even though we found that formal credit promotes use of fertil-
izer. This is consistent with the fact that our evidence shows only limited impacts of
fertilizer on crop production. Contact with the agricultural extension program also
has insignificant impact on crop production.
Ownership of cattle other than oxen is associated with higher crop productivity.
This may be related to greater deposition of manure on plots operated by house-
holds owning more livestock (especially homestead plots).
AN ECONOMETRIC ANALYSIS IN THE HIGHLANDS OF TIGRAY
127
Female-headed households achieve 42 percent lower crop yields than male-
headed households with similar use of labor, ox power, and other inputs. Thus, not
only are female-headed households disadvantaged in terms of their ability to apply
inputs, but their productivity in using inputs is lower.
Households with members of a marketing cooperative attain substantially
higher output value per hectare, probably because they focus on higher-value crops
and have more timely availability of inputs. For example, members of marketing
cooperatives produce nearly three times as much teff (the highest value cereal in
Tigray), on average, as nonmembers.
Income. Many of the same factors that affect the value of crop production also
affect per capita income (Table 5.5). Households with better access to a woreda
town earn higher income (significant only in the IV regression), consistent with the
result that value of crop production is higher closer to towns. This result is consis-
tent with the findings of Kruseman, Ruben, and Tesfay in Chapter 4 that housing
quality (as measured by proportion of households with a metal roof) is better in areas
closer to markets. Households with more cattle (other than oxen) earn higher in-
come, whereas female-headed households earn significantly lower income per capita.
Members of a marketing cooperative earn significantly higher income than other
households (significant only in the OLS regression). Larger households earn less
income per capita. Population density, farm size, other assets, and access to credit
and extension have statistically insignificant impacts on per capita income.30
Households pursuing many types of income strategies earn higher incomes
than cereals-only producers. This includes households for whom cereals are a sec-
ondary income source and households whose secondary income source is cattle,
food-for-work or farm employment, salary employment, trading, other nonfarm
activities, and food aid or other assistance. In general, households with secondary
income sources earn higher income per capita than those solely dependent on cereal
production. The fact that households dependent on food aid or other assistance
earn higher incomes (excluding such aid as income) is consistent with the finding
discussed above that these households have higher crop yields and with the argu-
ment that food aid is not well targeted.
Direct and Indirect Effects on Production and Income
The predicted direct and indirect effects of changes in selected policy-relevant fac-
tors on crop production and per capita income are shown in Table 5.6. The factors
considered include increase in population density, improved access to an all-weather
road or to a woreda town, increased education, increased access to extension or formal
128
JOHN PENDER AND BERHANU GEBREMEDHIN
Table 5.5 Determinants of per capita income, 1998 (birr)
Variablea
OLS
IV
RF
Population density (persons/km2)
ş0.36
ş0.36
ş0.36
Female head of household
ş108.76*
ş110.82**
ş106.23*
Age of household head (years)
ş0.02
b
0.58
Household size (number)
ş74.27***
ş71.14***
ş73.78***
Education of household head (cf. <3 years)
3+ years
101.15
b
93.70
Literacy campaign
185.11*
173.50
175.5*
Walking time to (hours)
All weather road
ş7.96
b
ş9.41
Woreda town
ş20.53
ş25.83**
ş19.76
Plot from residence
59.00
b
66.42
Ownership of assets
Land (hectares)
24.58
b
21.86
Oxen (number)
6.55
b
3.18
Other cattle (number)
12.48*
18.63**
15.15**
Small ruminants (number)
ş0.39
b
ş0.50
Pack animals (number)
27.30
b
24.49
Radio (yes/no)
49.55
b
47.38
Cash savings (yes/no)
30.45
b
19.12
Secondary income source (cf. none)
Cereals
213.10**
272.38***
256.72***
Perishable annuals
ş93.50
ş99.15
ş90.61
Perennial crops
84.36
103.78
85.10
Cattle
127.20**
148.49**
135.16**
Small ruminants/beekeeping
372.22
425.59*
411.00
Food-for-work/farm employment
200.80***
191.54***
202.78***
Salary employment
251.63***
241.93***
267.01***
Trading
149.20*
243.32*
206.37**
Food/other assistance
313.93**
344.18***
327.76**
Other nonfarm
152.63**
178.41***
159.38**
Contact with extension
32.00
b
c
Membership in organizations
Tabia council
ş223.03
b
c
Village council
ş64.58
b
c
Marketing cooperative
195.92**
ş137.19
c
Agricultural cadre
14.31
b
c
Use of credit
Formal credit
ş13.32
b
c
Informal credit
ş38.48
b
c
Land use (cf. rain-fed plots) (proportion of area)
Homestead plots
ş28.15
ş57.74
ş33.39
Irrigated plots
151.72
229.14
194.61
Initial investment on plot in 1998 (proportion of area)
Stone terrace
93.10
89.32
93.72
Soil bund
73.16
76.09
89.23
Fence (live or constructed)
ş107.32
ş39.94
ş94.29
Intercept
662.32*
851.47***
658.51**
AN ECONOMETRIC ANALYSIS IN THE HIGHLANDS OF TIGRAY
129
Table 5.5 (continued)
Variablea
OLS
IV
RF
Number of observations
436
425
436
R 2
0.2604
0.2129
0.2445
Note: Least squares regressions. Coefficients and standard errors adjusted for sampling weights, clustering, and strat-
ification. The Hausman test result was inconclusive (negative test statistic).
*, **, *** mean coefficient is statistically significant at 10 percent, 5 percent, and 1 percent levels, respectively.
aCoefficients of biophysical variables (annual rainfall, altitude, plot slope, position on slope, soil depth, soil color, soil
texture, and presence of gullies); how plot acquired not reported to save space. Full results available upon request.
b Variables jointly statistically insignificant in full version of both OLS and IV models dropped from reported IV model.
cEndogenous variable excluded from reduced form.
credit, increased participation in marketing cooperatives, investment in irrigation
or stone terraces, or increased ox or cattle ownership.
Participation in marketing cooperatives has the largest predicted impacts on
both crop production and income, increasing both by more than 40 percent.
Investment in stone terraces also has relatively large and positive predicted impacts
on both crop production and income (around 14 percent), though the impacts on
income are statistically insignificant. Improved access to a woreda town (by up to
one hour walking time) is predicted to increase both the value of crop production
and income by about 5ş6 percent. Increased ownership of cattle (by one cow) also
is predicted to increase crop production and income moderately. All of these
scenarios represent possible "win-win" outcomes, increasing both productivity and
incomes.
Many of the changes considered have relatively small (less than 5 percent
change) and statistically insignificant predicted quantitative effects on crop pro-
duction and income. This includes the influences of population growth (10 per-
sons/km2 increase), improved access to an all-weather road (up to one hour closer),
universal access to formal credit, and increased ox ownership (by one ox). Some of
the changes have quantitatively large but statistically insignificant effects, including
investment in primary education (large positive influences on both crop production
and income), extension (negative effect on crop production but positive effect on
income), and irrigation (small effect on crop production but large influence on in-
come). However, given the statistical insignificance of the coefficients on which these
predicted influences are based, not too much should be made of their magnitudes.
These results suggest that the most promising investments for increasing agri-
cultural productivity and incomes in the highlands of rural Tigray are in marketing
institutions, improved access to markets, in soil and water conservation measures
such as stone terraces, and in cattle (other than oxen). Investments in roads, extension,
Table 5.6 Simulated impacts of changes in selected variables on value of crop production and per capita income
Value of crop production
Per capita income
Mean of selected variable
(plot level) (percentage)
(percentage)
Variable
Scenario
Before change
After change
Direct effects
Total effects
Direct effects
Total effects
Population density (persons/km2)
10 persons/km2 increase
137
147
ş0.1
+0.4
ş1.0
ş1.1
Access to all-weather road (hours walking)
Maximum 1 hour closer
2.3
1.3
ş1.4
ş1.2
+1.7
+2.8
Access to market town (hours walking)
Maximum 1 hour closer
3.5
2.5
+5.5**
+6.8R
+5.3++
+5.6
Primary education (proportion of household heads)
Minimum 3 years for household
0.06
0.92
+12.0
+17.6
+23.4
+23.4
heads with less
Access to extension (proportion of household)
Universal access
0.11
1.00
ş11.1*
ş14.0
+7.6
+7.6
Access to formal credit (proportion of household)
Universal access
0.58
1.00
+2.0
+3.9
ş1.5
ş1.5
Participation in marketing cooperative (proportion
Universal participation
0.06
1.00
+33.7***
+45.5
+48.7**
+48.7
of household)
Irrigation (proportion of plots)
All rain-fed plots irrigated
0.07
0.80
ş10.7
ş1.2
+25.8
+19.0
Stone terraces (proportion of plots)
All plots terraced
0.37
1.00
+13.6***+++
+13.8R
+14.5
+14.5
Oxen ownership (number owned)
1 additional ox owned
1.1
2.1
ş4.2
ş2.4
+1.8
+1.8
Other cattle ownership (number owned)
1 additional animal owned
2.7
3.7
+5.4***+
+6.2R
+3.3*++
+3.3R
Note: Values are percentage change in mean predicted values. Simulation results for direct effects based on predictions from OLS model regressions reported in Tables 5.4 and 5.5. Results of OLS
and probit regressions predicting input use and land management practices were used to predict indirect effects on crop production. Results of probit regressions for determinants of use of credit,
participation in extension, and organizations used to predict indirect effects on income.
*, **, *** mean direct effect is based on a coefficient that is statistically significant in the OLS regression at 10 percent, 5 percent, or 1 percent level, respectively.
+, ++, +++ and ş, ş ş, ş ş ş mean direct effect is of the sign shown and statistically significant in the IV regression at 10 percent, 5 percent, or 1 percent level, respectively.
RCoefficient is of the same sign and statistically significant at 5 percent level in the reduced form regression.
AN ECONOMETRIC ANALYSIS IN THE HIGHLANDS OF TIGRAY
131
and credit are of less clear benefit. The effects of education may be large and positive,
though we cannot be confident of its influence based on our results.
Key Findings and Implications
Here we summarize key findings with regard to our hypotheses and their implica-
tions. The qualitative findings are summarized in Table 5.7.
Population Pressure
Population pressure, as reflected by higher population density, is associated with
more intensive use of labor, ox power, fertilizer, and intercropping. Smaller farms
are also more likely to use fertilizer on a given plot and less likely to use reduced
tillage. These findings are consistent with the predictions of population-induced
intensification, as hypothesized by Boserup (1965) and her followers. However, in-
creased farming intensity in more densely populated areas was not found to lead to
significantly higher crop yields. In addition, population pressure at the household
level, in terms of larger household size, is associated with lower yields and lower
income per capita. These findings suggest that population growth, larger house-
holds, and smaller farm sizes will lead to reduced food production and income
per capita because options for expanding crop production onto new land are very
limited in the highlands of Tigray. The negative implications of population pres-
sure are consistent with findings of other recent studies in the Ethiopian highlands
(Grepperud 1996; Pender et al. 2001a).
Access to Roads and Markets
Better access to an all-weather road contributes to more intensive use of labor, fer-
tilizer, burning, and contour plowing. However, we find little impact of better road
access on the value of crop production or income. This probably is because even in
areas with relatively better road access, most households are still quite far from
roads and rely primarily on walking and donkeys to transport commodities and
inputs. The impacts of improved road access are quite limited in such a setting.
Households with better access to a woreda town use more ox draft power
but less contour plowing and obtain higher values of crop production and higher
per capita income than households in more remote locations (though impact on per
capita income was significant only in IV regression). In contrast to road access,
access to even small urban markets makes a difference for rural livelihoods.
Income Strategies
As expected, different income strategies are associated with differences in input use
and land management practices. For example, households having several types of
Table 5.7 Summary of qualitative empirical results
Labor
Capital intensity
Value of crop
Per capita
Factor
intensity
(oxen, purchased inputs)
Land management practices
production
income
Population pressure
Population density
+
+ oxen, fertilizer
+ intercropping
0
0
Smaller farm size
0
+ fertilizer
ş reduced tillage
0
0
Household size
0
0
0
0
ş
Access to roads
+
+ fertilizer
+ burning, contour plowing
0
0
Access to markets
0
+ oxen
ş contour plowing
+
0
Income strategies
Cattle
ş
ş oxen
ş burning
0
+
Nonfarm
0
ş oxen
+ reduced tillage
0
+
High-value crops
0
+ improved seeds
+ reduced tillage
0
0
Food-for-work/farm work
ş
ş oxen, + improved seeds
0
0
+
Food/other aid
0
ş oxen
ş manure, burning, intercropping
+
+
Irrigation
+
+ oxen, improved seed
+ reduced tillage
0
0
Credit
0
+ improved seed
0
0
0
Extension
0
0
0
0
0
Physical capital
0
Oxen
+
+ oxen
+ manure, contour plowing, ş reduced tillage
0
0
Other cattle
0
+ seeds, fertilizer
+ burning
+
+
Small ruminants
ş
ş oxen, seeds
şburning, intercropping
0
0
Human capital
Primary education
+
0
0
0
0
Female head
ş
ş oxen
ş manure
ş
ş
Financial capital (savings)
0
+ fertilizer
ş manure
0
0
Natural capital
Stone terrace
0
+ fertilizer
+ contour plowing
+
0
Soil bund
0
0
+ burning
0
0
Social capital
Village council
+
+ improved seed
+ manure, intercropping
0
0
Marketing cooperative
0
0
ş burning
+
0
Note: + Positive (ş negative) and statistically significant impact (5 percent level) in at least one specification and significant at 10 percent level in two specifications. 0 impact not statistically
significant and robust.
AN ECONOMETRIC ANALYSIS IN THE HIGHLANDS OF TIGRAY
133
noncrop income use labor and ox draft power less intensively than cereals-only pro-
ducers, whereas producers of perennials and perishable annuals are more likely to
use improved seeds. Despite such differences in cropping practices, we find no sig-
nificant difference among most income strategies in value of crop production,
except (surprisingly) households dependent on food aid and other assistance, which
have higher crop production. These aid-dependent households also earn higher
income per capita than cereals-only households (suggesting lack of targeting of
food aid and other assistance), as do households pursuing many other income
strategies. In general, households with more diversified income sources have higher
incomes per capita.
Irrigation
As expected, irrigation increases the intensity of input use in crop production,
including labor, ox power, fertilizer, and improved seeds. Surprisingly, however,
we do not find that irrigation contributes to higher value of crop production or
income, even after accounting for the indirect effects of increased intensity of pro-
duction. There are many problems affecting the performance of small-scale irriga-
tion in Tigray, including problems of inadequate access to irrigation water when
needed, salinity buildup as a result of seepage and poor drainage, lack of experience
in using irrigation, and other factors (Tesfay et al. 2000). These problems are cer-
tainly limiting the potential of small-scale irrigation in Tigray. But our inability to
identify an independent effect of irrigation may also be caused by multicollinearity
and an inadequate sample of irrigated plots.31 We have a relatively small sample of
irrigated plots in our sample (91 plots), and irrigation is correlated with other plot
quality factors, especially plot size. Further research on the influence of small-scale
irrigation in Tigray and the policy, institutional, and technical factors affecting its
effectiveness, is needed.
Agricultural Extension and Credit
The agricultural extension and credit program has sought to boost productivity
largely by promoting use of fertilizer and improved seeds. The evidence presented
shows some influence of fertilizer use on crop production (though the impact is
statistically weak and not robust), increasing predicted value of production by 250
EB/hectare on average, other factors remaining constant. This yield increase is
insufficient to cover the average costs of fertilizer (about 280 EB/hectare in 1998),
indicating that fertilizer use was unprofitable on average and explaining why farmers
are reluctant to adopt it, despite substantial efforts to promote its use. In a semiarid
environment as in the highlands of Tigray, use of fertilizer can be risky as well as
unprofitable if adequate soil moisture cannot be assured. Given the heavy emphasis
134
JOHN PENDER AND BERHANU GEBREMEDHIN
of the agricultural extension and credit program on promoting fertilizer use at the
time of the study, it is not surprising that these programs were found to have little
influence on crop production and income.
Although the return to fertilizer is low, there are indigenous technologies with
potential to substantially increase crop yields. Stone terraces increase crop produc-
tivity by an estimated 23 percent. Because stone terraces help to conserve soil mois-
ture, they also increase the benefit of using fertilizer, which is probably why we find
more fertilizer adoption on plots that have stone terraces. The estimated average
rate of return to stone terraces is 46 percent, based on the predicted increase in
annual value of crop production and our data on costs of constructing these ter-
races. This is comparable to the estimated rate of return to stone terraces in south
central Tigray by Gebremedhin, Swinton, and Tilahun (1999), who estimated a 50
percent rate of return to stone terraces, and shows that investment in stone terraces
is fairly profitable in Tigray. Several other low external input land management
practices, including application of manure and compost, reduced tillage, and no
burning also could have substantial impacts on crop productivity. Promotion of such
technologies by the extension program could yield greater benefits than the emphasis
on fertilizer and improved seeds.
Endowments of Physical, Human, and Social Capital
Livestock ownership significantly influences land management. Households that
own more oxen use more ox draft power, are more likely to use contour plowing
and to apply manure, and are less likely to use reduced tillage. Despite these dif-
ferences, we find no significant differences in crop production or income per capita
resulting from differences in ox ownership, suggesting that informal arrangements
to share or lease oxen work relatively well in Tigray. Thus, although ox draft power
is a critical component of the farming system in northern Ethiopia (some argue
it is the most critical component), and most households are not able to own as
many oxen as desired (Bauer 1977; Amare 1995, 2003; McCann 1995), many
households are able to overcome this constraint through ox-sharing arrangements,
especially between households owning only one ox (e.g., Amare 1995), and house-
holds without any oxen will often sharecrop out their land. Ownership of other
cattle is associated with greater use of seed and fertilizer, perhaps because this helps
to relax financial constraints. Households with more cattle (other than oxen)
obtain higher yields and incomes, supporting Aune's (Chapter 12 of this volume)
argument that milking animals are more profitable than oxen in the highlands of
Ethiopia. Ownership of small ruminants appears to reduce intensity of crop pro-
duction; small ruminants are associated with less use of labor, ox power, burning,
and intercropping.
AN ECONOMETRIC ANALYSIS IN THE HIGHLANDS OF TIGRAY
135
Primary education is associated with more intensive use of labor, though the
reason for this is not clear. We find generally insignificant impacts of education on
other aspects of land management, crop yields, and income, probably because of the
generally low levels of education among all households in the sample. By contrast,
gender is very important in affecting land management and outcomes. Female-
headed households use much less labor and ox power, are less likely to apply
manure, and obtain substantially lower crop yields and incomes than male-headed
households. A cultural taboo against women using oxen for plowing is one factor
disadvantaging female-headed households. Moreover, women are not usually in-
cluded in agricultural extension programs. Priority should be given to promoting
changes in such attitudes as well as assisting female-headed households to pursue
alternative livelihoods.
Some forms of social capital, as measured by involvement in local organiza-
tions, have a significant influence on crop production. Members of a village council
farm with greater labor intensity and are more likely to use improved seeds, manure,
and intercropping than other households. Members of a marketing cooperative use
less burning and attain substantially higher value of crop production per hectare,
probably because they focus on producing higher-value crops and/or have better
access to input and output markets than other farmers.
Conclusions
We have investigated the impacts of many factors commonly hypothesized to affect
land management and agricultural productivity in the highlands of Tigray. Some of
these factors, including population pressure, small landholdings, access to roads,
irrigation, and extension and credit programs, have weaker influences on agricul-
tural production and incomes than often hypothesized. Most of these factors do
affect the intensity of agricultural production and adoption of various land man-
agement practices. However, these effects on intensity do not add up to much
influence on total crop production, in part because of the low marginal product of
labor in crop production and limited productivity effect of inputs such as fertilizer
that have been promoted by some of these factors.
Some land management practices were found to substantially increase crop
production, including construction of stone terraces, reduced burning, and reduced
tillage. These practices possibly contribute to productivity by helping to conserve
soil moisture and organic matter. Greater ownership of cattle (other than oxen)
is also strongly associated with increased crop productivity, probably as a result of
increased manure availability, and higher income. Promotion of such conservation
practices and exploitation of complementary livestock production show more
136
JOHN PENDER AND BERHANU GEBREMEDHIN
promise to boost crop production and incomes than large application of modern
inputs such as inorganic fertilizer and improved seeds. However, there do appear to
be opportunities to exploit complementarities between use of such inputs (espe-
cially fertilizer) and investment in stone terraces.
Livelihood diversification is a key to reducing poverty in the highlands of Tigray
because of population pressure and the low productivity of land. Households that
focus only on cereal production earn significantly lower incomes than households
having more diversified income sources, including livestock, off-farm employment,
and nonfarm activities.
Special attention to the problems of female-headed households is needed. Efforts
to change attitudes about women plowing, enhance their farming skills, and to
promote alternative livelihoods for women are needed to address the low levels of
agricultural productivity and income of this vulnerable group.
Overall, the findings of this study show that profitable opportunities exist to
increase agricultural production and incomes and to achieve more sustainable land
management in the highlands of Tigray. These opportunities include improvement
of crop production using low-external-input investments and practices such as ter-
races, reduced tillage, and reduced burning and improved livestock management.
The comparative advantage of people in the Tigray highlands appears not to be in
input-intensive cereal crop production but more in low-external-input technologies
and alternative livelihood activities, such as livestock raising and nonfarm activities.
As a result, greater emphasis on developing these alternatives in agricultural exten-
sion and other development programs is needed. Food crop production should not
be ignored in the development strategy, especially if more drought-resistant vari-
eties can be developed, but more prudent use of external inputs such as fertilizer
and improved seeds, and greater emphasis on low-external-input sustainable land
management practices would be helpful.
Notes
1. There is considerable variation in estimates of the size and impacts of soil erosion and
other forms of land degradation in the Ethiopian highlands, causing controversy about the exact
magnitude of these impacts (FAO 1986; Hurni 1988; Hurni and Perich 1992; Sutcliffe 1993; B÷jo
and Cassells 1995; Kappel 1996; Sonneveld 2002). For example, the Ethiopian Highlands Recla-
mation Study (FAO 1986) estimated an average rate of soil loss of 35 tons per hectare per year in the
highlands, with much higher rates on cultivated land (130 tons/hectare per year), leading to a pre-
dicted loss of 7.6 million hectares of productive cropland and a loss of 2.6 million tons of annual
crop production by the year 2010. Hurni (1988) estimated much lower rates of soil erosion, averag-
ing 42 tons/hectare per year on cropland but reaching as high as 300 tons/hectare per year on some
steeply sloping lands, based on measurements of soil erosion taken at several sites throughout the
highlands under the Soil Conservation Research Project (SCRP). Studies in specific locations in
AN ECONOMETRIC ANALYSIS IN THE HIGHLANDS OF TIGRAY
137
Tigray have also estimated high average but widely varying rates of erosion (Eweg, van Lammeren,
and Yifter 1997; Hengsdijk, Meijerink, and Mosugu 2005) and soil nutrient depletion (Abegaz
2005). Hurni and Perich (1992) estimated that Tigray's soils have lost 30ş50 perecnt of their origi-
nal productive capacity as a result of land degradation. Subsequent studies have argued that both
FAO's and Hurni's estimates overstate the impact of soil erosion because they do not account for
deposition of eroded soils elsewhere in the landscape (Sutcliffe 1993; B÷jo and Cassells 1995).
Based on assumptions about the amount of soil deposition and the influence of net soil loss on pro-
ductivity, B÷jo and Cassells estimated the cumulative gross discounted economic losses caused by
soil erosion in the Ethiopian highlands to be between EB 3 billion and EB 7 billion, and Kappel
(1996) estimated these losses to be somewhat larger ($1.25 billion). Considering the value of soil
nutrients lost via burning of dung and crop residues, B÷jo and Cassells estimated that the dis-
counted economic losses through nutrient depletion were even greater than those from erosion (EB
8 billion). Regardless of the variation in estimates, there seems little dispute that land degradation
and its costs are severe in many locations in the Ethiopian highlands, though these vary greatly
across locations and land uses (Keeley and Scoones 2004; Nyssen et al. 2004).
2. Highlands were defined to include areas at or above 1,500 meters above sea level.
3. This empirical model is based on a theoretical dynamic household model that is presented
in Nkonya et al. (2004).
4. In the econometric work, we use dummy variables for whether the household applied fer-
tilizer or improved seeds, rather than the quantities of these inputs, because of zero values of these
inputs for many households, making it difficult to account for the amount of use in a logarithmic
production function as estimated in this chapter.
5. We did not estimate separate production functions for each crop produced in order to
simplify the analysis because that would result in much smaller sample sizes for each crop (hence
reduced statistical power) and because intercropping or mixed cropping cannot be modeled with
single-output production functions. The revenue function is an aggregation of production and local
price functions and hence depends on the variables that influence both production and prices. That
is, if production of crop i on plot p depends on a vector of inputs and biophysical conditions (X )
p
according to the production function f (X ), and the farm level price of crop i depends on a vector
i
p
of conditions related to market access and household-level transaction costs and marketing abilities
(Z ) according to the relationship p (Z ), then revenue from plot p of household h is equal to
h
i
h
p (Z )f (X ), which we define as the revenue function y (Z , X ).
i
h i
p
h
p
6. If labor effort and other inputs are measured perfectly, these effects would be reflected in
the effects of these inputs on production. However, if they are measured imperfectly, tenure may
have a greater influence on productivity.
7. Fewer than 3 perecnt of households in our sample changed their primary source of
income between 1991 and 1998, and only one-fifth changed their secondary income source.
8. We do not include other, more variable factors such as ownership of physical assets as
determinants of participation in programs or use of credit because these may not be predetermined
relative to decisions about participation or credit use, which may have occurred before the current
year.
9. For example, in the income regression, we use share of farmland of different tenure, slope,
and soil type classes.
10. Members of agricultural cadres are supposed to be innovative farmers who are contact
farmers for technical assistance programs.
11. Pasture, woodlots, and fallow plots were excluded from the analysis.
138
JOHN PENDER AND BERHANU GEBREMEDHIN
12. Except where noted, the results discussed below are statistically significant at the 5 percent
level in at least two of the specifications.
13. Normal IV estimation requires a continuous uncensored dependent variable, which we do
not have in the case of the land management regressions. Instrumental variables estimation
approaches have been developed for probit models (e.g., Smith and Blundell 1986; Blundell and
Smith 1989), but these approaches assume that the endogenous explanatory variables are continu-
ous uncensored variables, or that they are continuous, uncensored latent variables (Maddala 1983).
Neither assumption holds in our models.
14. These regression results are available on request.
15. The maximum variance inflation factor was less than five in all cases (except when pre-
dicted values of explanatory variables were used, in which case multicollinearity was a problem).
16. The method used to predict direct and indirect influences is explained fully in Nkonya et al.
(2004).
17. As a result of the predominant risti land tenure system that existed in northern Ethiopia
before the 1975 land reform (which also involved periodic land redistribution and prohibited land
sales and mortgages), land ownership was not greatly unequal in most places even before 1975 (Bruce,
Hoben, and Rahmato 1994).
18. The official exchange rate averaged about 7 EB per U.S. dollar in 1998.
19. Remittance income from family members residing elsewhere accounted for less than
1 percent of household income of our sample households. This is consistent with Bauer's (1977)
description of a high degree of individualism in Tigray society.
20. In Tigray, adults are required to contribute 20 days per year to community labor mass-
mobilization campaigns, which are used to construct conservation measures, plant trees, build
roads, and for other activities (Hagos, Pender, and Gebreselassie 1999). During the 1980s up to four
months of such labor contribution was expected, but this was reduced to 20 days in 1992 (Hagos,
Pender, and Gebreselassie 1999).
21. To compute the value of production, we used average prices in Tigray based on community-
and household-level surveys. We were not able to compute value of production using local prices
because of a limited number of observations for many crops. Thus, the data represent a weighted
production index, where regional prices are used to weight production of different crops and do not
reflect local variation in prices.
22. In Chapter 4, Kruseman, Ruben, and Tesfay found that higher population density is asso-
ciated with a greater proportion of households who use fertilizer and pesticides and a smaller propor-
tion who use fallow.
23. Kruseman, Ruben, and Tesfay found a positive impact of road access on fertilizer use in
Chapter 4.
24. This contrasts with the results in Chapter 4, in which the presence of irrigation institutions
was positively but not significantly correlated with the proportion of households using inputs such
as fertilizer and improved seeds; this may reflect weaker statistical power of community survey results
to explain household- and plot-level technology adoption.
25. Again, the relationship between formal credit and use of fertilizer and improved seed was
positive but not statistically significant in Chapter 4.
26. The prohibition against women plowing and threshing is a long-standing one that, accord-
ing to Bauer (1977), is based on "an indigenous theory that their participation in these activities
would decrease the amount of crops produced" (Bauer 1977, p. 98). These attitudes may be chang-
ing in Tigray as some female-headed households have had the need and courage to challenge such
AN ECONOMETRIC ANALYSIS IN THE HIGHLANDS OF TIGRAY
139
norms, though this can be difficult, and such women may be subject to ridicule or intimidation
(Abay et al. 2001).
27. Because of the logarithmic specification for the dependent variable, the predicted impact
of stone terraces using the OLS specification is exp(0.206) = 1.229, or a 23 percent increase.
28. The Hausman test failed to reject the OLS model (P = 1.000), so the OLS model is the
preferred model.
29. In Chapter 4, Kruseman, Ruben, and Tesfay also found greater production of teff closer to
markets.
30. These results contrast with the findings of Kruseman, Ruben, and Tesfay in Chapter 4
that higher population density is associated with better housing quality. That finding may reflect the
influence of household-level variables that are correlated with income and wealth and may also be
correlated with population density, such as education, which are included as explanatory variables
in our analysis but were not controlled for in their analysis. Consistent with this explanation, Kruse-
man, Ruben, and Tesfay found that indicators of education were greater in more densely populated
communities.
31. Recall that the value of crop production per hectare was much higher on irrigated plots
than on rain-fed or homestead plots in our descriptive analysis. Such differences are not found in
the econometric analysis when plot size and land quality indicators are included.
C h a p t e r 6
Policies for Livestock Development
in the Ethiopian Highlands
Samuel Benin, Simeon Ehui, and John Pender
Livestock have diverse functions for the livelihood of farmers in mixed crop-
livestock systems in the highlands of East Africa. Livestock provide food in
the form of meat and milk, nonfood items such as draft power, manure, and
transport services as inputs into food crop production, and fuel for cooking. Live-
stock are also a source of cash income through sale of the above items, animals,
hides, and skins. Furthermore, they act as a store of wealth and determine social
status within the community. Because of these important functions, livestock play
an important role in improving food security and alleviating poverty. Because they
are central to nutrient cycling, livestock are important to the efficiency, stability, and
sustainability of farming systems in the East African highlands (Ehui et al. 1998).
The International Livestock Research Institute (ILRI) and its partners and collabo-
rators have shown that securing the current and future livestock assets of the poor
is a major pathway to get the rural poor out of the poverty spiral (ILRI 2002).
In Ethiopia, livestock contribute about 30 to 35 percent of agricultural gross
domestic product (GDP) and more than 85 percent of farm cash income. They
also contribute about 13 to 16 percent of total GDP. Between 1987ş88 and
1995ş96, the share of livestock in total exports averaged 16 percent (Degefe and
Nega 2000).1 Ethiopia has the largest livestock population in Africa, which poten-
tially plays an important role in improving food security and alleviating poverty in
the region as a whole and in Ethiopia in particular. However, performance in the
production of the main food commodities of livestock origin in Ethiopia has been
poor compared to other African countries, including neighboring Kenya (Degefe
142
SAMUEL BENIN, SIMEON EHUI, AND JOHN PENDER
and Nega 2000). Inadequate feed and nutrition, widespread diseases and poor
health, poor breeding stock, and inadequate livestock policies with respect to credit,
extension, marketing, and infrastructure have been cited as major constraints
affecting livestock performance (Degefe and Nega 2000; Desta et al. 2000), lead-
ing to severe losses in times of drought (Webb, von Braun, and Yohannes 1992;
Ndikumana et al. 2000).
In 1991, when the present federal government of Ethiopia came to power, it
launched, in addition to market liberalization, the Agricultural Development Led
Industrialization (ADLI) strategy to improve the productivity of the agricultural
sector within the framework of transforming the entire economy such that the
relative contributions of agriculture, industry, and services to economic growth
would shift significantly in favor of the latter two over time. Improving the live-
stock subsector is duly recognized, as the development strategy seeks to (1) enhance
the quality and quantity of feed by allocating sites for grazing, providing improved
animal feed, and improving extension services to farmers; (2) increase livestock
health service coverage and improve vaccination sites; and (3) improve productivity
of local cows by artificial insemination but also preserve and improve indigenous
breeds (BOA 1999a).
From a survey conducted in 1999 and 2000 in the highlands of the Amhara
region in northern Ethiopia to examine the development of the livestock subsector
since 1991, when ADLI was launched, we find that there have been significant
changes in utilization of feed resources: although use of communal grazing lands,
private pastures, woodlots, and forest areas as feed sources has declined, use of crop
residues and purchased feed has increased. In addition, availability and quality of
grazing lands have declined. Furthermore, as use of animal health services and
adoption of improved livestock breeds and modern management practices (e.g.,
artificial insemination, stall feeding, and fattening) have increased, ownership of
various types of livestock has declined. These changes may not be a matter of con-
cern if they resulted from the rapid expansion of the crop sector or nonfarm sector
to make farmers better off. However, data from the same survey and another one
conducted in the Tigray region show that there has been little change in livelihood
strategies in the northern Ethiopian highlands. Agricultural and crop-livestock
production continue to dominate income sources, and several welfare conditions
(including average wealth, availability of food, and nutrition of children) have
worsened since 1991 (Pender et al. 2001a). The contribution of agriculture to the
national economy has remained fairly stable: its share of GDP averaged 53 percent
between 1980 and 1991 and 51 percent between 1991 and 1998 (Degefe and
Nega 2000), and it employed 86 percent and 82 percent of the labor force in 1990
and 2000, respectively (FAO 2002). Average cereal yield was stagnant, and the
LIVESTOCK DEVELOPMENT IN THE ETHIOPIAN HIGHLANDS
143
incidence of poverty declined only slightly (4.4 percent) in rural areas between
1995 and 2000 (Woldehanna and Alemu 2002).2 On the other hand, other changes
in the national political economy during that period, including, for example, the
implementation of the massive agricultural package program leading to substantial
increases in the cultivated area under chemical fertilizers and improved seeds, con-
tinuing the policy of land redistribution especially in the Amhara region (see Chap-
ter 9 for further discussion), the recurrent drought situation, and rapid population
growth, may have affected farm-livestock dynamics and livestock investment deci-
sions and caused the observed changes in the livestock subsector.
The objective of this chapter is to determine the factors that have contributed
to the above changes in the livestock subsector in the mixed cropşlivestock farming
systems in the Ethiopian highlands in order to increase our knowledge of the effect
of changes in the socioeconomic and policy environment on livestock keeping and
provide information for policy discussions on the use of livestock to get rural people
out of the poverty trap. This chapter focuses on the effects on livestock develop-
ment of similar factors to those considered in Chapters 3, 4, and 5--including
agricultural potential, market access, population pressure, and credit--as well as
other factors, such as land tenure policies. However, this chapter is significantly dif-
ferent from other chapters in this book in focusing mainly on livestock development
and taking a dynamic perspective, considering factors affecting changes in livestock
ownership and use of various management practices and technologies. Thus, this
chapter is complementary to other chapters in the book, adding a substantially dif-
ferent dimension.
The rest of this chapter is organized as follows. The next section describes the
data and then examines trends since 1991 in ownership of various types of live-
stock, use of livestock feed resources and animal health services, and adoption of
improved breeds and modern management practices. The third section presents the
empirical framework for analyzing the factors contributing to the trends. Results
and discussion are presented in the fourth section, and conclusions and implications
are drawn in the fifth.
Data
This research is based on a community-level survey conducted in 98 villages in the
Amhara region of northern Ethiopia in 1999ş2000, very similar to the community
survey conducted in Tigray that was analyzed in Chapter 4. A stratified random
sample of 49 peasant associations (PAs)3 was taken, and two villages were ran-
domly selected from each PA from highland areas (above 1,500 meters above sea
level) of the region. Using woreda (district) level secondary data, the stratification
144
SAMUEL BENIN, SIMEON EHUI, AND JOHN PENDER
was based on indicators of agricultural potential (whether or not the woreda is
drought-prone, as classified by the Ethiopian Disaster Prevention and Preparedness
Committee), market access (access or no access to an all-weather road), and popu-
lation density (1994 rural population density greater than or less than 100 persons
per square kilometer). Two additional strata were defined for PAs where an irriga-
tion project is present (in drought-prone vs. higher-rainfall areas), resulting in a
total of 10 strata. Five PAs were then randomly selected from each stratum (except
the irrigated drought-prone stratum, in which there were only four PAs), for a total
of 49 PAs and 98 villages. Woredas predominantly (more than 50 pecent of total
area) below 1,500 meters above sea level were excluded from the sample frame.
Information was collected at both PA and village levels using group interviews
with about 10 respondents from each PA and village, selected to represent different
genders, ages, occupations, and, in the PA-level survey, different villages. Informa-
tion collected include perceived changes in use of various feed resources, adoption
of improved livestock technologies and management practices, and ownership of
livestock since 1991 (the year when the current government replaced the former
Marxist government). The data were supplemented by secondary information on
population from the 1994 population census, geo-referenced maps of the bound-
aries of each sample PA, and geographic attributes, including altitude and climate.
Trends since 1991 in the Livestock Subsector in Amhara Region
The Amhara region is located in the northwestern part of Ethiopia. The region
covers about one-eighth of the total area of the country and is home to about 27 per-
cent of the total human population (Degefe and Nega 2000) and 35 percent of the
total livestock population (BoA 1999b).4 In the region, livestock and human popula-
tions are concentrated in the highland areas, which constitute about 66 percent of the
total area (BoA 1999b). Historically, human and livestock settlements have concen-
trated in the highland areas, especially in the range of 2,300ş3,200 meters above
sea level (dega agroecological zone), because of the relatively good rainfall reliability,
cool temperatures, and absence of diseases (e.g., malaria and trypanosomosis).
From the survey conducted in the region, household ownership of livestock
has generally declined between 1991 and 1999, with the percentage decrease being
larger in drought-prone areas compared to higher-rainfall areas (Table 6.1). The only
exception to the declining trend is ownership of donkeys, which increased only
slightly, particularly in higher-rainfall areas. Community respondents revealed that
a combination of loss to drought and diseases and sale during crop failure were the
major causes for the declining ownership of livestock. Recurrent drought (late rains
or failure of main and small rains) is a common phenomenon in Ethiopia, espe-
cially in the central and northeastern highlands, stretching from northern Shewa
LIVESTOCK DEVELOPMENT IN THE ETHIOPIAN HIGHLANDS
145
Table 6.1 Proportion of households owning livestock, by agricultural potential
Sample mean
Livestock
Location
1991
1999
Percentage change
Oxen
All communities
0.73
0.59
ş19
Drought-prone areas
0.71
0.41
ş42
Higher-rainfall areas
0.75
0.73
ş3
Cows
All communities
0.46
0.30
ş35
Drought-prone areas
0.50
0.28
ş44
Higher-rainfall areas
0.43
0.31
ş28
Heifers
All communities
0.34
0.20
ş41
Drought-prone areas
0.35
0.16
ş54
Higher-rainfall areas
0.33
0.22
ş33
Bulls
All communities
0.33
0.18
ş46
Drought-prone areas
0.37
0.15
ş60
Higher-rainfall areas
0.29
0.20
ş31
Calves
All communities
0.35
0.20
ş43
Drought-prone areas
0.39
0.17
ş56
Higher-rainfall areas
0.32
0.22
ş31
Sheep
All communities
0.38
0.25
ş34
Drought-prone areas
0.47
0.21
ş55
Higher-rainfall areas
0.31
0.28
ş10
Goats
All communities
0.28
0.15
ş46
Drought-prone areas
0.36
0.13
ş64
Higher-rainfall areas
0.22
0.16
ş27
Donkeys
All communities
0.32
0.36
13
Drought-prone areas
0.33
0.32
ş3
Higher-rainfall areas
0.31
0.40
29
Horses
All communities
0.09
0.08
ş11
Drought-prone areas
0.10
0.05
ş50
Higher-rainfall areas
0.09
0.10
11
Mules
All communities
0.08
0.05
ş38
Drought-prone areas
0.12
0.07
ş42
Higher-rainfall areas
0.05
0.04
ş20
Poultry
All communities
0.61
0.56
ş8
Drought-prone areas
0.80
0.70
ş13
Higher-rainfall areas
0.48
0.47
ş2
Note: Sample means are adjusted for stratification, weighting, and clustering of sample.
through Wello into Tigray, and low-lying areas in the southern and southwestern
parts, leading to severe food shortage and loss of livestock (Webb, von Braun, and
Yohannes 1992). For example, during the 1971ş75 drought period, which resulted
from a sequence of rain failures, it was estimated that 50 percent of livestock in
Wello and Tigray areas alone were lost ( Webb, von Braun, and Yohannes 1992).
The drought of 1984ş85 and the recent one in 2003 have had even greater dev-
astating effects (Webb, von Braun, and Yohannes 1992; FDRE 2003).
146SAMUEL BENIN, SIMEON EHUI, AND JOHN PENDER
With the exception of purchased feed5 and crop residues, use of other sources
of fodder (communal grazing lands, woodlots, forests, homestead [e.g., prickly
pear], and private pastures) declined between 1991 and 1999, and the decline
was larger in higher-rainfall areas (Table 6.2). The increase in use of crop residues
was greater in higher-rainfall areas, whereas the increase in use of purchased
feed was greater in drought-prone areas, with the proportion of households
buying feed being about three times larger in drought-prone areas (Table 6.3).
Consistent with the decline in use of communal grazing lands is the perception that
both availability and quality have been declining.
Community respondents revealed that use of grazing lands for cropping, set-
tlement, and other nongrazing activities as a result of increasing population pres-
sure has contributed to the decline in availability of grazing lands. Although the
highlands account for about 45 percent of the total area of the country, they are
home to about 80 percent of the total human population (Degefe and Nega 2000).
Rapid population growth (averaging 2.7 percent for the whole country between
1993 and 2001) (FAO 2002) is increasing the demand for farmland and contribut-
ing to farming in traditional grazing areas such as hillsides. Restrictions on use of
communal resources (e.g., grazing lands, woodlots, and forest areas) for fodder have
also contributed to the declining use of these resources. Similar restrictions in use
of communal resources are also found in Tigray (Chapter 10). Grazing lands man-
aged at the village level, compared to those managed at the PA level, are more likely
to have imposed grazing restrictions (e.g., grazing at certain times of the year only
Table 6.2 Perceived changes since 1991 in use of feed resources and availability and quality of
grazing lands, by agricultural potential
Sample mean
Resources
All communities
Drought-prone areas
Higher-rainfall areas
Feed sources
Communal grazing lands
ş0.41
ş0.31
ş0.49
Area enclosures
ş0.02
ş0.04
0.00
Woodlots and forests
ş0.11
ş0.02
ş0.17
Private pastures
ş0.28
ş0.28
ş0.29
Crop residues
0.60
0.29
0.83
Homestead (e.g., prickly pear)
ş0.05
0.15
ş0.19
Purchased feed
0.30
0.52
0.15
Availability of grazing land
ş0.75
ş0.78
ş0.72
Quality of grazing land
ş1.18
ş1.15
ş1.20
Note: Change is an ordinal indicator of perception, where ş2 = decreased significantly, ş1 = decreased slightly, 0 = no
change, +1 = increased slightly, +2 = increased significantly. Sample means are adjusted for stratification, weighting,
and clustering of sample.
LIVESTOCK DEVELOPMENT IN THE ETHIOPIAN HIGHLANDS
147
Table 6.3 Proportion of households buying feed and using animal health services,
by agricultural potential
Sample mean
Assistance
Location
1991
1999
Percentage change
Purchased feed
All communities
0.19
0.25
32
Drought-prone areas
0.28
0.41
46
Higher-rainfall areas
0.12
0.13
8
Animal health services
All communities
0.33
0.55
67
Drought-prone areas
0.23
0.49
113
Higher-rainfall areas
0.40
0.60
50
Note: Sample means are adjusted for stratification, weighting, and clustering of sample.
and/or certain animals only) and for those restrictions to be enforced. With respect
to the decline in use of private pastures, about 45 percent of the communities
reported conversion of private pastures into cropland because of shortage of farm-
land. With the other sources of feed on the decline, crop residues and purchased
feed have tended to be used more.
Use of animal health services (vaccine and treatment) and adoption of im-
proved breeds (especially of cattle and small ruminants) and modern management
practices (artificial insemination, stall feeding, and fattening) have increased since
1991 (Tables 6.3 and 6.4). The proportion of households using health services
increased by almost twofold between 1991 and 1999. Although the proportion of
households using health services is higher in higher-rainfall areas, the proportionate
increase between 1991 and 1999 in drought-prone areas is almost double that in
higher-rainfall areas. Common health problems, in order of importance, revealed
by community respondents include anthrax, black leg, contagious bovine pleuro-
pneumonia, pasteurellosis, parasites, rinderpest, trypanosomosis, sheep and goat
pox, and African horse sickness. Adoption of improved breeds and stall-feeding
practices since 1991 are more common than adoption of artificial insemination
and fattening practices. Stall-feeding practice is twice as common in higher-rainfall
Table 6.4 Proportion of communities (with some of their residents) adopting improved breeds and
modern livestock management practices since 1991, by agricultural potential
Practice
All communities
Drought-prone areas
Higher-rainfall areas
Improved breeds
0.26
0.28
0.25
Artificial insemination
0.05
0.04
0.06
Stall feeding
0.38
0.23
0.48
Fattening
0.03
0.00
0.05
Note: Sample proportions are adjusted for stratification, weighting, and clustering of sample.
148
SAMUEL BENIN, SIMEON EHUI, AND JOHN PENDER
areas than in the drought-prone areas, whereas fattening practices are undertaken
exclusively in low-rainfall areas.
Community respondents revealed that they adopted the above technologies in
order to increase livestock productivity (e.g., meat and milk yield and draft power).
Improvement in access to animal health services and credit and extension were cited
by most of the communities as having contributed to the above changes. Between
1995 and 2000 alone, 323 veterinary clinics were constructed (ANRSC 2000a), and
the number of vaccinations and treatments increased by 33 percent from 5.4 million
in 1993ş94 to 7.2 million in 1997ş98 (BoPED 1998, 1999). Traditionally, credit
and associated extension focused on crop production to the neglect of the livestock
subsector. However, there are now many nongovernmental organizations (NGOs)
involved in the region providing credit for purchasing livestock, extension on im-
proved forage development, and veterinary services.6 In addition, compared to past
programs, the current extension system, Participatory Agricultural Demonstration
Extension and Training System (PADETES), launched in the region in 1997, gives
more attention to livestock by employing an integrated approach to crop, livestock,
and natural resource management and postharvest technology.7 Furthermore, a
revolving credit program especially to address livestock and other long-term invest-
ment activities has been instituted by the regional government. This credit fund is
granted from various bilateral and multilateral organizations and administered by
the Bureau of Agriculture (Wondafrash, Grace, and Assefa 1998).
Because livestock are very important to the livelihood of farmers engaged in
mixed cropşlivestock farming systems in the highlands, a declining trend in owner-
ship of livestock is cause for worry, especially in light of the livestock revolution
that is anticipated to take place in developing countries within the next 20 years
(Delgado et al. 1999) and the aim of making the livestock revolution work for the
rural poor (ILRI 2000). Below we investigate the determinants of changes in use of
feed resources, availability and quality of grazing lands, use of animal health services,
adoption of improved breeds and modern management practices, and ownership
of livestock.
Econometric Approach
We have five types of dependent variables: (1) changes in ownership of livestock;
(2) changes in use of feed resources; (3) changes in availability and quality of graz-
ing lands; (4) changes in use of animal health services and purchased feed; and
(5) adoption of improved livestock breeds and modern management practices.
Depending on the type of dependent variable, different econometric techniques
are utilized. However, the general econometric model to be estimated is given by
the first-difference model8
LIVESTOCK DEVELOPMENT IN THE ETHIOPIAN HIGHLANDS
149
y = a ş a + b(x ş x ) + (c ş c )z + e ş e
(6.1)
v
2
1
v2
v1
2
1
v
v2
v1
where y represents the dependent variable in village v, x the vector of observed
v
vt
time-varying factors affecting y, z the vector of observed fixed factors affecting
v
y, and e are unobservable factors affecting y. The observed fixed factors, z ,
vt
v
will have an influence only if the marginal effect of such factors has changed over
time. In the remaining part of this section, we first describe the dependent variables
to be estimated and the specific econometric techniques utilized to estimate them.
Then the explanatory variables used in the estimations are presented.
Changes in Ownership of Livestock
We obtained information on the proportion of households that owned various
types of livestock (cattle, small ruminants, pack animals, and poultry) in a particu-
lar year. Here, we are interested in the differences in the proportions between 1999
and 1991. We use ordinary least squares to estimate the factors affecting the differ-
ences in the proportions because there was no censoring of the dependent variables
(i.e., the proportions were never zero or one in any village). Different types of
livestock are examined because each type has different functions in the farming
system. Primarily, oxen are used for plowing, cows for milk, young cattle (bulls and
heifers) for food and herd replacement, small ruminants and poultry for cash, and
equines for transport. With respect to oxen, the ownership is further disaggregated
into the proportion of households owning one ox only, two oxen only, and more
than two oxen. Households without oxen have to rely entirely on others through
rentals or borrowing, which can severely affect the timeliness of cultivation and
subsequent crop yields. Those with one ox only are better off because they can pair
up with their neighbors in a similar situation, whereas those with two oxen can be
deemed self-sufficient in their plowing needs. Households with more than two
oxen can rent out plowing services to other needy farmers to generate additional
income. In general, the disaggregation helps to provide as much information as
possible.
Changes in Use of Feed Resources and Availability and
Quality of Grazing Lands
Survey respondents provided their perceptions of change in use of various feed
resources and availability and quality of grazing lands. These perceptions were mea-
sured using ordinal indicators of change since 1991 with five possible levels: sig-
nificant reduction, slight reduction, no change, slight increment, and significant
increment. Ordered probit models (Maddala 1983) were therefore used to estimate
the determinants of these changes.
150
SAMUEL BENIN, SIMEON EHUI, AND JOHN PENDER
Changes in Use of Animal Health Services and Purchased Feed
Similar to the information on ownership of livestock, we obtained information on
the proportion of households that used animal health services and bought feed in
1991 and 1999. However, the resulting dependent variables that are calculated
here are censored. For example, if the proportion of households buying feed was
one in 1999, then the dependent variable was right censored. On the other hand,
if the proportion of households buying feed was zero in 1999, then the dependent
variable was left censored. Therefore, we estimate a maximum likelihood censored
regression model (or "two-limit Tobit model"), taking into account both left and
right censoring. The regression model on the change in proportion of households
that bought feed was not statistically significant at the 10 percent level, and so it is
not reported.
Adoption of Improved Livestock Breeds and Modern Management Practices
Survey respondents revealed whether or not some of the residents of the commu-
nity had adopted improved livestock breeds,9 artificial insemination, stall feeding,
or fattening practices since 1991. We use probit regression models to estimate the
factors affecting the probability of adopting these technologies, where the depen-
dent variable is one if some residents have adopted and zero otherwise. Because
only 5 percent and 3 percent of the communities reported having some of their res-
idents adopting artificial insemination and fattening practices, respectively, there
was not enough variation in the respective binary dependent variables to estimate
the adoption of these management practices.
Explanatory Variables and Hypotheses
We expect that changes in feed use, adoption of livestock technologies, and change
in ownership of livestock will be affected by several factors (both static and dynamic),
including agricultural potential, changes in access to markets, population growth,
land tenure policy, changes in participation in credit and extension programs, edu-
cation, and community natural resource management (Pender, Scherr, and Durˇn
1999; Desta et al. 2000; Pender et al. 2001a; Chapter 2). These factors influence
the awareness, availability, costs, benefits, and risks associated with the different
livestock technologies and management practices and livestock ownership.
Increase in population pressure can reduce the availability and quality of graz-
ing resources. Although better market access can increase the use of purchased feed,
it can reduce the use of crop residues, as farmers may shift to producing less cereals
and more marketable crops (e.g., vegetables) whose residues may not be suitable for
livestock. Better market access may also increase use of health services and adoption
LIVESTOCK DEVELOPMENT IN THE ETHIOPIAN HIGHLANDS
151
of improved breeds through increased availability of those technologies and facili-
tating use of cash income from sale of crops to finance their purchase. Credit and
extension can contribute to livestock intensification by increasing ownership and
adoption of improved breeds (through either in-kind livestock credit or cash credit
to purchase livestock), use of crop residues (through increased use of fertilizer), and
adoption of stall feeding and use of health services (through extension services).
Regarding the effects of land tenure policy, the main issue is land redistribu-
tion, which has been frequent and ongoing since 1975 (instituted by the military
government) to reduce landlessness and equalize landholdings and quality across
households. Although land redistribution was stopped in many regions of Ethiopia
in 1991 (with the current government coming to power), it continued in many parts
of the Amhara region. A major recent redistribution exercise in the region took
place in 1996ş97, raising the proportion of farmers who owned land. However,
actual implementation, type and amount of land affected, and population affected
were not uniform across the region, as the exercise was left to local officials for
needs assessment and implementation. In general, the exercise drew a massive reac-
tion, both against and in support of it. See Chapter 9 for further discussion on the
policy, its implementation, reaction to it, and expected effects on land investments
and productivity. By improving farmers' access to land, land redistribution can
increase ownership of livestock by smallholders. On the other hand, by reducing
field size for supporting livestock, land redistribution may reduce ownership. Com-
munity management of grazing lands is expected to increase availability and quality
of grazing lands (Gebremedhin, Pender, and Tesfay 2004; Chapter 10).
Table 6.5 shows a description of the explanatory variables used in the analyses
and their means and standard errors. Agricultural potential is measured by average
annual rainfall (with a mean of 1,217 millimeters), altitude (2,182 meters above
sea level), and change in proportion of area irrigated (0.04 percent). Access to
markets is measured by distance to the woreda town (37 kilometers) and whether
there has been an improvement in access to an all-weather road (5 percent).10 The
other explanatory variables are population growth, which is measured by change in
number of households per square kilometer (11), changes in proportion of house-
holds obtaining credit (and associated extension services) from BoA (20 percent),
ACSI (9 percent),11 and other formal sources (e.g., NGOs, 19 percent), change in
adult literacy (15 percent), whether there has been land redistribution since 1991
(49 percent), and whether villages manage their own grazing lands (39 percent).
Note that the above changes, unless otherwise stated, refer to the difference between
1999 and 1991 levels.
One econometric problem to address here is that several of the time-varying ex-
planatory variables may be endogenous. Population growth, change in participation
152
SAMUEL BENIN, SIMEON EHUI, AND JOHN PENDER
Table 6.5 Means and standard errors of explanatory variables
Explanatory variable
Mean
Standard error
Annual rainfall (Î1,000 millimeters)
1.2177
0.0312
Altitude (Î1,000 meters above sea level)
2.1824
0.0809
Change in proportion of area irrigated
0.0004
0.0002
Distance (Î100 kilometers) to woreda town
0.3739
0.0569
Whether there is improvement in access to all-weather road
0.0527
0.0267
Change in household density (Î100/km2)
0.1107
0.0169
Change in proportion of households with:
Credit from ACSI
0.0890
0.0300
Credit from BoA
0.1988
0.0674
Credit from other formal sources (e.g., NGOs)
0.1880
0.0715
Change in proportion of adult literates
0.1446
0.0159
Whether there was land redistribution since 1991
0.4879
0.0673
Whether village exclusively manages own grazing land
0.3909
0.0782
Note: Change in explanatory variable refers to difference between 1999 and 1991 levels. Sample means
and standard errors are adjusted for stratification, weighting, and clustering of sample.
in credit and associated extension programs, change in area irrigated, and change
in adult literacy may respond to or be affected by changing opportunities in agri-
culture and changing livestock technologies and ownership. We therefore tested for
exogeneity of those potentially endogenous explanatory variables using a Hausman
test (Hausman 1978; Greene 1993).12 We failed to reject exogeneity of those
explanatory variables in the regressions except the regression for change in owner-
ship of goats. Nevertheless, we report the robustness of the significant coefficients
to using predicted values of those potentially endogenous variables.
Results
We present only results of those regressions in which the overall model is statisti-
cally significant at the 10 percent level of significance.
Changes in Ownership of Livestock
Table 6.6 shows the factors affecting changes in the proportions of households
owing livestock. With respect to oxen, it is further broken down into ownership of
one ox only, two oxen only, and more than two oxen. Among the factors that were
hypothesized to affect changes in ownership of livestock, rainfall, altitude, changes
in proportion of households obtaining credit from BoA, and adult literacy have no
statistically significant effect on change in ownership of any type of livestock. Our
finding of a limited association of rainfall and altitude with changes in livestock
ownership contrasts with results for Tigray in Chapter 4, in which ownership of
Table 6.6 Determinants of changes in proportion of households owning livestock, 1991 to 1999
One ox
Two oxen
More than
Explanatory variable
Oxen
only
only
two oxen
Heifers
Bulls
Sheep
Goats
Donkeys
Annual rainfall (Î1,000 millimeters)
ş0.016
ş0.129
ş0.010
0.083
0.139
0.128
ş0.225
ş0.013
0.042
Altitude (Î1,000 meters above sea level)
ş0.001
0.012
ş0.027
0.007
ş0.094
ş0.058
ş0.177
0.067
ş0.089
Change in proportion of area irrigated
4.946
36.53*
ş20.93
ş8.732
ş2.241
ş10.92
ş4.392
ş16.11*
ş27.16***
Distance (Î100 kilometers) to woreda town
ş0.288***R
ş0.033
ş0.181***R
ş0.068**
ş0.002
ş0.007
ş0.178
ş0.192***R
0.030
Whether there is improvement in access to all-weather road
ş0.108*R
ş0.045
0.008
ş0.065
ş0.081
ş0.079
0.013
ş0.056
ş0.077
Change in household density (Î100/km2)
ş0.428
0.144
ş0.240
ş0.402***R
ş0.545***R
ş0.678***R
0.272
ş0.125
0.383
Change in proportion of households:
Credit from ACSI
0.050
0.191
ş0.035
ş0.112*
ş0.248***R
ş0.247***
0.103
ş0.132
ş0.126
Credit from BoA
0.021
ş0.014
0.025
ş0.011
0.008
0.044
0.152
ş0.042
0.058
Credit from other formal sources
ş0.043
ş0.133***
ş0.022
0.072***R
0.045
0.030
ş0.014
ş0.016
ş0.003
Change in proportion of adult literates
ş0.188
ş0.247
0.084
0.103
ş0.016
0.047
ş0.146
ş0.105
0.082
Whether there was land redistribution since 1991
0.176**
0.104***
0.126**R
ş0.063***R
ş0.018
0.008
0.213**
0.154***R
0.151**
Whether village exclusively manages own grazing land
0.046
0.077*
0.008
ş0.022
0.005
0.017
0.075
ş0.035
ş0.002
Intercept
ş0.043
0.045
0.025
ş0.053
ş0.015
ş0.087
0.410*
ş0.190
0.055
Number of observations
86
86
86
86
86
86
86
86
86
F-statistic
4.50***
5.23***
2.79**
5.18***
4.82***
2.73**
3.59***
2.27**
5.04***
R 2
0.39
0.29
0.35
0.29
0.32
0.26
0.43
0.28
0.34
Note: Ordinary least-squares regressions. Change in explanatory variable refers to difference between 1999 and 1991 levels. Coefficients and standard errors are adjusted for stratification, weight-
ing, and clustering of sample.
*, **, and *** indicate statistical significance at 10 percent, 5 percent, and 1 percent levels, respectively.
RCoefficient of same sign and significant at 10 percent level when predicted values used for changes in proportion of households using ACSI, BoA, and other formal credit, adult literacy, household
density, and proportion of area irrigated.
154
SAMUEL BENIN, SIMEON EHUI, AND JOHN PENDER
oxen was found to be greater in higher-rainfall areas, and cows and goats less com-
mon, but sheep more common, at higher altitude. These differences may reflect
the fact that factors influencing differences in levels of livestock ownership were
investigated in Chapter 4, whereas we are investigating differences in changes in
livestock ownership. Both sets of results may be consistent with each other; for
example, it may be that ox ownership is generally greater in higher-rainfall areas but
also be true that changes in ox ownership are not.13
Increase in proportion of area irrigated generally is associated with a reduction
in ownership of livestock, although it is statistically significantly associated with a
reduction in ownership of goats and donkeys only and an increase in ownership
of one ox. The general declining trend suggests less reliance on livestock as we find
that, compared to nonirrigated areas, production of cereals, pulses, and perishable
annuals are more common dominant livelihood strategies in irrigated areas.
Better access to the woreda town is associated with an increase in ownership
of oxen in general (and two or more oxen in particular) and goats. Improvement
in access to all-weather roads, on the other hand, is associated with a decline in
ownership of oxen in general. This latter result is consistent with the findings of
Chapter 4.14
Increase in household density is associated with robust reductions in owner-
ship of more than two oxen, heifers, and bulls. These findings reflect the increasing
pressure on already degraded resources to adequately support large herds of cattle
and are similar to the results of Chapter 4, which found higher population density
associated with less ownership of oxen. We also find that increase in use of ACSI
credit reduces ownership of more than two oxen, heifers, and bulls. This is probably
a result of sale of extra oxen (more than the pair that is needed for plowing) and
young stock to repay loans (fertilizer and improved seed) in times of crop failure or
to supplement repayment when crop prices are at their lowest, immediately follow-
ing harvest.15 Increase in use of credit from other formal sources, on the other
hand, is associated with an increase in ownership of more than a pair of oxen (while
reducing ownership of only one ox). With many NGOs providing credit to farmers
for the purchase of livestock, extension efforts emphasizing development of im-
proved pasture and forages, and veterinary services, more farmers can improve their
ownership of a larger herd of cattle.
Land redistribution is associated with increases in ownership of up to a pair of
oxen, small ruminants, and donkeys, but a reduction in ownership of more than
two oxen. It seems that access to own land, which is enhanced through land re-
distribution, is a major driving force for owning livestock (oxen for plowing and
donkeys for transportation). However, as land redistribution reduces plot sizes
and grazing areas and, therefore, the resources to support a large herd, it causes a
LIVESTOCK DEVELOPMENT IN THE ETHIOPIAN HIGHLANDS
155
reduction in the ownership of more than two oxen (either by selling or gifting extra
oxen to newly formed households who acquired land in the redistribution).
The regression models of changes in ownership of cows, calves, horses, and
mules were not statistically significant, and so they are not reported.
Changes in Use of Feed Resources
The determinants of changes in use of various feed sources are shown in Table 6.7.
Several factors have statistically significant effects on change in use of some feed
resource. Increase in use of private pastures is positively affected by an increase in
the proportion of area irrigated and in areas where land redistribution has taken
place. Irrigation allows higher cropping intensity to achieve higher crop yields or
production of higher-value products. With higher yields from irrigated plots, part
of cropland can then be released for private pasture development, especially in areas
where part of traditional grazing areas (hillsides and waste lands) has been distributed
for cropping and tree-planting activities. Decreased use of private pastures, how-
ever, is associated with an increase in adult literacy. Perhaps, as education increases,
people become more aware and shift to cheaper alternative sources of feed, such as
prickly pear, which grows wild in the homestead. Another explanation may be that
people diversify into nonfarm activities as they become more educated.
Increase in use of crop residues is positively affected by increased use of credit
from ACSI, where land redistribution has taken place, and where villages manage
their own grazing lands. Because ACSI credit is given in kind in the form of chem-
ical fertilizers and improved seed, increasing the proportion of participants can lead
to increased intensification of crop production and, subsequently, increased pro-
duction of crop residues that can be fed to livestock. With respect to land redistri-
bution, the positive influence may be reflecting the increased reliance on crop
residues for feed as a result of distribution of traditional grazing areas (mainly be-
tween 1996 and 1998) to newly formed households for cropping and tree-planting
activities to reduce the growing incidence of landlessness. On the other hand,
it may also reflect the positive effect of land redistribution on input use and crop
yield by improving access to land by farmers who are more able and willing to use
purchased inputs (Benin and Pender 2001). The positive association between vil-
lages managing their own grazing lands and increased use of crop residues may
seem counterintuitive. However, as mentioned earlier, grazing lands managed at
the village level are more likely to have grazing restrictions (e.g., grazing at certain
times of the year only or for certain animals only) imposed on them and for those
restrictions to be enforced. Therefore, farmers in such villages have to rely more on
crop residues and other sources of feed for their animals during the period of no
grazing or for those animals that are not allowed to graze.
Table 6.7 Determinants of perceived changes since 1991 in use of feed resources and availability and quality of grazing lands
Sources of feed
Grazing lands
Explanatory variable
Private pastures
Crop residues
Homestead
Availability
Quality
Annual rainfall (Î1,000 millimeters)
0.278
ş0.777
0.036
1.432
1.489**
Altitude (Î1,000 meters above sea level)
0.290
ş0.263
0.057
ş0.654**
ş0.563**
Change in proportion of area irrigated
269.7***R
ş84.65
59.19
87.75
11.51
Distance (Î100 kilometers) to woreda town
ş0.363
ş0.567
0.577
0.163
ş0.353
Whether there is improvement in access to all-weather road
ş0.586
ş1.363***R
ş0.219
0.082
ş0.342
Change in household density (Î100/km2)
ş0.134
0.106
0.933
ş3.757*R
ş4.747***R
Change in proportion of households with:
Credit from ACSI
0.077
1.971***
0.451
0.723
ş0.070
Credit from BoA
ş0.354
ş0.790
0.557
ş0.351
0.072
Credit from other formal sources
ş0.353
ş0.616*R
0.953**
0.082
ş0.686*
Change in proportion of adult literates
ş2.654*
0.590
2.982*
1.788*R
0.727
Whether there was land redistribution since 1991
0.554*
0.924***
ş0.121
ş0.719
ş1.201***R
Whether village exclusively manages own grazing land
0.027
0.543**R
ş1.893***R
0.705*
0.814***
Number of observations
86
86
86
86
86
F-statistic
2.40**
5.76***
2.99**
1.76*
2.66**
Note: Ordered probit regressions. Change in explanatory variable refers to difference between 1999 and 1991 levels.The dependent variables are ordinal indicators of perceived changes since 1991,
where ş2 = decreased significantly, ş1 = decreased slightly, 0 = no change, +1 = increased slightly, +2 = increased significantly. Coefficients and standard errors are adjusted for stratification, weight-
ing, and clustering of sample.
*, **, and *** indicate statistical significance at 10 percent, 5 percent, and 1 percent levels, respectively.
RCoefficient of same sign and significant at 10 percent level when predicted values used for changes in proportion of households using ACSI, BoA, and other formal credit, adult literacy, household
density, and proportion of area irrigated.
LIVESTOCK DEVELOPMENT IN THE ETHIOPIAN HIGHLANDS
157
Improvement in access to all-weather roads and increase in proportion of house-
holds obtaining credit from NGOs are associated with a decline in use of crop
residues. Improvement in access to markets may induce farmers to produce more
vegetables and other cash crops, whose crop residues may not be suitable for live-
stock, for sale. However, they can use part of the income to buy feed, as we find
that improvement in access to all-weather roads is associated with increases in use
of purchased feed. As mentioned earlier, there are many NGOs providing credit
and extension for the development of backyard and improved forages. Therefore,
the success of these programs may reduce use of crop residues as feed because the
various feed resources are substitutes.
Increase in use of homestead sources of feed (prickly pear, backyard forages,
etc.) is positively affected by increases in proportion of households obtaining credit
from other formal sources and adult literacy. With respect to credit, there are many
NGOs involved in the region who are providing credit as well as extension in
development of backyard forages. This influence is likely more a result of the effects
of extension than of credit, per se. Education, on the other hand, may increase
farmers' awareness of the benefits of using prickly pear, which commonly grows
wild in the homestead and, therefore, is free. However, decline in use of feed from
the homestead is greater where villages manage their own grazing lands. These
findings again highlight the relative profitability and substitutability of the various
feed resources.
The regression models of changes in use of purchased feed, communal grazing
lands, and woodlot or forest areas for fodder were not statistically significant at the
10 percent level. Therefore, they are not reported.
Changes in Availability and Quality of Grazing Lands
The determinants of changes in the availability and quality of grazing lands are also
shown in Table 6.7. Change in availability of grazing lands is significantly affected
by altitude and changes in household density and proportion of adult literates, and
where villages manage their own grazing lands. We find that availability of grazing
lands has declined more at higher altitudes and where household density has
increased more but improved more where adult literacy has improved and where
villages manage their own grazing lands. The negative effects of altitude and popu-
lation growth are consistent with a neo-Malthusian notion regarding the negative
effects of population growth. We also find that household density increases with
altitude. Thus, population growth is not inducing sufficient investment in im-
provement of communal resources to overcome the negative effects of increased
pressure on degrading resources. This is consistent with the finding from Tigray
(Gebremedhin, Pender, and Tesfay 2004; Chapter 10) that community natural
158
SAMUEL BENIN, SIMEON EHUI, AND JOHN PENDER
resource management is less likely to be successful in densely populated commu-
nities because of difficulties of maintaining collective action in maintenance and
use of those resources.
Increased quality of grazing lands is positively affected by rainfall and is also
seen where grazing lands are managed at the village level. Generally, ample and
reliable rainfall intensity, as observed in the high-agricultural-potential areas of the
western Amhara region, ensures adequate growth and quick regeneration of lush
natural pastures. With respect to community resource management at the village
level, because communal grazing lands managed at this lower level are more likely
to have grazing restrictions imposed on them and for those restrictions to be
enforced, their quality will tend to be higher. Quality of grazing lands, on the other
hand, has declined more at higher elevations, where household density and use of
credit from other formal sources have increased and where land redistribution has
taken place. Generally, human settlement increases with altitude, and so the declin-
ing quality of grazing lands reflects the increasing pressure on grazing resources if
population growth does not induce sufficient communal resource investment to
improve the condition of those degrading resources. With respect to the negative
effects of credit, involvement of NGOs in the development of backyard forages
may be a contributing factor. There is additional increasing pressure on the already
degraded grazing resources where there has been land redistribution because parts
of traditional grazing areas (hillsides and waste lands) are distributed for cropping
and tree-planting activities, and more farmers are able to own livestock, as dis-
cussed earlier.
Change in Use of Animal Health Services
The determinants of change in the proportion of households using animal health
services (vaccine and treatment) are shown in Table 6.8. Increase in use of animal
health services is negatively affected by rainfall but positively affected by increase in
proportion of area irrigated, better access to the woreda town, increase in use of
credit from BoA, and a history of local land redistribution.16 The finding that higher
use of health services is associated with lower-rainfall areas is counterintuitive.
Nutrition may be a confounding factor in developing low resistance to diseases
in lower-rainfall areas. However, lower-rainfall areas face less disease risk as well as
lower agricultural potential and lower incomes. Thus, only some diseases may be
more common in lower rainfall areas, and purchasing power to use health services
will be less. Note, however, that the proportion of households using animal health
services was greater in higher-rainfall areas in both 1991 and 1999, though the
percentage increase was greater in lower-rainfall areas (Table 6.3). Poorly managed
irrigation projects can become breeding grounds for animal disease vectors and
Table 6.8 Determinants of changes (1991 to 1999) in proportion of households using animal health services and adoption of improved breeds and stall
feeding by communities since 1991
Adoption of
Explanatory variable
Use of animal health services
Improved livestock breeds
Stall feeding
Annual rainfall (Î1,000 millimeters)
ş1.034*
ş2.735**
ş2.824
Altitude (Î1,000 meters above sea level)
0.260
0.613
0.161
Change in proportion of area irrigated
85.32***
309.2**
ş56.83
Distance (Î100 kilometers) to woreda town
ş0.510***R
1.679*R
ş0.079
Whether there is improvement in access to all-weather road
0.425
0.000
ş0.207
Change in household density (Î100/km2)
1.503
8.062***R
3.422
Change in proportion of households with:
Credit from ACSI
0.644
1.824
1.488
Credit from BOA
0.444*
0.841
1.447
Credit from other formal sources
ş0.111
1.653***
2.510***
Change in proportion of adult literates
ş2.084***
3.191
ş1.089
Whether there was land redistribution since 1991
0.390*R
1.688***R
2.453***R
Whether village exclusively manages own grazing land
ş0.034
ş0.466
0.786
Intercept
0.886*
ş2.491
ş0.177
Type of regression
Censored MLE
Probit
Probit
Number of observations
85
79
86
F-statistic
4.47***
3.22**
2.85**
Note: Change in explanatory variable refers to difference between 1999 and 1991 levels. For the censored MLE regression, there are 70, 4, and 11 uncensored, left-, and right-censored
observations, respectively. Coefficients and standard errors are adjusted for stratification, weighting, and clustering of sample.
*, **, and *** indicate statistical significance at 10 percent, 5 percent, and 1 percent levels, respectively.
RCoefficient of same sign and significant at 10 percent level when predicted values used for changes in proportion of households using ACSI, BoA, and other formal credit, adult liter-
acy, household density, and proportion of area irrigated.
160
SAMUEL BENIN, SIMEON EHUI, AND JOHN PENDER
parasites (e.g., worms and ticks) and may therefore increase the incidence of related
diseases and, consequently, demand for health care. On the other hand, people may
use more health services in irrigated areas because they have more income and can
better afford it.
Better access to the woreda town generally improves access to health services,
either by walking animals to the clinic or going to seek advice or purchase drugs,
especially with increased access to extension from BoA. With respect to the positive
influence where there has been land redistribution, we find that redistribution
increases the proportion of households owning livestock (discussed earlier) and,
therefore, other things being the same, we would expect the proportion of house-
holds using health services to also increase.
The results show that an increase in adult literacy is associated with a reduc-
tion in use of animal health services. The reason for this result is not apparent, as
we expect better-educated people to have higher nonfarm income that can con-
tribute to financing and using more health services.
Adoption of Improved Livestock Breeds and Stall Feeding
The factors affecting adoption of improved livestock breeds and stall feeding are
also shown in Table 6.8. Adoption of improved breeds is positively affected by an
increase in the proportion of area irrigated, increase in household density, increase
in proportion of households obtaining credit from other formal sources, and where
there has been a land redistribution but negatively affected by access to the woreda
town. These findings, except the effect of access to the woreda town, jointly sug-
gest that the increasing pressure (population growth and diminishing plot sizes
and grazing areas as a result of land redistribution) on already degraded grazing
resources may be inducing farmers to replace part of their local stock with fewer
improved breeds in order to reduce the pressure on resources while improving the
productivity of their herd. Although substantial added investment may be required
to replace a larger herd of local animals with a smaller herd of local and improved
animals, evidence suggests that the return on investment can be very high. For
example, crossbred cows used for production of both milk and traction can pro-
duce about six times more milk than local cows and plow a plot of farmland
faster than local oxen, and the return on investment can be as high as 78 percent
(GebreWold, Misgina, and Shapiro 1998). Providing the impetus for the change
are increase in irrigation, which promotes development and use of private pastures
(as discussed earlier), and increase in use of credit from NGOs to purchase im-
proved breeds and associated extension on development of improved forages and
provision of veterinary care. Household data, however, are needed to further test
these hypotheses.
LIVESTOCK DEVELOPMENT IN THE ETHIOPIAN HIGHLANDS
161
The reason for the negative association between better access to the woreda
town and adoption of improved livestock breeds is not apparent. It may be that the
credit and extension programs of those NGOs involved in the region are being tar-
geted to more remote areas. In this case, the issue of sustainability (e.g., obtaining
the necessary inputs and support services) when such projects come to an end needs
to be addressed. Further research is, however, needed to explain the relationship.
The adoption of stall feeding,17 which is also positively affected by an increase
in the proportion of households obtaining credit from other formal sources and by
a history of land redistribution, appears to complement the adoption of improved
breeds, as we find that almost 80 percent of the communities that adopted im-
proved breeds also adopted stall feeding.18
Conclusions and Implications
Using data from a survey conducted in northern Ethiopia, this chapter examined
the trends since 1991 in the ownership of various types of livestock, use of various
livestock feed resources and animal health services, and adoption of improved
breeds and modern management practices. We found that ownership of various
types of livestock has declined and that there have been significant changes in uti-
lization of feed resources: although use of communal grazing lands, private pastures,
woodlots, and forest areas as feed sources has declined, the proportion of house-
holds using crop residues and purchased feed has increased. In addition, the pro-
portion of households using animal health services and the proportion of com-
munities adopting improved livestock breeds and modern management practices
(e.g., artificial insemination, stall feeding, and fattening) have increased. The fac-
tors contributing to the trends include agricultural potential, changes in access to
markets and participation in credit and extension programs, population growth,
land redistribution, and community natural resource management, as these factors
influence the awareness, availability, costs, benefits, and risks associated with own-
ing livestock and with the use of different feed sources, technologies, and practices.
Irrigation can influence the agricultural potential in the Ethiopian highlands,
largely dependent on rainfall, to develop and improve private pastures while
improving crop productivity. As irrigation, combined with improved seeds and
fertilizer, lead to higher crop yields, other plots, especially the homestead, can be
released for forage and pasture development. In fact, an ambitious program to tap
the irrigation potential in the Ethiopian highlands was developed under the Sus-
tainable Agriculture and Environmental Rehabilitation Program. In Amhara region
alone, for example, the program initially planned to construct 540 microdams to
irrigate 62,000 hectares over 10 years (CoSAERAR 1999). However, the plans have
162
SAMUEL BENIN, SIMEON EHUI, AND JOHN PENDER
been scaled back as a result of capacity constraints and assessment of the availability
of suitable sites. Given the limited opportunities for development of irrigation
projects, the costs involved, and potential public health problems, as the data show
that incidence of mosquitoes and malaria were more prevalent in communities
with irrigation (see also Haile et al. 2003), their development should be considered
on a case-by-case basis.
Better access to woreda towns significantly improves ownership of oxen and
goats, whereas improvement in access to all-weather roads reduces ownership of
oxen. Improving access to markets and communal management of grazing resources
have complex interrelationships, which in turn have mixed influences on use of feed
resources by influencing the relative importance (and profitability) of feed resources
and condition of grazing lands, respectively. Further research on the complex causeş
effect relationships is needed to derive policy implications, given that access to
infrastructure has improved very little over the years. For example, in the early
1980s, it was found that about three-fourths of highland farm households lived
more than a six-hour walk from an all-weather road (FAO 1986). Nearly two
decades later, the average distance is about a five-hour walk (Pender et al. 2001a).
Better access to credit and extension, especially those offered by the Amhara
Credit and Savings Institution (ACSI) and the Bureau of Agriculture (BoA), have not
had positive influences across the board, probably because credit and extension tar-
geting livestock started only recently. The finding of negative effects of ACSI credit
on livestock ownership needs to be researched further, and alternative approaches
to credit delivery and collection considered. However, the positive effects of the
credit and extension given by NGOs suggests that the government credit and exten-
sion programs, by adopting the management and delivery strategies of those NGOs
involved, can have similar positive but farther-reaching effects on livestock owner-
ship because the government programs are implemented all over the region.
The negative effects of rapid population growth on ownership of livestock and
availability and quality of grazing lands support the Malthusian perspective that
rapid population growth contributes to poverty and resource degradation. Efforts
to help farmers restock may be critical to poverty alleviation. However, in helping
farmers to restock and get out of the downward spiral, replacing some local stock
with fewer improved breeds to reduce herd size and stocking rate should be con-
sidered because this strategy can reduce the pressure on the already degraded
resources while improving livestock productivity. To enhance the adoption process,
priority should be given to investment in improving access to markets and credit
and extension programs oriented toward livestock improvement.
Access to land seems to be a major factor affecting livestock ownership, as land
redistribution, which enhanced access to land for many households, had significant
LIVESTOCK DEVELOPMENT IN THE ETHIOPIAN HIGHLANDS
163
positive effects on ownership of most types of livestock. However, ownership of
more than two oxen (larger herd) was reduced, indicating the negative implications
of land redistribution by reducing plot sizes and quality of grazing lands. Never-
theless, it is difficult to continue to use redistribution as a tool to address landless-
ness because of the very small size of farm holdings and diminishing traditional
grazing areas (hillsides and waste lands) in the Ethiopian highlands. Thus, devel-
oping oxen sharing, lease arrangements, or other mechanisms for obtaining plow
services will become important as farm sizes continue to decline.
Notes
The authors acknowledge the Norwegian Ministry of Foreign Affairs for funding this research and
Tom Randolph, Susan Horton, and Mohammad Jabbar for their useful comments and suggestions.
Any errors are the responsibility of the authors.
1. The share of livestock in total exports, however, declined from 21.3 percent in 1987ş88
to 12.9 percent in 1995ş96, with hides and skins contributing about 93 percent of total livestock
exports within this period (Degefe and Nega 2000). There is similar evidence of the importance of
livestock to the livelihoods of farmers in other Sub-Saharan African countries. For example, in the
greater horn of Africa (comprising Ethiopia, Kenya, Somalia, Tanzania, and Uganda), it is esti-
mated that livestock provide 20 to 30 percent of GDP and about 70 percent of farm cash income
(Ndikumana et al. 2000). See for example ILCA (1987), USDA (1990), and Gittinger et al. (1990)
for other estimates.
2. Poverty actually increased in urban areas by 11 percent within the same period (Wolde-
hanna and Alemu 2002).
3. Peasant associations are the lowest-level local government in Ethiopia and usually consist
of three to five villages.
4. Compared to other regions, Amhara stands first in number of goats; second in cattle,
sheep, asses, horses, and poultry; and fifth in camels (CSA 1998).
5. Purchased feed includes oil-seed cakes, grain mill byproduct, straw, and atella (residue
obtained from brewing local beer).
6. See Desta et al. (2000) for details on NGO activities in the region.
7. PADETES was launched in the country in 1994.
8. The first difference model eliminates unobservable fixed factors as a source of omitted
variable bias.
9. These include mainly indigenous animals improved through breeding or selection as well
as crossbred animals.
10. We had wanted to use the change between 1999 and 1991 in walking time to the near-
est all-weather road. However, there were only two cases where the walking time had changed
(decreased), although there were several cases where there was no "access" in 1991 but there was
access in 1999. Therefore, we used instead a dummy variable to represent an "improvement in
access to an all-weather road," where 1 refers to either a reduction in walking time between 1991
and 1999 or access in 1999 where access did not exist in 1991, and 0 otherwise.
11. ACSI started operating in the region in 1995, and so we used the proportion of house-
holds participating in 1999, which is equivalent to the change since 1991.
164
SAMUEL BENIN, SIMEON EHUI, AND JOHN PENDER
12. The instrumental variables used to predict the potentially endogenous explanatory vari-
ables, in addition to the exogenous variables in the regressions, include the values of each those
endogenous variables in 1991: walking time to nearest bus station in 1991 and change since 1991,
walking time to the nearest grain mill in 1991 and change since 1991, walking time to the near-
est primary school in 1991 and change since 1991, and the proportion of households that were
landless in 1991. The instruments predicted most of the potentially endogenous variables fairly
well: R2 = 0.66 for change in household density, 0.64 for change in proportion of households
obtaining credit from other formal sources, 0.59 for change in proportion of households obtain-
ing credit from BoA, 0.33 for change in adult literacy, 0.28 for proportion of households obtaining
credit from ACSI, and 0.25 for change in proportion of area irrigated.
13. Note from the first difference econometric model described in equation (6.1) that the
coefficient of fixed variables such as rainfall and elevation do not represent the same thing as a coef-
ficient in a cross-sectional model; instead, the coefficient of fixed variables represent the change in
coefficient that would apply at a given point in time. By contrast, the coefficients of changes in ex-
planatory variables in the first difference model (such as changes in access to roads) should reflect
the same coefficients as in a cross-sectional model, assuming that coefficients do not change between
the two time periods in the first difference model.
14. As noted in the previous endnote, the coefficient of change in road access in a first dif-
ference model should be consistent with the coefficient of road access in a cross-sectional model,
whereas the coefficient of a fixed variable such as distance to the nearest town would not be the same
in cross-sectional and first difference models.
15. Generally, postharvest repayment of credit is a problem associated with most agricultural
loans.
16. In Chapter 4, rainfall and market access were found to have insignificant association with
use of vaccination services. The difference between that finding and ours could be for the same rea-
son explained in note 14.
17. Stall feeding is commonly used when raising improved livestock breeds, especially dairy
animals.
18. The positive association of stall feeding with access to some types of NGO credit contrasts
with results in Chapter 4, where the authors found a negative association of NGO credit with
improved feeding practices. This difference may reflect differences in the focus of NGO credit
programs as well as differences in response variables (changes vs. levels), as noted previously.
C h a p t e r 7
Strategies to Increase
Agricultural Productivity and Reduce
Land Degradation in Uganda:
An Econometric Analysis
John Pender, Ephraim Nkonya, Pamela Jagger,
Dick Sserunkuuma, and Henry Ssali
Land degradation and low agricultural productivity are severe problems in
Uganda. Although Uganda's soils were once considered to be among the
most fertile in the tropics (Chenery 1960), problems of soil nutrient deple-
tion, erosion, and other manifestations of land degradation appear to be increasing.
The rate of soil nutrient depletion is among the highest in Sub-Saharan Africa
(Stoorvogel and Smaling 1990), and soil erosion is a serious problem, especially in
highland areas (Bagoora 1988). Land degradation contributes to the low and in
many cases declining agricultural productivity in Uganda. Farmers' yields are typi-
cally less than one-third of potential yields found on research stations, and yields of
most major crops have been stagnant or declining since the early 1990s (Deininger
and Okidi 2001).
Finding ways to reverse these trends is an urgent need in Uganda and many
other developing countries. In order to do that, information is needed to help iden-
tify strategies that will lead to more productive and sustainable land use. Because of
the diverse agro-ecological and socioeconomic conditions in Uganda and the com-
plex set of factors and interactions that influence farmers' land management deci-
sions and their implications for productivity and land degradation, addressing this
information need is a formidable challenge. This chapter addresses this challenge
by developing and estimating a structural econometric model of household decisions
166
JOHN PENDER ET AL.
regarding income strategies, participation in programs and organizations, crop
choices, land management, and labor use and their implications for agricultural
production and land degradation based on a survey of over 450 households and
their farm plots in central and southern Uganda.
Conceptual Framework and Methodology
Empirical Model
The key outcomes of interest in this study are agricultural production and land
degradation. We consider the proximate causes of each of these, including house-
hold choices regarding income strategies, land management, and other decisions, and
the underlying determinants of these choices.1
Value of crop production. For agricultural production, we focus on the value of
crop production. We assume that the value of crop production by household h on
plot p( y ) is determined by the vector of shares of area planted to different types
hp
of crops (C ); the amount of labor used (L ); the vector of land management
hp
hp
practices used (LM ); the "natural capital" of the plot (NC ) (biophysical char-
hp
hp
acteristics and presence of land investments); the tenure characteristics of the plot
(T ) (land rights category, how plot acquired, tenure security); the household's
hp
endowments of physical capital (PC ) (land, livestock, equipment), human capital
h
(HC ) (education, age, and gender), and "social capital" (SC ) (participation in
h
h
programs and organizations); the household's income strategy (IS ) (primary income
h
source); village-level factors that determine local comparative advantages (X ) (agro-
v
ecological conditions, access to markets and infrastructure, and population density);
and random factors (u
):
yhp
y
= y(C , L , LM , NC , T , PC , HC , SC , IS , X , u
) (7.1)
hp
hp
hp
hp
hp
hp
h
h
h
h
v
yhp
Soil erosion. Many of the factors determining the value of crop production also
are expected to influence land degradation. We use soil erosion as an indicator of
land degradation, although this is certainly not the only form of land degradation
occurring in Uganda. Because we have not been able to measure erosion on the plots
studied in this research, we use predicted erosion based on the revised universal soil
loss equation (RUSLE) (Renard et al. 1991). The RUSLE has been calibrated to
soil conditions in Uganda by several recent studies (Tukahirwa 1996; Lufafa et al.
2003; Mulebeke 2003; Majaliwa 2003). The RUSLE estimates annual soil loss on
the basis of several factors, including rainfall intensity, soil erodibility, topography
STRATEGIES IN UGANDA: AN ECONOMETRIC ANALYSIS
167
(slope, slope length, and curvature), land cover, and land management practices.
The RUSLE model is deterministic, providing deterministic predictions of erosion
based on the factors mentioned above. As such, it is not so useful in estimating the
statistical relationships between land management practices and actual erosion
because these are predicted by the model. However, the predictions of RUSLE can
be useful in estimating the relationships between underlying socioeconomic and
biophysical factors that determine crop choice and land management and hence
affect erosion. Considering the factors determining land management decision,2
and assuming that the error term is additive,3 we have the following expression for
erosion:
e
= e(NC , T , PC , HC , SC , FC , IS , L , X ) + u
(7.2)
hp
hp
hp
h
h
h
h
h
f h
v
ehp
Suppose that actual erosion is equal to erosion predicted by RUSLE (ep ) plus
hp
a randomly distributed error term:
e
= ep + v
(7.3)
hp
hp
ehp
Then substituting equation (7.3) into (7.2), we have:
ep = e(NC , T , PC , HC , SC , FC , IS , L , X ) + u
ş v
(7.4)
hp
hp
hp
h
h
h
h
h
f h
v
ehp
ehp
Thus, we can estimate equation (7.2) using equation (7.4), as long as the predic-
tion error (v ) is not correlated with the explanatory factors. We maintain this as
ehp
an assumption, recognizing that violation of this assumption would lead to biased
estimates of the parameters in equation (7.2).
Explanatory variables. The village-level explanatory variables (X ) include the
v
agro-ecological and market access zone and the population density of the parish
(the second lowest administrative unit, consisting of several villages). Ruecker et al.
(2003) classified the agroclimatic potential for perennial crop (banana and coffee)
production in Uganda, based on the average length of growing period, rainfall pat-
tern (bimodal versus unimodal), maximum annual temperature, and altitude (Fig-
ure 7.1; see color insert). Potential for maize production was also mapped, and this
map was found to be very similar. Thus, the zones in Figure 7.1 are representative
of agroclimatic potential for the most important crops in Uganda.4 Seven zones
were identified: the high-potential bimodal rainfall area (BH) at moderate elevation
near Lake Victoria (the "Lake Victoria crescent"), the medium-potential bimodal
rainfall area (BM) at moderate elevation (most of central and western Uganda), the
168
JOHN PENDER ET AL.
low-potential bimodal rainfall area (BL) at moderate elevation (lower-elevation
parts of southwestern Uganda), the high-potential bimodal rainfall southwestern
highlands (SWH), the high-potential unimodal rainfall eastern highlands (EH), the
medium-potential unimodal rainfall region at moderate elevation (parts of north-
ern and northwestern Uganda), and the low- and very-low-potential unimodal rain-
fall region (unimodel) at moderate elevation (much of northeastern Uganda).
A classification of Uganda into areas of low and high market access, using
an index of "potential market integration" based on estimated travel time to the
nearest five markets, weighted by their population, is shown in Figure 7.2. Market
access in Uganda is highest in the Lake Victoria crescent (especially close to the
major urban centers of Kampala and Jinja), in parts of the densely populated high-
lands, and near to the highway network in the rest of the country.
Household-level factors include income strategy (primary income source of
the household); ownership of natural and physical capital (area of land, value of
livestock and farm equipment); human capital (education, age, and gender of house-
hold head); the family labor endowment (size of household and proportion of
dependents); financial capital (access to formal or informal credit);5 and social
capital (participation in technical assistance programs [longer-term training and
shorter-term extension programs] and in various types of organizations). Plot-level
factors include the size, tenure, and land rights status of the plot, whether the plot
has a formal title, whether the household expects to have access to the plot in 10
years, the altitude of the plot; the distance of the plot from the farmer's residence,
roads, and markets; the investments that have been made on the plot (presence
of irrigation, trenches, grass strips, live barriers, and planted trees; share of area
planted to perennial crops); and various plot quality characteristics (slope, position
on slope, soil depth, texture, color, and perceived fertility).
Hypotheses
Hypotheses about the effects of most factors on land management and outcomes
were discussed in Chapter 2. Here we focus only on the hypothesized influences
of land tenure systems in Uganda, which have not been discussed in any detail in
other chapters.
Land tenure. There are four types of land tenure in Uganda: customary, mailo,
freehold, and leasehold. Owners of freehold land have complete rights to use, sell,
lease, subdivide, mortgage, or bequeath this land; formally, this is the most com-
plete and secure form of tenure. Customary land is subject to customary laws and
regulations and is the most common form of tenure. Owners of customary land
generally have secure rights to use, lease, and bequeath this land, but sales are sub-
STRATEGIES IN UGANDA: AN ECONOMETRIC ANALYSIS
169
Figure 7.2 Classification of market access in Uganda
Low
High
Source: Ruecker et al. (2003).
ject to approval of clan leaders and family members. Customary landholders are
encouraged by the 1998 Land Act to apply for freehold status or to acquire a
certificate of customary ownership, both of which are issued by the district land
board. However, the process of getting the certificate of customary ownership or a
title for freehold is costly and cumbersome, as it involves cadastre expertise. As a
result, few customary owners have converted their land to freehold status, and even
many owners of freehold land do not have titles. Mailo land is land that was pro-
vided by the British colonial government to the Buganda royal family and other
170
JOHN PENDER ET AL.
nobles in units of square miles (mailo), and was regarded as freehold land under
colonial law. However, most of this land is occupied by long-term tenants, whose
rights have been increasingly protected by the government of Uganda since the end
of colonial rule, and the 1998 Land Act provides long-term mailo tenants the right
to acquire freehold title to mailo land. Leasehold land is private or public land
leased from the landlord for a specific period of time. Under the leasehold, the land-
lord grants the tenant exclusive possession of land during the lease period, and in
return the tenant pays rent or service under specified terms and conditions that
vary widely (Republic of Uganda 1998).
The extent of tenure insecurity among these different tenure systems is debat-
able. Customary landholders have had access to these lands for a long time, though
in some areas the power of traditional authorities has been undermined in the past
by actions of the government (Place, Ssenteza, and Otsuka 2001), which may have
contributed to insecurity. The 1998 Land Act seeks to ensure tenure security on
customary land by recognizing the jurisdiction of local authorities and customary
laws over this land. Mailo tenants generally have strong rights (Place, Ssenteza, and
Otsuka 2001), and the 1998 Land Act increases these. Holders of leasehold land
generally have long-term leases of public land from the state or individual land-
lords. However, in some cases such leases have been provided to elites without
regard to other occupants of the land, contributing to risks of insecurity and con-
flict (Place, Ssenteza, and Otsuka 2001). Thus, tenure security may be a concern
for occupants of leasehold or public land.
Ownership of a formal title may amplify the influence of greater tenure secu-
rity and complete land rights associated with freehold by providing proof of free-
hold status. In particular, formal title may facilitate access to credit and help to
prevent or resolve land disputes (Feder et al. 1988). Thus, we investigate the
influence of a title, per se, in addition to the land tenure status. We also inves-
tigate the effects of households' perception of perceived tenure security and the
means of land acquisition, which may also influence incentives to invest in land
management. For example, tenants on rented land are unlikely to invest in soil and
water conservation measures if the lease is short term. Owners of purchased land
and tenants using cash rental may have more incentive than owners of inherited
land to produce cash crops and apply inputs in order to be able to recoup the costs
of their investment. These differences may result in differences in crop production
and land degradation.
Data. The above models were estimated using econometric analysis of survey
data collected in 107 communities during 1999 to 2001. The study region included
most of Uganda, including more densely populated and more secure areas in the
STRATEGIES IN UGANDA: AN ECONOMETRIC ANALYSIS
171
southwest, central, eastern, and parts of northern Uganda, representing seven of the
nine major farming systems of the country (Figure 7.3; see color insert).6 Within
the study region, communities (LC1s, the lowest administrative unit, usually a
single village) were selected using a stratified random sample, with the stratification
based on development domains defined by the different agro-ecological and mar-
ket access zones shown in Figures 7.1 (see color insert) and 7.2, and differences
in population density (Pender et al. 2001b). One hundred villages were selected in
this way. Additional communities were purposely selected in areas of southwest
and central Uganda, where the African Highlands Initiative and the International
Center for Tropical Agriculture (CIAT) are conducting research.
A community-level survey was conducted with a group of representative people
from each selected community to collect information on access to infrastructure
and services, local markets and prices, and other factors. A random sample of
451 households was selected (four households per community in most cases). For
each household selected, a household-level questionnaire collected information about
household endowments of assets, household composition, income, expenditures,
and adoption of agricultural and land management technologies. A plot-level sur-
vey was also conducted to collect information on all of the plots owned or operated
by the household, including information about land tenure, plot quality character-
istics, land management practices, use of inputs, and outputs from the plot in the
year 2000. The survey information was supplemented by secondary information
collected from the 1991 population census and available geographic information.
Analysis. The analysis conducted was similar to that discussed in detail in Chap-
ter 5.7 We used econometric analysis to analyze the determinants of income strate-
gies, participation in programs and organizations, and land management practices
and the influences of these factors on crop production and soil erosion. We used
instrumental variables (IV) estimation to address the endogeneity of decision vari-
ables such as income strategies, participation in programs and organizations, and
land management decisions when these are used as explanatory variables (e.g., in
the crop production regression).8 We investigated the robustness of the regression
results by comparing the results of ordinary least squares (OLS), instrumental (IV),
and reduced form (RF) approaches.9 We also conducted Hausman (1978) tests
comparing the OLS and IV models.
We used a log-log specification for equations (7.1) and (7.4) (logarithm of
the dependent variable and of all continuous uncensored explanatory variables).
Because there are zero values for some household assets (land, livestock, and equip-
ment) for some households, it was not possible to use a simple logarithmic trans-
formation for these variables. Instead, we included a dummy variable for positive
172
JOHN PENDER ET AL.
asset ownership to allow for an intercept shift for households with zero values for
some assets as well as the logarithm of assets for households that have positive asset
levels. These transformations reduced problems with nonlinearity and outliers,
improving the robustness of the regression results (Mukherjee, White, and Wuyts
1998).
In all models we tested for multicollinearity and found it not to be a serious
problem (variance inflation factors < 5) for almost all explanatory variables (except
for some assets when the logarithmic specification with the intercept shift dummy
variables were used). All parameters were corrected for sampling stratification and
sample weights. Estimated standard errors are robust to hetereoskedasticity and
clustering (nonindependence) of observations from different plots for the same
household. Outliers were detected, and errors corrected where found.10
As in Chapter 5, we predicted the effects of changes in selected variables using
simulations based on the regression results. This analysis was conducted for the
sample as a whole and separately for highland versus lowland subsamples (based on
separate regressions for each of these subsamples), to investigate the extent to which
responses and effects differ in different regions of Uganda.
Income Strategies and Land Management in Uganda
The primary sources of household income reported by the sample households in
the study region include production and sale of agricultural products in general;
production and sale of cereals (especially maize, sorghum, and millet), export crops
(mainly coffee, but also including cotton, sugar cane, and tobacco), root crops (sweet
potatoes, yams, Irish potatoes, and cassava), bananas, legumes, and horticultural
crops (fruits and vegetables); livestock production; forestry and fishing activities;
off-farm work for wages or salary; brewing beer; and various other nonfarm activities
(e.g., petty trade, masonry, carpentry, butchery) (Table 7.1). The most common
crops grown include cereals, legumes, root crops, vegetables, coffee, and bananas.
These income strategies and crop choices vary across regions of Uganda. Pro-
duction of Robusta coffee is primarily in the Lake Victoria crescent region, and
Arabica coffee in the eastern highlands around Mt. Elgon and some other highland
areas (Pender et al. 2001b). Banana production was historically associated with
coffee production in the Lake Victoria region but has been shifting to the south-
west in recent years (Gold et al. 1999). Cereal production is important in most
regions, and root crop production is particularly important in the northern part of
the country (Pender et al. 2001b). Cattle keeping is most important in the lower-
rainfall "cattle corridor," which ranges from lower-elevation zones in the southwest
through parts of central Uganda to the northeastern Karamoja region (Pender et al.
STRATEGIES IN UGANDA: AN ECONOMETRIC ANALYSIS
173
Table 7.1 Descriptive statistics of variables used in econometric analysis
Standard
Number of
Variable
Mean
error
observations
Minimum
Maximum
Household/village-level variables
Primary income source (proportion
of households)
General agricultural production
0.351
0.035
446
0
1
Gifts/donations
0.0050.003
446
0
1
Wages/salary
0.066
0.019
446
0
1
Livestock
0.066
0.020
446
0
1
Nonfarm activities
0.080
0.020
446
0
1
Forestry/fishing
0.0150.007
446
0
1
Brewing beer
0.040
0.012
446
0
1
Legumes
0.0350.009
446
0
1
Horticultural crops
0.011
0.005446
0
1
Bananas
0.072
0.013
446
0
1
Cereals
0.121
0.020
446
0
1
Root crops
0.038
0.006
446
0
1
Export crops
0.101
0.020
446
0
1
Household income (Î1,000 Ush)
1,440.185
179.786
446
ş1,795.1
11,519.17
Income per capita (Î1,000 Ush)
147.272
17.128
446
ş212.6
1,570.136
Agroecological zone (proportion of
households)
Unimodal rainfall
0.137
0.017
451
0
1
Bimodal low rainfall
0.091
0.007
451
0
1
Bimodal medium rainfall
0.189
0.012
451
0
1
Bimodal high rainfall
0.460
0.020
451
0
1
Southwest highlands
0.084
0.00545
1
0
1
Eastern highlands
0.039
0.006
451
0
1
Market access zone (proportion of
households)
Low market access
0.256
0.014
451
0
1
High market access
0.744
0.014
451
0
1
Population density (persons/km2)
219.518
7.145
451
10
962
Physical capital
Area owned (acres)
10.400
2.117
451
0
640
Value of livestock owned
(Î10,000 Ush)
5.646
0.631
451
0
267
Value of equipment owned
(Î10,000 Ush)
1.612
0.233
451
0
80.55
Human capital
Age of household head (years)
46.146
0.87545
1
20
90
Household size
11.198
0.387
451
1
32
Proportion of dependents
0.540
0.012
451
0
1
Highest education of household
head (proportion of households)
Not completed primary
0.521
0.035
451
0
1
Primary
0.331
0.033
451
0
1
Secondary
0.071
0.018
451
0
1
Higher
0.077
0.020
451
0
1
(continued )
174
JOHN PENDER ET AL.
Table 7.1 (continued)
Standard
Number of
Variable
Mean
error
observations
Minimum
Maximum
Sex of household head
(proportion of households)
Male
0.8950.026
45
1
0
1
Female
0.1050.026
45
1
0
1
Participation in organizations
(proportion of households)
Agriculture/environment
0.241
0.032
451
0
1
Credit
0.356
0.032
451
0
1
Poverty reduction
0.107
0.021
451
0
1
Community services
0.464
0.033
451
0
1
Participation in technical assistance
(proportion of households)
Training
0.500
0.034
451
0
1
Extension
0.312
0.032
451
0
1
Availability of credit in village
(proportion of households)
Formal credit
0.260
0.023
451
0
1
Informal credit
0.698
0.024
451
0
1
Plot-level variables
Crop choice (proportion of
plot area)
Cereals
0.210
0.011
1,436
0
1
Legumes
0.129
0.008
1,436
0
1
Root crops
0.191
0.009
1,436
0
1
Vegetables
0.094
0.0051,436
0
1
Coffee
0.1150.010
1,436
0
1
Bananas
0.198
0.011
1,436
0
1
Land management practices
(proportion of plots)
Slash and burn
0.113
0.0151,785
0
1
Inorganic fertilizer
0.017
0.003
1,786
0
1
Manure/compost
0.176
0.014
1,876
0
1
Incorporation of crop residues
0.251
0.025
1,786
0
1
Crop rotation
0.406
0.020
1,786
0
1
Mulch
0.079
0.010
1,788
0
1
Household residues
0.136
0.011
1,786
0
1
Preharvest labor input (person-hours)
366.549
19.141
1,874
0
10344
Value of crop production (Ush)
188,146
18,606
1,876
0
2.61 Î 107
Soil loss (metric tons/hectare
per year)
5.758
0.626
1,584
0.02002
127.0776
Altitude (Î100 meters above
sea level)
13.224
0.383
1,572
10.12
42.09
Distance of parcel (kilometers) to:
Residence
0.538
0.062
1,854
0
32
All-weather road
2.505
0.195
1,854
0
77
Market
4.494
0.268
1,854
0
37
STRATEGIES IN UGANDA: AN ECONOMETRIC ANALYSIS
175
Table 7.1 (continued)
Standard
Number of
Variable
Mean
error
observations
Minimum
Maximum
Tenure of plot (proportion of plots)
Freehold
0.283
0.033
1,861
0
1
Leasehold
0.044
0.014
1,861
0
1
Mailo
0.1850.027
1,861
0
1
Customary
0.488
0.031
1,861
0
1
Formal title of plot held (proportion
of plots)
0.038
0.011
1,861
0
1
How plot acquired (proportion
of plots)
Purchased
0.507
0.032
1,665
0
1
Leased in
0.047
0.013
1,6650
1
Borrowed
0.0350.008
1,665
0
1
Inherited
0.404
0.029
1,6650
1
Encroached common land
0.006
0.0051,665
0
1
Expect to operate plot in 10 years?
(proportion of plots)
No
0.038
0.009
1,861
0
1
Yes
0.933
0.011
1,861
0
1
Uncertain
0.029
0.007
1,861
0
1
Plot area (acres)
2.352
0.635
1,604
0.1
636
2001b). Cotton used to be an important cash crop in parts of eastern, northern,
and western Uganda but has declined over the past few decades because of low
world prices, marketing problems, and conflict (You and Chamberlin 2004). Non-
farm activites such as trading, charcoal making, and brick making are generally
more common in areas of better market access (Pender et al. 2001b).
The most common land management practices used by farmers in the study
villages are crop rotation, incorporation of crop residues, application of household
residues, application of manure or compost, use of slash and burn to prepare fields,
and application of mulch (Table 7.1).11 Slash and burn, crop rotation, and
incorporation of crop residues are most often associated with extensive annual crop
production systems in the east and north (Pender et al. 2001b). Use of manure,
compost, and mulch is most often associated with perennial crop systems in the
Lake Victoria crescent and the highlands (Pender et al. 2001b). Use of fallow has
declined, and use of inorganic and organic sources of soil fertility is still very lim-
ited, contributing to perceived declines in soil fertility and crop yields in most areas
(Deininger and Okidi 2001; Pender et al. 2001b). Average estimated soil erosion
levels are less than 10 tons/hectare per year but are much higher in steeply sloping
areas of the highlands.
176
JOHN PENDER ET AL.
Results of Econometric Analysis
In this section we present results of the econometric estimation of determinants
of the value of crop production and soil erosion and simulations of the effects of
selected interventions.12
Value of Production
The value of crop production is substantially higher on plots where bananas are
grown than where cereals and many other types of crops are grown, controlling for
labor use, land management, agro-ecological potential, and other factors (Table
7.2).13 We do not find statistically significant differences in the value of production
among other types of crops.
Crop rotation reduces the value of production significantly, at least in the short
run. In the longer term, however, crop rotation may contribute to productivity by
helping to restore soil fertility and reducing problems of pests and diseases. We find
no statistically significant and robust effects of other land management practices on
the value of production, controlling for labor use and other factors.
Not surprisingly, the value of crop production on a plot increases with both
plot size and labor use. The elasticities of production value with respect to plot size
(0.580 in the OLS regression) and labor (0.385) imply that production is an approx-
imately constant return to scale: sum of elasticities = 0.965 (standard error =
0.055), which is not statistically different from 1.000 (P = 0.52).
Other factors that significantly affect the value of crop production include agro-
ecological zone (highest in the high-potential EH), primary income source of the
household (higher for households with primary income from production of legumes,
horticultural crops, cereals, export crops, livestock, or nonfarm activities than for
general agricultural producers and lowest for households with primary income
from forestry or fishing), age of the household head (negative effect), amount of
land owned (negative effect), value of livestock owned (positive effect), participa-
tion in agricultural extension and training programs (positive effect), and how the
plot was acquired (lower for inherited than purchased plots).
The negative effect of farm size on value of crop production is consistent with
most of the literature on farm sizeşproductivity effects (e.g., Berry and Cline 1979;
Deolalikar 1981; Carter 1984; Heltberg 1998), indicating that management,
labor, or other constraints limit the ability of larger farmers to be as productive as
smaller farmers. Because we find higher value of crop production even controlling
for labor input, equipment availability, land quality, and other factors, our findings
suggest that smaller farmers attain higher total factor productivity and not only
higher land productivity, a finding that is not well established in the literature. This
finding implies that reallocation of land toward smaller farms, whether through
STRATEGIES IN UGANDA: AN ECONOMETRIC ANALYSIS
177
Table 7.2 Determinants of output value and predicted erosion
ln(Erosion [metric tons/hectare
ln(Output value) (USh)
per year])
Ordinary
Ordinary
least
Instrumental
Reduced
least
Instrumental
Reduced
Variablea
squares
variablesb
form
squares
variablesb
form
Crop choice (share of area)
Legumes
ş0.068
0.752
Root crops
ş0.468*
1.553
Vegetables
0.525
2.523
Coffee
0.098
1.097
Bananas
0.988***
2.090***
Land management practices
Slash and burn
ş0.048
ş0.140
Inorganic fertilizer
0.276
0.028
Manure and compost
0.103
ş1.384*
Crop residues
0.043
0.483
Crop rotation
ş0.201*
ş0.892**
Mulch
ş0.171
ş0.152
Household residues
ş0.093
0.103
Pesticides
0.059
0.620
Integrated pest management
0.158
ş1.369
ln(Preharvest labor use)
0.385***
0.563**
Primary income source
(cf. general agricultural
production)
Gifts/donations
0.230
ş1.026
ş1.189
Wages/salary
0.169
0.348
0.007
Livestock
0.626**
0.457
ş1.006
Nonfarm
0.549***
0.775***
ş0.184
Forestry/fishing
ş0.732***
ş0.720**
0.328
Brewing beer
0.279
0.244
0.061
Legumes
0.490**
0.600*
0.076
Horticultural crops
1.676***
1.159***
ş0.239
Bananas
0.164
0.105ş0.299
Cereals
0.484***
0.575**
0.058
Root crops
0.117
ş0.047
ş0.030
Export crops
0.483***
0.197
0.168
Agro-ecological zone
(cf. unimodal)
BL
0.2950.149
ş0.009
0.611
0.35
4
0.322
BM
0.054
ş0.033
ş0.065
0.151
0.037
0.062
BH
0.291
0.031
0.303
0.084
ş0.187
-0.162
SWH
0.014
ş0.232
ş0.505*
1.951***
2.114***
1.510***
EH
0.672**
0.661
1.008***
1.160***
1.659***
0.940**
Altitude
ş0.450**
0.254
ş0.289
ş2.380*
ş2.774*
-2.612
High market access
0.013
0.122
ş0.085-0.109
(continued )
178
JOHN PENDER ET AL.
Table 7.2 (continued)
ln(Erosion [metric tons/hectare
ln(Output value) (USh)
per year])
Ordinary
Ordinary
least
Instrumental
Reduced
least
Instrumental
Reduced
Variablea
squares
variablesb
form
squares
variablesb
form
Distance (kilometers) to:
Residence
ş0.093*
0.002
ş0.056
0.063
0.067
All-weather road
0.007
0.018*
ş0.002
0.016
0.008
Nearest market
-0.012
-0.015-0.011
0.011
0.023**
ln(Population density)
0.014
0.001
0.152**
0.004
0.077
Assets
Own land
0.3050.3650.031
ş0.341
ln(Area owned)
ş0.097*
ş0.260**
ş0.133**
ş0.007
Own livestock
ş0.828*
ş0.437
ş1.904***
0.355
ln(Value of livestock)
0.068*
0.062
0.156***
ş0.014
Own equipment
0.010
ş0.747
ş0.097
ln(Value of equipment)
0.001
0.060
ş0.011
Education of household head
(cf. not completed primary)
Primary
ş0.155
ş0.276*
ş0.139
0.146
0.117
0.091
Secondary
0.129
0.071
0.0950.441*
0.661*
0.35
7*
Higher education
0.117
0.040
ş0.087
0.541*
0.541*
0.390
ln(Age of head)
ş0.359**
ş0.044
ş0.615***
ş0.271
0.243
ş0.200
Female head
ş0.152
ş0.176
0.469*
0.292
ln(Size of household)
0.011
0.043
0.291**
0.315**
Proportion of dependents
ş0.266
0.039
0.088
ş0.120
Participation in organizations
Agriculture/environment
ş0.168
ş0.349**
ş0.709***
Credit
0.129
ş0.162
ş0.546*
Poverty reduction
0.229
ş0.219*
ş0.733
Community services
ş0.038
ş0.182
0.287
Participation in technical
assistance programs
Training
0.271***
0.331
0.047
ş0.300
Extension
0.287***
0.629
0.167
0.551**
Credit availability in village
Formal credit
0.001
0.248
ş0.234
Informal credit
0.055
0.175
ş0.097
Tenure of plot (cf. freehold)
Leasehold
ş0.436
ş0.273
0.273
0.140
0.551
Mailo
0.217
0.092
ş0.424*
ş0.535**
ş0.334
Customary
0.133
0.271*
ş0.108
ş0.133
ş0.003
Formal title to plot
ş0.306
0.150
ş0.157
ş0.295
STRATEGIES IN UGANDA: AN ECONOMETRIC ANALYSIS
179
Table 7.2 (continued)
ln(Erosion [metric tons/hectare
ln(Output value) (USh)
per year])
Ordinary
Ordinary
least
Instrumental
Reduced
least
Instrumental
Reduced
Variablea
squares
variablesb
form
squares
variablesb
form
How plot acquired
(cf. purchased)
Leased in
ş0.138
ş0.403
ş0.525
ş0.636
ş0.605
Borrowed
ş0.414
ş0.663*
ş0.620*
ş0.327
ş0.230
Inherited
ş0.288***
ş0.253*
ş0.371***
ş0.088
ş0.014
Encroached
ş0.331
ş1.108**
0.178
ş0.061
ş0.155
Expect to operate plot in
10 years? (cf. no)
Yes
ş0.008
ş0.454
ş0.423
ş0.267
Uncertain
0.213
0.040
ş0.052
0.133
Area of plot
0.580***
0.648***
0.876***
ş0.046
ş0.052
ş0.023
Investments on plot
Irrigation
0.790
2.426**
Trenches
ş0.009
0.115
Grass strips
0.046
0.499
Live barriers
ş0.330
ş0.376
Trees
0.030
0.096
Intercept
11.461***
6.986***
15.905***
6.030
6.417*
6.635
Number of observations
930
920
937
1,2951,284
1,295
R 2
0.565
0.308
0.456
0.563
0.493
0.541
Note: Least-squares regressions.
A Hausman test failed to reject OLS model for value of crop production (P = 1.000).
*, **, *** mean reported coefficient is statistically significant at 10 percent, 5 percent, and 1 percent level, respectively.
aCoefficients of plot quality variables (slope, position on slope, soil depth, texture, color, and perceived fertility) and ethnic
groups in reduced form not reported because of space limitations. Full regression results available on request.
bVariables that were jointly statistically insignificant in the OLS regression were excluded from the IV regression.
land reform or the operation of land markets, would be expected to increase pro-
ductivity in Ugandan agriculture.
The significant influences of income sources, controlling for land quality, crop
choice, land management, labor use, and many other factors, suggest that house-
holds pursuing different income strategies acquire skills or have access to informa-
tion or markets that translate into higher value of production and indicates the
importance of considering income strategies to better understand how to increase
agricultural production and incomes in Uganda. Many types of specialized crop
producers and households dependent on livestock or nonfarm activities earn higher
180
JOHN PENDER ET AL.
returns from crop production than general agricultural producers or households
more dependent on extractive activities (forestry and fishing), suggesting that there
are gains from specialization in crop production and also that there may be com-
plementarities between livestock or nonfarm activities and crop production. How-
ever, specialization exposes farmers to increased production and price risks. Thus,
many farmers may prefer to remain diversified in agricultural production despite
lower expected returns.
Participation in agricultural training and extension programs has a positive
and statistically significant effect on value of production in the OLS regression, but
the effects are not statistically significant in the IV regression. This could mean that
these programs tend to work with people who are more productive anyway
(because the IV regression controls for this selection issue), though the coefficients
in the IV regression are similar or larger in magnitude (which would not be the case
if a selection bias were the only reason for the significant effect), and regressions
predicting participation in these programs do not show clear tendencies in this
regard.14 Insignificance of the coefficients of these variables in the IV regressions
may simply be a result of the difficulty of identifying these influences as a result of
the limited number of suitable instrumental variables. Thus, agricultural training
and extension programs appear to be having a positive effect on the value of crop
production, though we are not certain of this because of limitations in the instru-
mental variables available. Participation in other organizations did not have a sta-
tistically significant influence on the value of crop production.
In summary, the regression results for value of crop production suggest that
promotion of several income strategies and agricultural technical assistance pro-
grams can help to boost the value of crop production significantly. There appears
to be potential for profitable expansion of banana production in the study region,
whereas livestock development and nonfarm development appear to be comple-
mentary to increased crop production. The potential effects of improved land
management on the value of crop production are less clear, however.
Erosion
Erosion varies across the development domains in Uganda. Erosion is highest in the
intensively cultivated steeply sloping highlands (SWH and EH zones) and greater
in areas of higher population density (though the effect of population density is
significant only in the OLS regression). Consistent with the effect of population
density, we find that erosion is higher for larger households, controlling for the
amount of land owned by the household.
The positive effect of population density and household size on erosion sup-
ports neo-Malthusian concerns about population-induced land degradation, con-
STRATEGIES IN UGANDA: AN ECONOMETRIC ANALYSIS
181
sistent with findings of recent studies in Ethiopia (Grepperud 1996; Pender et al.
2001a). However, this finding is not consistent with optimistic arguments about
"more people, less erosion" cited by Tiffen, Mortimore, and Gichuki (1994a) for
the Machakos district of Kenya. In that study, the reduction in erosion was influ-
enced by factors other than rural population growth, such as the presence of tech-
nical assistance programs promoting conservation and access to the Nairobi market,
which favored production of high-value cash crops and thus increased the value
of investment in land conservation. It is essential to control for such factors in a
multivariate analysis, as we have done, to more properly assess the effects of popu-
lation pressure (or any other factor) on land degradation.
Participants in organizations focusing on agriculture and environment have
lower levels of erosion on their plots than other households, suggesting that such
organizations are effective in helping to reduce land degradation.
Predicted erosion is lower on mailo land than land under freehold tenure (in
the OLS and IV regressions). This likely is caused by a tendency of mailo land to be
planted with perennial rather than annual crops, however, and may not be related
to the tenure characteristics of mailo land, per se. The fact that there is no statis-
tically significant difference between erosion on mailo and freehold plots in the
reduced form regression, in which ethnicity is included in the explanatory factors,
suggests that the differences found in the other two models result from cultural fac-
tors leading to different cropping choices in mailo areas.
Most other factors considered, including income sources, household assets,
education, participation in technical assistance programs, access to markets, infra-
structure, credit, land title, and tenure security have a statistically insignificant
influence on predicted erosion. Consequently, the evidence presented here does not
support use of policy interventions affecting these factors as a means of addressing
this form of land degradation. It appears that efforts to reduce population pressure
and organizations focusing on agriculture and environment concerns are likely to be
more effective than interventions related to income diversification, infrastructure,
education, credit, or land titling in reducing soil erosion in Uganda. Of course,
there may be indirect effects of some of these interventions on erosion; for ex-
ample, if education were to increase participation in agricultural and environmental
organizations, it could indirectly contribute to reducing erosion.
Potential Effects of Selected Interventions
Several interventions may be considered as possible means of increasing agricul-
tural production and reducing land degradation. We focus in this section on fac-
tors that are found to have statistically significant and robust influences on at least
one of the outcome variables (value of crop production, erosion). Among these are
182
JOHN PENDER ET AL.
population growth, improved access to all-weather roads, improved access to edu-
cation, participation in agricultural technical assistance programs, and participation
in nongovernmental organizations. We explore the potential effects of such inter-
ventions on crop production and erosion using the predicted relationships from
the econometric model, considering both the direct effects of such interventions
based on the results reported in Table 7.2 as well as indirect effects of such inter-
ventions via their effects on households' choice of income sources, participation in
programs and organizations, crops planted, land management practices, and labor
use. We consider effects for the full sample, as well as those on highland and low-
land zones separately, in case there are differential effects.15
Population growth of 10 percent is predicted to have a small and statistically
insignificant influence on the mean value of crop production, but it would increase
predicted erosion by about 2 percent (Table 7.3). The effect of population growth
on erosion is mainly in the highland zones (SWH and EH), with small and statis-
tically insignificant effects of population growth on predicted erosion in the lower-
elevation zones (Table 7.4). This is not surprising, given the steep slopes and dense
population in the highland zones, creating substantial land degradation pressure in
these areas. This suggests that priority should be given to reducing population pres-
sure in the highlands to help reduce soil erosion.
Improved access to all-weather roads is predicted to have a small and statisti-
cally insignificant influence on the value of crop production and erosion, consider-
ing the entire sample. However, when the highlands and lowlands are considered
separately, improved access has differential effects on erosion, with a weakly statis-
tically significant negative effect on erosion (ş5 percent) in the lowlands but a sig-
nificant and robust positive effect on erosion (+5 percent) in the highlands. It may
be that greater road access reduces labor intensity of land management, which
may cause more erosion in the steeply sloping highlands, where labor-intensive
investments in soil and water conservation measures are critical, but less erosion is
found in the lowlands as a result of less intensity of crop production. Whatever the
reason, improved road access appears to have different effects on land degradation
in the lowlands and the highlands.
Universal primary education is predicted to result in an average reduction in
value of crop production and an increase in erosion in the full sample, though nei-
ther of these results is statistically robust. In the lowlands, education is more strongly
associated with both lower value of crop production and higher erosion. In the
highlands, by contrast, improved education is predicted to lead to higher crop pro-
duction. As with population pressure and road access, the influences of education
are location-specific but may involve trade-offs between income and agricultural
production and sustainability.16
Table 7.3 Simulated impacts of changes in selected variables on outcomes
Value of crop production
Predicted soil erosion
Mean of selected variable
(plot level) (percent change)
(percent change)
Variable
Scenario
Before change
After change
Direct effects
Total effects
Direct effects
Total effects
Population density (persons/km2)
10 percent increase
220
242
+0.1
+0.4
+1.6**
+1.6
Distance to all-weather road (kilometers)
All households next to an
2.250
0.000
ş2.2ş
ş0.9
ş3.5ş3.2
all-weather road
Primary education (proportion of households)
Universal primary education
0.480
1.000
ş8.2ş
ş7.7
+8.1
+8.2
Postsecondary education (proportion of
Higher education for all heads
0.078
0.149
ş0.1
ş0.7
+0.5*
+0.3
households)
with secondary education
Agricultural training (proportion of households)
All households receive training
0.502
1.000
+13.1***
+12.2
+2.5
+2.5
Extension (proportion of households)
All households receive extension
0.311
1.000
+18.5***
+13.7
+11.5
+11.5
Agricultural/environment NGOs (proportion of
All households participate
0.241
1.000
ş11.8
ş8.7
ş23.1**şşş
ş23.1
households)
Note: Percentage change in mean predicted values. Simulation results for direct effects based on predictions from OLS model regressions reported in Table 7.2. Results of regressions predicting
choices of income sources, crops, land management practices, and labor use were used to predict indirect impacts.
*, **, *** mean direct effect is based on a coefficient that is statistically significant in the OLS regression at 10, 5, or 1 percent level, respectively. Statistical significance of indirect effects not
computed.
+, ++, +++ and ş, ş ş, ş ş ş mean direct effect is of the sign shown and statistically significant in the IV regression at 10 percent, 5 percent, or 1 percent level, respectively.
RCoefficient is of the same sign and statistically significant in the reduced form regression. Because participation in agricultural training, extension, and organizations were excluded from the
reduced form regressions, the robustness of the total effects for these variables could not be shown.
Table 7.4 Simulated impacts of changes in selected variables on outcomes, lowlands versus highlands (total effects)
Lowlands (BL, BM, BH, and U zones)
Highlands (SWH and EH zones)
Value of crop
Value of crop
production
Soil erosion
production
Soil erosion
(percent
(percent
(percent
(percent
Variable
Scenario
Before
After
change)
change)
Before
After
change)
change)
Population density (persons/km2)
10 percent increase
207.9
228.7
+1.1
+0.6
308.6
339.5ş5
.0**
+2.8**R
Distance to all-weather road (kilometers)
All households next to an
2.161
0.000
ş0.9
ş5.3*ş
2.9150.000
ş2.9
+4.5
***+R
all-weather road
Primary education (proportion of
Universal primary education
0.483
1.000
ş11.1**şşş
+6.7*
0.462
1.000
+42.1*++
+12.5
households)
Postsecondary education (proportion of
Higher education for all heads
households)
with secondary education
0.077
0.155
ş0.7
ş0.5
0.078
0.106
+0.3
+0.4R
Agricultural training (proportion of
All households receive training
0.508
1.000
+12.5***+++
+1.9
0.457
1.000
ş16.9
+13.3**
households)
Extension (proportion of households)
All households receive extension
0.321
1.000
+10.8***
+14.6
0.227
1.000
+12.0
+33.4***
Agricultural/environment NGOs
All households participate
0.254
1.000
ş10.7**
ş19.5***şşş
0.154
1.000
+115.9**
ş29.4***
(proportion of households)
Note: Percentage change in mean predicted values. Simulation results for direct effects based on predictions from separate OLS model regressions for highland and lowland subsamples. Results
of regressions predicting choices of income sources, participation in programs and organizations, crops, land management practices, and labor use were used to predict indirect impacts.
*, **, *** mean direct effect is based on a coefficient that is statistically significant in the OLS regression at 10 percent, 5 percent, or 1 percent level, respectively. Statistical significance of indirect
effects not computed.
+, ++, +++ and ş, ş ş, ş ş ş mean direct effect is of the sign shown and statistically significant in the IV regression at 10 percent, 5 percent, or 1 percent level, respectively.
RCoefficient is of the same sign and statistically significant in the reduced form regression. Because participation in agricultural training, extension, and organizations was excluded from the
reduced form regressions, the robustness of the total effects for these variables could not be shown
STRATEGIES IN UGANDA: AN ECONOMETRIC ANALYSIS
185
Agricultural technical assistance, whether through longer-term training pro-
grams or short-term extension visits, is predicted to increase the value of crop
production significantly. For the full sample, universal participation in agricultural
training programs would lead to a predicted 12 percent increase in the value of
crop production, while universal participation in extension increases predicted pro-
duction by 14 percent. The positive influence of these programs are greater in the
lowlands. In the highlands, the effects on production are statistically insignificant,
and such programs are associated with more soil erosion. Thus, agricultural techni-
cal assistance programs appear to have had more beneficial effects in the lowlands.
Trade-offs between environmental and production objectives may result from
participation in nongovernmental organizations (NGOs), but this is also location-
specific. Universal participation in NGOs focusing on agriculture and environmental
issues is predicted to reduce soil erosion in the full sample by 23 percent, with sig-
nificant effects in both the highlands and lowlands, though with a larger influence
in the highlands. However, such participation is predicted to reduce the value of
crop production in the lowlands but increase it in the highlands. By emphasizing
labor-intensive technologies to conserve soils, such organizations are able to reduce
soil erosion, but apparently at the expense of crop production in the near term in
the lowlands. Although such near-term losses may be recouped in the longer term,
they undoubtedly contribute to the low adoption of conservation practices by most
small farmers. In the highlands, the technologies being promoted have more bene-
ficial immediate effects on production, probably by helping to conserve soil moisture
as well as soil. In steeply sloping highland areas, soil moisture is usually a more impor-
tant constraint on production than in lowland areas, and measures to conserve soil
moisture may thus have more immediate influence (Shaxson 1988).
Other interventions that may contribute to increased value of crop produc-
tion, based on the regression results reported in Table 7.2, include promotion of
specialized crop production, livestock keeping, and nonfarm activities as income
strategies, investments in irrigation, and improved access of small farmers to land
(given the inverse farm sizeşproductivity relationship). Some factors that are com-
monly thought to be important were found to have mostly insignificant influences,
including access to markets and credit, land tenure, and ownership of a title. How-
ever, it appears that development of land markets can contribute to more intensive
and higher-value production (since we find higher value of output on purchased
than inherited plots).
Conclusions and Implications
The results of this study generally support the Boserupian model of population-
induced agricultural intensification but do not support the optimistic "more
186
JOHN PENDER ET AL.
peopleşless erosion" hypothesis (Tiffen, Mortimore, and Gichuki 1994a). House-
holds in more densely populated communities and smaller farms were found to
be more likely to adopt some labor-intensive land management practices (Nkonya
et al. 2004), and smaller farms obtain higher value of crop production per hectare.
However, population pressure contributes to soil erosion and lower crop produc-
tion in the highlands. Efforts to reduce population pressure in the highlands may
thus produce "win-win" outcomes, helping to both increase agricultural productivity
and reduce land degradation.
Agricultural technical assistance programs have important effects on agricul-
tural production and land degradation, contributing to higher value of crop produc-
tion (especially in the lowlands) but also to soil erosion in the highlands. By contrast,
NGO programs focusing on agriculture and environment are helping to reduce
erosion but have mixed influences on production. The effects of technical assis-
tance thus can be very location specific and involve trade-offs between agricultural
production and land degradation. This suggests the importance of a demand-driven
community-based approach to such programs, in order to ensure that location-
specific factors and trade-offs can be adequately considered. Development and
promotion of combination technologies that can enhance agricultural productivity
and conserve soils and that are suited to local conditions should be a high priority
for such programs.
We find little evidence of effects of access to markets, roads, and credit on
agricultural intensification and crop production, though road access appears to
contribute to land degradation in the highlands, again emphasizing the location
specificity of effects. This is not to say that such factors will be unimportant in
the longer-term. As agricultural modernization and commercialization proceeds in
Uganda, access to markets and credit are likely to become much more important.
Land tenure and land title were also found to have limited influences on agri-
cultural production and land degradation. This is because the most common forms
of tenure are relatively secure and transferable, and access to credit is not a critical
factor affecting agricultural production, as noted above. As agriculture becomes
more commercialized, the demand for formal titles in order to increase access to
formal-sector credit is likely to increase, however.
Improving education is critical for increasing household incomes (Nkonya et
al. 2004), but this is not solving problems of low agricultural productivity and land
degradation. By increasing household members' income opportunities off the farm,
education may reduce small farmers' effort to produce agricultural output or to
conserve soil. Such potential trade-offs do not mean that investments in improved
education should not be pursued, but other means may be needed to address low
productivity and land degradation. Including teaching on principles of sustainable
STRATEGIES IN UGANDA: AN ECONOMETRIC ANALYSIS
187
agricultural production in educational curricula might help to minimize negative
effects or even have positive effects on agricultural production and sustainable land
management.
We do not find evidence of a povertyşland degradation trap, given that erosion
does not depend significantly on asset ownership. Asset poverty has mixed effects
on agricultural productivity depending on the type of assets considered: smaller
farms obtain higher value of crop production per hectare, and households with
fewer livestock obtain lower value of crop production. These findings suggest that
development of factor markets (e.g., for land and livestock) can improve agricul-
tural efficiency. Also consistent with this is the finding that owners of purchased
land obtain higher value of crop production than owners of inherited land.
Several other factors that contribute to increased value of crop production,
without significant effects on land degradation, include specialized crop produc-
tion, livestock and nonfarm income strategies, and irrigation. The effect of income
strategies on value of crop production suggests the importance of development of
human and social capital required to pursue such strategies in increasing house-
holds' ability to identify and exploit market opportunities in agriculture. Interven-
tions to promote livelihood diversification as well as investments in irrigation thus
can contribute to agricultural growth.
In general, the results imply that the strategies to increase agricultural produc-
tion and reduce land degradation must be location-specific and that there are few
"win-win" opportunities to simultaneously increase production and reduce land
degradation. Interventions must be tailored to local circumstances, and trade-offs
among different outcomes may often occur. There is no "one-size-fits-all" solution
to the complex problems of small farmers in the diverse circumstances of Uganda.
Thus, a demand-driven approach to development programs will be crucial.
Notes
1. This empirical model is derived from a theoretical dynamic household model, which is
presented in Nkonya et al. (2004). The empirical model is quite similar to the model presented in
Chapter 5, but there are some important differences (e.g., inclusion of annual crop choice in the
model and estimation of determinants of erosion). Hence, we present the model in an abbreviated
form, focusing only on the outcome variables discussed in this chapter. A complete exposition of the
model can be found in Nkonya et al. (2004) and Pender et al. (2004b).
2. These factors are explained fully in Nkonya et al. (2004) and Pender et al. (2004b) and
are very similar to the determinants of land management discussed in Chapter 5.
3. In the empirical work we use the logarithm of erosion as the dependent variable; thus the
assumption that the error term in equation (7.2) is additive is equivalent to assuming a multiplica-
tive error in the level of erosion. This assumption is consistent with the multiplicative form of the
RUSLE.
188
JOHN PENDER ET AL.
4. Although soil conditions are also important in determining agricultural potential, no
attempt was made to include soils in the classification because of limitations in the available soil data
and the high degree of spatial variability in soil quality. Thus, the map in Figure 7.1 does not fully
represent "agricultural potential," though it represents agroclimatic zones.
5. Credit access was measured at the village level to address concern about endogeneity of
household level use of credit.
6. The districts included in the project study area include Kabale, Kisoro, Rukungiri, Bushenyi,
Ntungamo, Mbarara, Rakai, Masaka, Sembabule, Kasese, Kabarole, Kibale, Mubende, Kiboga,
Luwero, Mpigi, Nakasongola, Mukono, Kamuli, Jinja, Iganga, Bugiri, Busia, Tororo, Pallisa, Kumi,
Soroti, Katakwi, Lira, Apac, Mbale, and Kapchorwa.
7. The analytic approach is described fully in Nkonya et al. (2004).
8. The ethnicity of the household was used as an instrumental variable to predict income
strategies and participation in programs and organizations. Other instrumental variables were iden-
tified by hypothesis testing: variables that were jointly statistically insignificant in the full version of
the models for equations (7.1) and (7.4) were dropped from the regression and used as instrumental
variables.
9. The reduced form regressions exclude endogenous decision variables such as income
strategies, participation in programs and organizations, and land management practices. The coeffi-
cients in these regressions thus reflect total effects of exogenous or predetermined factors on the
outcome variables, allowing for indirect impacts that such factors have on the outcomes by affecting
the endogenous decision variables as well as direct impacts. The coefficients of exogenous and pre-
determined factors in the structural OLS and IV regression models reflect only their direct effects on
the outcomes, controlling for the endogenous decision variables that are also included in the models.
Thus, the coefficients in the reduced form models are not expected to be the same as those in the
OLS or IV models because they are reflecting different effects. Nevertheless, it is instructive to investi-
gate robustness of results across all three models.
10. Two households were dropped from the analysis because they own more than 300 acres of
land and are not representative of the vast majority of farmers in Uganda. All remaining households
owned less than 100 acres of land, and the average farm size for these was 8.2 acres.
11. Household residues include kitchen waste and other residues from the household. Com-
post includes vegetative wastes (usually from crop production) combined with manure.
12. Other econometric results are presented in Nkonya et al. (2004).
13. Variables that were jointly statistically insignificant in the OLS regression were dropped
from the IV regression (P = 0.57), and multicollinearity is a problem only for the equipment and
livestock variables in the OLS and RF regressions (maximum VIF = 20 for ln[equipment value]). A
Hausman test of the OLS versus IV models could not reject the hypothesis of no specification error
in the OLS model (P = 1.000), which is thus preferred.
14. The only factors found to have a statistically significant impact on participation in ex-
tension programs are distance to a tarmac road (more participation further from a road) and eth-
nicity. The only factor having a statistically significant impact on participation in agricultural
training programs is education (higher participation for more educated household heads). These
findings do not clearly indicate that participants in technical assistance programs are households
that would tend to be more productive in the absence of extension because these factors are found
to not have significant direct effects on the value of crop production. Regression results are avail-
able on request.
STRATEGIES IN UGANDA: AN ECONOMETRIC ANALYSIS
189
15. As noted previously, separate regressions were run for highland and lowland subsamples
but are not reported here to save space. These regression results are available from the authors on
request.
16. Influences of education on household income are shown to be positive in Nkonya et al.
(2004).
C h a p t e r 8
Agricultural Enterprise and Land
Management in the Highlands of Kenya
Frank Place, Jemimah Njuki, Festus Murithi, and Fridah Mugo
This chapter focuses on the management of agricultural land by smallholder
households in the highlands of Kenya. It draws mainly from several recent
studies from the central highland areas near to the south and west of Mt.
Kenya and the western highland areas to the north and west of Kisumu, which
were led by the authors. The chapter also draws from a set of studies under the
KAMPAP project.1 See the appendix for a description of the key papers used in
this synthesis. The main purpose of this synthesis is to understand constraints and
opportunities for improving agricultural productivity in a sustained manner. The
comparison between the central and western highlands offers considerable insights
because one area consists of relatively dynamic and productive agricultural systems
(central), and the other is relatively stagnant and unproductive (western).
The fact that very diverse agricultural and livelihood outcomes emerge from
fairly similar initial physical-climate conditions is not unique to Kenya but occurs
throughout the highlands of east and central Africa. It is hoped that this detailed
synthesis and analysis will help to indicate research, development, and policy steps
that can bring about positive changes in the areas beset by poverty. Specifically, this
chapter attempts to:
1. describe agricultural systems in the Kenya highlands including enterprise
choice, investment behavior, and impact on productivity and income,
2. identify factors behind different agricultural strategies pursued by households,
and
192
FRANK PLACE ET AL.
3. develop feasible recommendations that can benefit the development of poor
communities and poor households.
The Study Sites
In this study, we focus on the central and western Kenya highlands (see Figure 8.1
in the color insert for a map of the study sites). The reason for this is that they are
similar in terms of rainfall and population density. In both cases, rainfall is ample
(mainly between 1,400 and 1,800 millimeters) and can accommodate two crop-
ping seasons. Population density ranges between 350 and 1,000 persons per square
kilometer in most of the central and western highlands so that average farm sizes
are between 0.5 and 2 hectares. The highland areas lying between the central and
western parts (i.e., those in the Rift Valley Province) are different in that they are
comprised of a disproportionate number of larger commercial farms.
Central Highlands
The central highlands lie between Nairobi and the slopes of Mt Kenya with an alti-
tude ranging from 1,500 to 2,000 meters above sea level. Rainfall is bimodal and
averages from 1,300 to 1,800 millimeters per year. There are two cropping seasons,
with the long rain season starting from mid-March through July and the short rain
season from mid-October through December. Our data are principally from Embu
and Kirinyaga Districts, which are positioned to the south and west of Mt. Kenya.
Most of the area is covered by clay soils except for a small area that is covered by
loam soils. The soils are deep and well drained and are of good fertility. The aver-
age annual maximum temperature is as low as 20░C in the upper portions of the
districts.
The TeaşDairy Zone is located at higher elevations with precipitation rates
of 1,800 millimeters per year, a very long cropping season, and good yield poten-
tial. The CoffeeşTea Zone at a slightly lower altitude has an average annual rainfall
of 1,400 to 1,800 millimeters with a long cropping season and a medium-length
cropping season. The Main Coffee Zone has a medium and a short to medium crop-
ping season with an average rainfall of 1,200 to 1,500 millimeters. Finally, the
Marginal Coffee Zone is at the lowest altitude of the districts and has a medium to
short and a short cropping season and an annual average rainfall of 1,000 to 1,250
millimeters.
Population densities are high throughout the two districts, averaging over 400
persons per square kilometer in the more favorable agricultural zones. There is a
high-quality tarmac road cutting through the districts and eventually leading to
Nairobi. There are few other tarmac roads in the districts, however. Most roads are
LAND MANAGEMENT IN THE HIGHLANDS OF KENYA
193
dirt and are generally of good quality but, because of their high clay content, can
become problematic during the rainy season. Piped water is not uncommon in the
districts, but telephone and electricity are generally not available in the rural areas.
The trade and marketing sector is quite active and innovative in central Kenya,
encouraging the growth of commercial enterprises. All in all, central Kenya enjoys
a relatively low rate of poverty compared to other provinces, with rural poverty
rates ranging between 30 and 40 percent of the population (Republic of Kenya
1997).
Western Kenya
Similarly to central Kenya, there are two cropping seasons in western Kenya: the
long rains from March to July and the short rains from September to November,
with rainfall amounts ranging between 1,500 and 1,900 millimeters per annum.
During the past decade, rainfall in the western Kenya highlands has been very reli-
able, perhaps the most favorable in all of Kenya. The altitude in the main study
areas of Vihiga and Siaya Districts is between 1,400 and 1,700 meters above sea
level. The topography has frequent ridges and valleys with a large area of moder-
ately sloping land. Soils are deep and well drained. The area is considered to be of
medium to high potential for agriculture, but soils are highly degraded from agri-
cultural activities.
There is less variation in rainfall among our western Kenya sites than in central
Kenya because of the influence of Mt. Kenya near the central Kenya sites. Al-
though a sizable portion of the study area could accommodate tea or coffee as in
central Kenya, these are largely absent from the landscape with the exception of
sites near the single tea factory in Vihiga District. Instead, the predominant pro-
duction system is production of seasonal crops during two seasons each year.
Rural population densities in some areas of western Kenya (e.g., Vihiga) are
the highest in all of Kenya (at over 1,000 per square kilometer). Two main ethnic
groups are found in the area, the Luhya (Vihiga) and the Luo (Siaya). There is a
fairly dense road network, but the roads are of poor quality, including tarmac roads
that are in disrepair. Other infrastructure such as telephone lines, water, and elec-
tricity is equally lacking. The potential for accessing markets is high, but actual
commercialization of agriculture is lower in these areas than in nearby districts.
The districts host a large number of NGOs that are active in agriculture. In terms
of poverty rates, Vihiga and Siaya rank as among the very poorest of the districts
with relatively high agricultural potential, with poverty rates of 58 percent and
62 percent, respectively (Republic of Kenya 1997).
Much of the data from western Kenya are derived from studies in 17 villages in
Siaya and Vihiga Districts. Some results are from a census of over 1,600 households,
194
FRANK PLACE ET AL.
whereas others are from smaller subsets of them. The locations are very represen-
tative of most of Vihiga: very small farms and predominance of maize/bean farm-
ing.2 Siaya District contains both highland and midland areas, but our sample is
derived exclusively from the higher potential highland areas. There have been
numerous studies in these villages, and sampling procedures have differed depending
on the objective of the research. The individual studies are cited in the text so that
more details of the data and households can be found by the reader. In central
Kenya, our samples are drawn mainly from the coffee- and tea-growing areas,
where dairy farming is also common. Two of the studies, however, do include
some households in the lower-potential areas where maize production becomes
more important. Most of the households in these studies were selected at random,
although some have used different stratification methods. Again, these are cited in
the text.
Household Resources and Agricultural Enterprises
Household Resources
Nuclear households are the main decisionmaking units over farming (in the sense
that sons and their wives form their own household and manage their affairs with-
out much influence of the parents) in both the central and western highlands.3
These independent households are becoming increasingly diverse and complex
as a result of the ravaging of HIV/AIDS and the pursuit of alternative livelihood
options because of the small farm sizes. Western Kenya households seem to be
much more affected, as for many years the number of female-headed households
(in which the husband was working off-farm) has been high, around 30 percent of
the population (Wangila, de Wolf, and Rommelse 1999). The mobility of individ-
uals along with the effects of high death rates has led to the observance of many
households headed by widows or composed of nonnuclear members. On the other
hand, monogamous male-headed households are the majority in the central Kenya
sites, as shown by recent studies (Murithi 1998; Njuki 2001).
The large outflow of men from households, especially in western Kenya, not
only results in loss of male labor but increases the difficulty for households to make
certain types of decisions regarding farm investment. Mugo (1999) shows that when
husbands are away, there is considerable variation in the extent to which women
are able to make decisions over land management. In terms of labor, men generally
provide important roles in land preparation, cutting of trees, and caring for live-
stock. Women can assume these roles too, but their time is squeezed by other
demands. The presence of two adults also enables households to simultaneously
LAND MANAGEMENT IN THE HIGHLANDS OF KENYA
195
practice good husbandry on their own land while earning cash by working off
the farm. With a single adult, there are more serious trade-offs in selecting one
or the other option.
In terms of available labor, given the high population densities in the highland
areas, there is a large aggregate pool of local labor. But this does not translate
directly into available labor for agriculture. First, many of the individuals are of
school-going age and have only limited hours during the day to assist on the farm.
Second, many of the educated young adults show relatively little interest in agri-
culture.4 Last, agricultural wages must compete with other types of employment
to attract workers. Where wages are attractive, there do not appear to be cases of
observed labor shortages in Kenya, even when demand is high or seasonal. Thus,
the relatively attractive piece rate wages for tea and coffee5 harvesting lead to suffi-
cient labor supplies in the central highlands. In western Kenya, there appears to
be poor management of farm enterprises despite the presence of high manşland
ratios. The reasons seem to be multiple, including lack of interest in working the
land by the youth, lack of cash on the part of farmers, and low returns to the pre-
dominantly cereal-based production system.
The high population densities in both highlands imply that farm sizes will
be small. The average farm size near the slopes of Mt. Kenya is between 1.0 and 2.0
hectares. Murithi (1998) found a mean of 1.9 hectares in the coffee zone. In nearby
districts, a mean of 1.3 hectares was reported by Argwings-Kodhek et al. (1999). In
most areas of the western Kenya highlands,6 average farm size is somewhat lower,
at between 0.6 and 1.0 hectares (Argwings-Kodhek et al. 1999; de Wolf and Rom-
melse 2000). As in most places in Africa, there is a noticeable variation in holding
size, but there are very few large farms. For example, in the western Kenya sites, the
range in farm sizes within a village is generally from 0.2 to 5 hectares. In both
regions, farms consist mainly of a single parcel of land that is often in a narrow strip
running from the top of a ridge (where the road and house are) down slope, pos-
sibly to a valley bottom. Land is acquired mainly through inheritance, but land
purchases also occur, and tenure is considered to be secure. One difference is that
in central Kenya most farmers hold titles to land, but in western Kenya, many
farmers do not bother to update titles that are often in the name of their father.
Although both land and labor are limiting in certain cases, most farmers men-
tion lack of cash as the most critical constraint. This stems from lack or irregularity
of income, weaknesses in credit markets, and high demands for expenditures, both
anticipated and unexpected. Expenditure needs are relatively high in Kenya because
of the need to contribute to education and health services through cost sharing. In
addition, unexpected expenditures related to increased numbers of funerals have
stretched capacities of many households. Significant amounts of credit are available
196
FRANK PLACE ET AL.
only through membership in coffee or tea cooperatives. Other sources are infor-
mal, for example, through small community-based groups that generally provide
modest resources. Income sources and sizes vary considerably across the highlands
of Kenya, and these are analyzed in more detail in a later section. The net result of
all these factors is that cash flow is often the main focus of management of house-
holds. Cash flow management leads to the foregoing of purchase of inputs, the
hiring out of one's labor rather than working on one's land, and the searching for
water and firewood over long distances rather than buying the resources on the
market.
Current Agricultural Enterprises
Crops. Data on crop enterprises in western Kenya comes from a 1997 survey of all
households (about 1,600) residing in a pilot area for agroforestry testing. Maize
was the most predominant crop in these 17 villages, with only 10 households not
growing any. Other common crops include local beans, bananas, cassava, sweet
potatoes, kale/cabbages, and napier. Another set of crops, sorghum, tomatoes, and
groundnuts, were grown by fewer than 50 percent of farmers. Sugar cane, which
is the major crop produced purely for income, was grown by 31.2 percent of the
households. Among the crops in Table 8.1, the mean and median number grown
per farm is six.7 Despite the large number of crops found on a given household,
maize or maizeşbean intercrops dominate the area under cultivation. For example,
Table 8.1 Crop production in western Kenya for 17 villages in Siaya and Vihiga districts
Number
Percentage of
Percentage mainly
of valid
households
for own
Percentage mainly
Crop
responses
growing
consumption
for market
Maize
1,714
99.4
91.4
7.9
Hybrid maize
1,714
14.6
Local beans
1,714
96.3
89.6
6.7
Bananas
1,713
84.5
68.9
15.5
Cassava
1,711
74.5
70.0
4.4
Sweet potatoes
1,71074.2
71.7
2.5
Kale/cabbages
1,712
56.5
42.2
14.1
Sorghum
1,713
36.8
35.4
1.4
Tomatoes
1,712
12.1
8.6
3.3
Groundnuts
1,152
5.3
3.7
1.1
Sugarcane
1,147
31.2
23.5
7.5
Woodlots
1,697
79.8
57.9
21.6
Napier
1,71042.0
36.7
5.2
French beans
1,701
2.1
2.1
Tea
1,607
0.1
0.1
Source: Wangila, de Wolf, and Rommelse (1999).
LAND MANAGEMENT IN THE HIGHLANDS OF KENYA
197
Owuor (1999) found that 66 percent of cultivated area was under maize in the
western highlands.
In central Kenya, the major crops on farms are maize, beans, potatoes, veg-
etables (kales, tomatoes, spinach, onion, among others), french beans, and yams
among annuals and coffee, macadamia, bananas, avocado, mango, tea, passionfruit,
sugar, miraa,8 and papaya among perennials. Njuki and Verdeaux (2001) found
that farmers were growing an average of six different crops in the coffee and tea
zones of Embu and Kirinyaga. This was more than the average number of crops in
the adjacent lower zones (with lower rainfall and population density). With respect
to the type of crops grown, farmers in the uplands grow crops more for the market
than those in the lowlands. Market-oriented crops include tea, coffee, and horti-
cultural commodities such as tomatoes, kales, cabbages, and fruit. Owuor (1999)
found that a large portion of area was devoted to traditional industrial crops such
as coffee and tea (27 percent) and to horticultural crops (19 percent). On the slopes
of Mt. Kenya, the proportion of area under coffee was similar (26 percent) to that
of maize monocrop or intercrops (28 percent) (Murithi 1998).
Thus, it is found that farmers throughout the western and central highlands
produce a variety of crops, even on small farms, as population pressure intensifies.9
Commercialization does not appear to alter the number of crops grown by small-
holder farmers and indeed appears to increase the level of diversity according to
area by reducing the "traditional" high allocation of land to cereals and substituting
an array of market-oriented crops in their place. We shall come back to this point
later in the analytic sections.
Livestock. Livestock production in the western Kenya system is mainly based
on a semi-intensive dairy-meat-draft-manure system. This is largely with indige-
nous animals, as only 3 percent of the nation's dairy animals are found in the Western
Province. On the other hand, the Western Province has 10 percent of the national
indigenous herd. Because of land scarcity, confined grazing on farms or roadsides
is dominant. This makes it relatively easy to collect manure, and indeed, this is the
most widely used crop nutrient source, though in modest amounts (Place et al.
2002a). Livestock production in the area is based on local cattle and poultry, with
few sheep, goats, or pigs, as shown in Table 8.2. The livestock population is notably
small in the area, most likely because of livestock diseases, lack of veterinary services,
and shortage of browse caused by land scarcity. Herd sizes are also difficult to in-
crease or maintain because of cultural obligations such as funerals.
A large majority of households own cattle in the central highlands, as many
as 90 percent in some areas. Among the farmers who own cattle, the average num-
ber held is 2.3 per household (Murithi 1998), nearly all being improved breeds or
198FRANK PLACE ET AL.
Table 8.2 Livestock numbers in highland households of Siaya and Vihiga Districts, western Kenya
Percentage
Average herd/flock
Average herd/flock
of farms
size
size (households
Livestock type
Farms
Animals
with animals
(all households)
with animals)
Improved cows
1,702
178
4.3
0.11
2.41
Local cattle
1,703
2,051
53.3
1.20
2.26
Sheep and goats
1,703
771
16.9
0.45
2.68
Pigs
1,699
8
0.3
0.01
1.60
Poultry
1,642
7,738
72.3
4.71
6.52
Source: Wangila, de Wolf, and Rommelse (1999).
crossbreeds. All but about 6 percent are managed in zero grazing units (Murithi
1998). Cattle are raised mainly for milk production, with manure being the second
most important reason. Farmers in the midlands have the highest number of goats:
1.06 compared to 0.92 in the uplands (the tea zone). Improved dairy goat breeds
are increasing in number over recent years, spurred on by the Dairy Goat Associa-
tion of Kenya. As is common throughout the highlands, central Kenya farmers keep
a large number of poultry, and there are more cases of commercial enterprises than
in western Kenya.
Tree growing. Western Kenya is characterized by three types of tree-growing
practices. The first is the management of small private woodlots by farmers. As
shown in Table 8.1, 80 percent of Siaya and Vihiga highland farmers had a wood-
lot on their farm. The woodlots consist overwhelmingly of Eucalyptus spp., which
are popular with farmers because of their fast growth, straight trunks, and coppic-
ing ability (regrowth from the stump). Eucalyptus trees are considered to be best
for poles, but their use for fuelwood is also growing (as other species become rarer).
In addition to eucalyptus woodlots, other timber trees such as cypress and Mark-
hamia are grown on boundaries or near homesteads. The other common trees are
tropical fruit species such as papaya, mango, and avocado. These are also found
on most farms near homes, but are few in number, one or two per household.
On average, farmers in Vihiga District had about 160 trees on their farms (Mugo
1999).
In central Kenya, the dominant tree on the landscape is Grevillea robusta,
which was found to be grown by 86 to 94 percent of households on their bound-
aries (indeed, it is used to demarcate boundaries) (Mugo 1999; Njuki 2001). On
average, there are fewer trees per farm in central Kenya, mainly because of the
lack of woodlots as a result of the strong competition with other profitable enter-
prises. The average reported by Mugo (1999) for Kirinyaga was about 130 per
LAND MANAGEMENT IN THE HIGHLANDS OF KENYA
199
household, and Njuki (2001) found about 90 trees for wood on farms in the same
farming zone.
Apart from Grevillea, fruit and nut trees are also common and have been re-
ported on about 64 percent of farms. Among these, macadamia trees are the most
well known and provide a good income. Macadamia was first introduced in the
1970s on a very small scale, and later they became more and more popular as an
alternative cash crop. The traditional varieties were replaced by the grafted, shorter
maturing, and more productive varieties as the market for macadamia grew. Avo-
cado is also common in the central highlands, as are mango, papaya, and guava.
Fodder trees are increasing in popularity because of the relatively large proportion
of dairy farmers in central Kenya. In one area studied, Murithi (1998) showed that
about 20 percent of dairy farmers had planted some type of fodder tree.
Agricultural Investment
In traditional agricultural development models, at low levels of population density
and rudimentary access to markets, households would produce a wide variety of
foods for subsistence needs. As markets developed, households would specialize
into fewer commodities, generating surpluses in some, and obtain desired con-
sumption baskets through market exchanges. In the central Kenyan highlands, this
model has not followed to form (see above on the lack of specialization). First, the
degree of specialization for the subsistence-oriented households in the highlands
is more than might be predicted because maize is the primary staple food, domi-
nating dietary intake. For instance, Rommelse (2001a) found that over 73 percent
of energy consumed by households in Vihiga and Siaya comes from maize alone.
Thus, a subsistence-oriented household will devote much of its land to maize with
small amounts for complementary vegetables.
As population pressure intensified and farm sizes fell, there were essentially
four options for households: (1) increase landholdings through purchases, (2) inten-
sify production and increase yields from maize or other existing staples, (3) substi-
tute into new agricultural enterprises, or (4) diversify livelihood strategies off farm.
The first option is possible in the highlands, but finding additional land in close
proximity to existing landholdings is not simple, and moreover, the poorest house-
holds would not afford the selling prices for land. Thus, it is a very limited option
viable only for a minority of households.
The second option has been available for many years through the use of
improved seed varieties and fertilizer, but high costs and lack of credit have
limited the use of this option. More recent organic nutrient management systems
have also been developed and disseminated in many highland areas. A major limi-
tation of these components of the second option is that even with an increase in
200
FRANK PLACE ET AL.
yields, households with farms of 1 hectare or less will struggle to produce enough
maize. Moreover, the low value of maize per hectare means that its exchange value
for other needed items (e.g., medicines, schooling) is very low. This option has
been emphasized primarily by Rift Valley farmers who still retain relatively large
farms (this is the prime maize-growing belt of Kenya with many medium-scale
farmers).
The third option of diversifying into higher-value agricultural enterprises is a
strategy pursued by many farmers in the central highlands of Kenya. It is a strategy
that requires good access to markets and the ability to produce a range of higher-
value crops at a profit. As shown in the following section, Njuki and Verdeaux
(2001) show that central Kenya farmers have adopted many new enterprises over
recent decades.
The fourth option of diversifying out of agriculture is one that is pursued to
some degree in almost all rural areas of Kenya. Argwings-Kodhek et al. (1999)
report that nonfarm income is important in all regions. The nature and level vary
across districts, and there is evidence that higher absolute levels of nonfarm income
are positively associated with higher absolute levels of farm income. Thus, option 4
may be complementary with options 2 and 3.
All four options may be mutually reinforcing. Which one is likely to drive the
other and under what circumstances is an important but generally unexplored area
of analysis. Investments in education have clearly helped reduce poverty rates
among households later formed by the recipients (Republic of Kenya 1997). There
are examples of agriculture-led and non-agriculture-led poverty reduction from
both regions. In the past, it could be argued that commercialization of agriculture
was a major driving factor in poverty reduction in central Kenya. Now, there are
increasing examples of retired or retrenched urban workers investing their savings
or pensions in agriculture. Which option is best appears to be partly driven by loca-
tional factors (e.g., climate, market access) but also by household-level factors because
there remains significant heterogeneity in resources and capabilities among house-
holds (see Jayne et al. 2003b for the inequality of landholdings in Kenya). We shall
now explore some of the agriculture-based opportunities in more detail, including
the extent to which they are accessible to the different regions and different house-
holds within each.
New crops or crop mixes. One of the strategies farmers have used to cope with
reduced land sizes and changes in livelihoods has been crop diversification. In the
central highlands, Njuki and Verdeaux (2001) found that farmers were growing
between six and seven crops because of reduction in land size, loss of market for old
crops, and opening of new markets for new crops. Area under annual crops can
LAND MANAGEMENT IN THE HIGHLANDS OF KENYA
201
be altered seasonally, but some of the important cash crops are perennials, and their
area changes more slowly. Currently, there is little current investment in coffee
because of a decline in coffee prices and mismanagement of the coffee cooperatives.
Coffee output has thus fallen dramatically, but the area under coffee much less so.
There is relatively high investment in tea in the upper lands and horticultural
crops.
A recent study has documented the changing patterns of agricultural enter-
prises in the central highlands (Njuki and Verdeaux 2001). Table 8.3 presents a
summary of the major changes in crop production in Embu, comparing the cur-
rent situation to that at the time of independence (1963). Tea and potatoes were
introduced at the time of independence. A large number of trees were introduced
during the 1970s. A few crops, climbing beans, sweet potatoes, and passion fruit
have all been introduced since the 1980s. Two of the most important crops, coffee
and maize, had been cultivated in both periods, though there were strict marketing
limitations facing African coffee producers prior to independence. This diversifica-
tion into higher-value crops at the same time as average farm size is shrinking serves
as a cushion against risky markets and testifies to a recognition by farmers that
farming is a business and not just as a way of life.
There is much less known about changes in crop mix in the western highland
areas. The response to market opportunities appears to be more uneven than in the
Table 8.3 Changes in crop cultivation before and after independence on the southern slopes of
Mt. Kenya
Cultivated before
Cultivated now but
Time of
Type of crop
1963 but not now
not before 1963
introduction
Legumes
Pigeon peas
Climbing beans
1992ş93
Njabi
Cowpeas
Green grams
Grains
Millet
Baby corn
Sorghum
Root crops
Irish potatoes
1963
Sweet potatoes
2000
Stem and fruit crops
Bananas
1970s
Mangoes
1960s
Avocado
1970s
Tree tomato
1970s
Passion fruits
1980s
Pawpaws
1970s
Crops exclusively for sale
Tea
1963
Macadamia
1970s
Source: Njuki and Verdeaux (2001).
202
FRANK PLACE ET AL.
central highlands. This may be because of its poorer access to the Nairobi processor
and consumer markets, and therefore farmers face keener competition for the smaller
regional market. For instance, informal market surveys have found that much of
the vegetables found in Siaya markets come not from nearby farmers but from
farmers in Nandi or Uasin Gishu Districts (more commercialized districts located
along the western edge of the Rift Valley) (Rommelse 2001b). In areas where
farmers are not well linked into market opportunities, there has been little incen-
tive to alter production patterns. Within villages in Vihiga and Siaya, there do not
appear to be strong differences in crop mix across households of different size or
households at different stages of life cycle. That is, there are no apparent patterns
of diversification or specialization emerging.
What drives the process of diversification, and which households can join
the process? The chronology of agricultural development in the central highlands
suggests that government investment in tea and coffee marketing and processing
enabled a large number of households to establish these commercial crops. With
these founding commercial enterprises, huge investments in improved dairy ani-
mals occurred, and with them additional horticultural crops and heavy input
use. In the western highlands, there was no similar successful government invest-
ment (though some attempts failed). Yet, similar patterns of diversification into
dairy and other commercial enterprises are found in the few areas where tea has
been promoted. With recent troubles in the cooperative sector (tea excluded),
more recent investments in diversification may have been funded from nonfarm
sources. However, studies of farm and nonfarm interactions are lacking for rural
Kenya.
Livestock types and inputs. At independence in the Mt. Kenya highlands, most
people kept large numbers of livestock, cattle, sheep, goats, and poultry. The cattle
were originally zebu and were grazed in paddocks. In the 1980s, there was intro-
duction of crossbred and exotic cattle and a shift from paddock grazing to zero
grazing. This was accompanied by a reduction in the number of cattle that farmers
kept. The reduction of livestock numbers is best illustrated by the livestock num-
bers held by different generations of households (Table 8.4). Njuki and Verdeaux
(2001) traced the number of cattle through three generations of households. The
oldest generation had the highest number of cattle at the time of study and also had
the highest number of cattle ever held. Moreover, all generations now have fewer
livestock than they once had.
The lower numbers among the current generation have three main reasons.
The exotic breeds were high producing and input intensive. In some cases, desired
output levels could be achieved with fewer animals, and in other cases, high feed
LAND MANAGEMENT IN THE HIGHLANDS OF KENYA
203
Table 8.4 Difference in livestock numbers among farmer generations in Embu District
Number
Largest number of
Number
Largest number of
Generation
of cows
cows ever held
of goats
goats ever held
Generation 1
1.4010
.19
1.20 21.13
Generation 2
0.61
2.64
0.54
7.88
Generation 3
0.33
1.00
1.33
3.33
F value
5.688
11.184
3.225
1.183
Significance level
0.004
0.0001
0.43
0.315
Source: Njuki and Verdeaux (2001).
costs limited the number of exotic cattle that farmers could keep. The second rea-
son is the reduction in farm size and lack of area for producing feed. Last, increased
labor spent on nonfarm activities will tend to reduce agricultural investment across
the board. The pattern for goats is somewhat different. Though current herds are
smaller than those once held by households, today sizes are similar for different-aged
households. Goats are becoming popular among the young in good part because
new high-quality dairy goats are being promoted by NGOs using schemes that
require little cash. Discussions with farmers also indicate that investment in goats
may partly compensate for an inability to establish a dairy cattle system.
Nonetheless, the numbers of improved dairy animals held by smallholder
farmers is impressive. It is estimated that there are slightly more than 2.5 million
dairy cattle on 600,000 smallholder dairy farms in Kenya, the most in all of Sub-
Saharan Africa (Peeler and Omore 1997). Central Province, with 27 percent of the
stock, is home to the second largest number of improved dairy animals in Kenya.
There are many accompanying investments that follow the improvement of cattle
breeds. Some of the recent investments among central Kenya dairy farmers are in
feeding regimens. Murithi (1998) found that among dairy farmers, 98 percent had
planted napier grass, 18 percent had fodder trees, and 16 percent had planted high-
quality pastures.
In western Kenya, as indicated in Table 8.2, one striking difference from the cen-
tral highlands is the lack of investment in higher-grade cattle and accompanying
investments in zero grazing. Very few households have such animals in the sample
from Vihiga and Siaya. On the other hand, there is quite a significant investment
in napier grass (Table 8.1). Some is used to feed local cows, but some is produced
for sale by households without cattle. For instance, 7.4 percent of poor farmers
were found to produce napier for the market as compared to only 2.5 percent of
the nonpoor. There appears to be a reduction in livestock numbers across genera-
tions, similar to the results from the central highlands. The youngest household
heads (below the age of 30) had on average 0.87 head of local cattle. Those between
204
FRANK PLACE ET AL.
40 and 50 had 1.09 head, and those above 60 had 1.49 head on average. The dif-
ference is highly significant, and the number of goats follows the same pattern.
Land investments and inputs. There is evidence to suggest that farmers in the
central highlands make significantly more investments in soil management than
their counterparts in the western highlands. First, Owuor (1999) found that fertil-
izer use intensity was highest in the central highlands (106.0 kg/acre). Fertilizer use
on the higher-value crops was 194 kg/acre as compared to 58 kg/acre on the lower-
value crops, so the mix of crops plays a key role in overall fertilizer rates. However,
farmers apply nutrient inputs on most of the crops. Table 8.5 shows that a high
proportion (75 to 92 percent) of farmers apply fertilizer on maize, potato, and cof-
fee, and over half of farmers applied manure to all their crops (except for beans,
which are normally not fertilized because of their nitrogen-fixing capability).
Indeed, farmers placed the purchase of inputs among their top four expenditure
categories in over 80 percent of cases in central Kenya, and about 30 percent of
farmers felt that input investments ranked first or second (Murithi 1998).
In the western Kenya highlands, the amount of investment in land is much
more varied across different sites, with our Vihiga and Siaya sites exhibiting little
investment. Only about 20 percent of 1,636 households use fertilizer on a regular
basis (Place et al. 2002a), and the amounts used per hectare are calculated to be
about one-fifth (28 kg/acre) of those in the central highlands (Owuor 1999). There
is somewhat more concentration on higher-value crops (40 kg/acre) as compared
to 17 kg/acre for cereals. This low investment level is clearly linked to the relatively
low use of industrial crops, horticultural crops, and high-yielding varieties of maize.
Only 15 percent of 1,636 households reported the use of hybrids in 1997. Rom-
melse (2001a) found that the median annual expenditure on farm inputs (crops and
livestock together) in western Kenya was about $15. On the other hand, organic
nutrient input systems are currently being tested by a large number of households
in western Kenya in good part because of a high concentration of NGOs in the
Table 8.5 Nutrient investments on major crops in the central highlands
Percentage of
Percentage of farmers
Percentage of farmers
Crop
farmers growing
who apply fertilizer
who apply manure
Coffee
99
74
89
Macadamia
87
38
60
Bananas
59
11
56
Maize
89
92
57
Beans
82
27
17
Potatoes
69
9069
Source: Murithi (1998).
LAND MANAGEMENT IN THE HIGHLANDS OF KENYA
205
region. Over 70 percent use animal manure, and about 40 percent use composting
methods in Siaya and Vihiga. New agroforestry techniques for soil fertility man-
agement are also being tested by a good number of households (10 to 30 percent)
where they have been introduced.
Comparing across the regions, Owuor (1999) reports that average fertilizer
amounts per acre for the upper quartile of farmers in western Kenya is below the
mean level of the lower half of farmers in central Kenya. These differences in nutri-
ent investments are perceived by farmers to have had long-term effects on the soils
as well. A study by Migot-Adholla, Place, and Oluoch-Kosura (1990) found that
farmers in the central highlands overwhelmingly perceived their soils to be of
higher quality than when they acquired the land (positive changes were reported by
around 90 percent of farmers). The exact reverse was found among farmers in the
western highlands. Thus, there is strong evidence of vicious povertyşenvironmental
cycles at work in some regions while virtuous cycles exist in others.
Labor. One recent detailed study of labor has been undertaken in the central
highlands. Njuki (2001) collected labor data by gender and by major crop during
1998, and some results are summarized in Table 8.6. Two major conclusions are
evident:
1. Men and women both invest more labor in cash crops than in food crops.
2. Women invest more labor than do men in both food crops and cash crops.
The only activity where men contribute more labor than women is livestock raising.
But even in this case, women's labor contribution nearly equals that of men. These
results demonstrate the clear priority that households place on cash crops over food
crops. Moreover, the idea that men are interested in commercial crops and women
are interested in subsistence crops is dispelled by the fact that the ratio of female to
male labor is similar for both types of crops. Because women often manage farms,
either on a temporary basis when the husband is away, or because of death or divorce
of a husband, the fact that women are active in the higher-value crops is very positive.
Driving Factors Underpinning Agricultural Investment
Macro and Meso Factors
In this section we highlight the major factors that could explain the remarkable dif-
ferences in agricultural development between the western and central highlands.
206
FRANK PLACE ET AL.
Table 8.6 Allocation of labor by major crop in Kirinyaga and Embu Disticts
Percentage of all
Women's labor as a
labor allocated to
percentage of total labor
the activity/enterprise
for each activity/enterprise
Activity/enterprise
(column percentage)
(row percentage)
Food crops
13.8
70.2
Maize
4.4
68.8
Cash crops
49.9
67.6
Coffee
30.3
61.0
Tea
19.6
77.8
Livestock
10.6
47.6
Other resource management
3.8
96.5
Domestic
21.9
92.1
Source: Njuki (2001).
The key factors are highly linked to government policy and public investment. As
a proximate factor, commercialization seems to be the most important. Through-
out the previous discussion, the influence of markets and higher-value enterprises
in central Kenya has been paramount. How did this occur? One obvious reason
for relatively higher commercialization in central versus western Kenya is its prox-
imity to Nairobi, where virtually all major agricultural processing firms are located.
Also of great importance was government investment in tea and coffee factories
in central Kenya. Because these had ready international markets, there was a steady
inflow of income into the rural areas. Moreover, the tea and coffee associations
provided credit to farmers, which helped to maintain high productivity levels. As
global competition in these commodities has heightened, liberalization and the
reduction of transaction costs may prove to be important in the future. Liberaliza-
tion was certainly the most important policy change for the dairy industry. The
role of culture is not clear, but there is more dynamism of individuals and groups
in the central Kenya highlands (Place et al. 2002b). Whether this is inherent in cul-
ture or built from earlier successes is not clear. Last, it may also be useful to high-
light the factors that are not important because of their similarity in both sites:
rainfall, extension, and land tenure. In the following paragraphs we provide some
illustrated examples of these factors.
There is a strong relationship between commercial orientation and agricultural
development. Owuor (1999) shows that throughout all regions of Kenya there is a
strong link among the proportion of crops marketed, the crop mix, and the value
of crop production. For example, in central Kenya, the upper quartile of house-
holds according to value of crop production sells on average 63 percent of crops.
On the other hand, the lower half of households sell only 38 percent of crops. The
LAND MANAGEMENT IN THE HIGHLANDS OF KENYA
207
favorable crop mix has pronounced effects (direct and indirect through incentives
for investment in other areas) on crop income. Households apply much greater
concentrations of fertilizer and other nutrients on their higher-value crops. The
end result is that households with higher-value crops earn significantly more than
do households with lower-value crops.
Expansion of market opportunities in Kenya has been strong throughout the
dairy sector. With the relinquishing of control of purchasing and processing by a
monopoly parastatal in the early 1990s, there was a mushrooming of private firms
in the dairy sector. These firms innovated a range of new products and brands of
cheese, yogurt, butter, and ice cream. Added to this was the already strong demand
for milk by nearby rural consumers (consumers of fresh milk and milk-based tea).
At lower levels of the chain, a variety of buyers for milk emerged, including the
large dairy producers cum processors. By 1998, Murithi (1998) found that small-
holders were utilizing a range of outlets for their milk, including local trading cen-
ters, their farms, neighbors, the government parastatal, and dairy cooperatives.
Complementing the influence of markets for outputs has been the availability
of credit for farmers in the central highlands. This is one success of the government-
supported cooperative sectors in coffee and tea. Murithi (1998) found that 76.8
percent of households in Embu had received credit through their membership in
coffee cooperative societies. A further 23.2 percent received credit from the Agri-
cultural Finance Corporation. These outlets are largely unavailable to smallholders in
the western highlands, and there are no other major sources that might fill this gap.
Household Factors
In this section we highlight the roles that household factors have in farmer invest-
ment patterns. In central Kenya, there are certainly differences in agricultural prac-
tices among households. However, these differences are not so apparent in the types
of enterprises adopted, as evidenced in Table 8.5, but rather in the management of
and investment in these enterprises. Unfortunately, the factors that explain differ-
ences in such investments are not well studied in the region. Therefore, this section
draws on detailed microstudies from western Kenya.
Household wealth is positively associated with the presence of many of the
investments discussed above. Using a wealth indicator driven by criteria identified
by villagers, we classified households in Vihiga and Siaya into groups of "very poor,"
"poor," or "nonpoor." The nonpoor households have:
Ě larger farms (2.5 acres compared to 1.4 acres for the very poor),
Ě more cattle (1.7 compared to 0.6 for the very poor),
208FRANK PLACE ET AL.
Ě a higher proportion cultivating high-value crops (67.1 percent compared
to 51.9 percent of the very poor growing kale; 13.2 percent compared to
8.1 percent of the very poor growing tomatoes),
Ě a higher proportion growing hybrid maize (25.2 percent compared to
6.8 percent for the very poor), and
Ě a higher proportion using fertilizer (33.6 percent compared to 8.3 percent for
the very poor).
In terms of overall expenditure on agricultural inputs, one study found that
the nonpoor spent approximately $100 per year, whereas the very poor spent only
$5 (Rommelse 2001a). However, Place et al. (2002a) found that poor households
do invest in labor or land-using practices such as manuring, composting, and agro-
forestry techniques for soil improvement at rates similar to those of the nonpoor.
For instance, the very poor had improved fallows on about 11 percent of their
maize area as compared to 10 percent for the nonpoor.
In terms of the influence of gender of household head, the following relation-
ships were found in western Kenya:
Ě Women grow slightly fewer crops than men (5.7 compared to 6.2 for men).
Ě Women are less likely to grow high-value crops than men (31.0 percent grow
napier compared to 48.0 percent for men; 11.4 percent grow hybrid maize
compared to 16.9 percent for men; 6.4 percent grow tomatoes compared to
14.4 percent for men).
Ě Women have similar land sizes as men.
Ě Women have similar numbers of local cows, goats, and poultry as men.
Ě Women are slightly less likely to use chemical fertilizer than men (17.4 percent
compared to 22.6 percent for men).
Descriptive analyses found that farm size and education also feature in differ-
ences across households. The causal relationships are not determinate, but farm size
in these areas is relatively fixed, with inheritance passing ownership of more than
90 percent of all land area. Farm size is positively correlated with cattle ownership,
use of hybrid maize, and use of chemical fertilizer. But it is not linked to whether
LAND MANAGEMENT IN THE HIGHLANDS OF KENYA
209
cash crops are grown. Farm size is also positively associated with education level,
and education appears to be similarly critical in use of chemical fertilizer (e.g.,
fertilizer is used by 33 percent of those with secondary education and 11 percent
of those with no education), use of hybrid maize, and the number of local cows
owned. Education is also strongly linked to obtaining important off-farm income,
and it is likely that the complementarities among education, agricultural assets,
and off-farm income are key to household investment in western Kenya, if not
throughout rural Kenya.
Effects of Investment and Land Management Choices
on Income and Poverty
The purpose of this section is to assess the extent to which the abovementioned dif-
ferences in agricultural investment translate into significant differences in income
and poverty reduction. The first piece of evidence reported is a comparison of gross
margins for different agricultural enterprises in central Kenya. Njuki (2001) mea-
sured outputs, inputs, and labor for 40 farmers during the 1998 growing season,
and an analysis is presented in Table 8.7. In terms of gross margins (excluding own
labor), it is clear that in the late 1990s coffee and tea were far superior to food
crops such as maize, potato, and beans. Gross margins per hectare were between
two and eight times those for the food crops. Returns from livestock farming were
also relatively high. So shifts in relative enterprise mix can have a large influence
on agricultural revenue. As demonstrated above, many households recognize these
profitable opportunities and devote a high proportion of labor to them. However,
households do not specialize in the highest expected return activities for several rea-
sons. The key reason is economic risk both of finding markets for outputs and of
obtaining a favorable price. Imperfect factor markets, especially for credit, hamper
farmers' ability to access the necessary resources for the high inputşhigh output
farming systems.
The implications of this microanalysis are confirmed in a national study by
Owuor (1999). In that study, a comparison is made between percentage area under
cereals, industrial crops (coffee, tea, sugar), and horticultural crops and the percent
of crop revenue that each contributes. Table 8.8 shows the results not only for the
central and western highlands but for several other agricultural zones in Kenya. In
most zones, the contribution of industrial and horticultural revenue to total crop
revenue greatly exceeds the share of land under these crops. This is very evident in
the central highlands, where the share of land area under industrial and horticul-
tural crops is 46.2 percent, but their share of revenue is a staggering 71.1 percent.
Thus, the central highlands have not only diversified into higher-value crops but have
selected very profitable ones. On the contrary, though there is some diversification
210
FRANK PLACE ET AL.
Table 8.7 Seasonal gross margin for farm enterprises in central Kenya
Indicator
Coffee
Tea
Maize
Beans
Potato
Livestock
Output value (per farm)
258
272
32
31
35
135
Output value (per hectare)
947
1,035
65
52
137
--
Input costs (per farm)
22
48
14
4
1043
Input costs (per hectare)
81
181
28
7
39
--
Hired labor costs (per farm)
12
25
6
13
--
Hired labor costs (per hectare)
46
97
12
21
--
--
Gross margin (per farm)
223
199
13
14
25
92
Gross margin (per hectare)
819
757
25
24
98
Source: Njuki (2001).
in the western highlands (28.0 percent of land under noncereal crops), these par-
ticular industrial and horticultural crops (e.g., sugar cane, cabbage) are not pro-
viding an incremental gain in revenue. The figure for average labor productivity
summarizes this well. The productivity level in the central highlands is 3.5 times
that in the western highlands, reflecting differences in crop mix, technical efficiency
in crop production, and relative prices of inputs and outputs.
Do these differences in agricultural productivity translate into differences in
household incomes? Argwings-Kodhek et al. (1999) show clearly that crop and live-
stock income play vital roles in total rural household income. It appears that farm
and nonfarm income sources are complementary, providing investment funds for
each other or at least secure bases that enable farmers to take risks in other ventures.
In the central highlands, average total household income was estimated at $2,819.
Of this, 39 percent or $1,099 came from crops, 24 percent from livestock, and
37 percent from nonfarm sources. Households in the western highlands earned 32
percent of income from crops, 29 percent from livestock, and 39 percent from
nonfarm sources, which do not differ significantly from the pattern in the central
highlands. However, total income for western highland households averaged only
$1,014 (36 percent of the figure for the central highlands). Adjusting for farm size
differences, central highland farmers earn 2.5 times the amount of crop income
per person as western highland farmers. Similarly, livestock and nonfarm income
are multiples of those earned by western highland households. In addition, average
earnings for agricultural wage labor and nearly all other nonfarm occupations are
higher in the central highlands than in the western highlands (Argwings-Kodhek
et al. 1999). It seems that the high agricultural incomes from the central highlands
play a significant role in stimulating the wider local economy.
So in aggregate, the investment in new enterprises and in intensifying crop,
livestock, and tree production systems have led to significantly greater incomes for
LAND MANAGEMENT IN THE HIGHLANDS OF KENYA
211
Table 8.8 Contribution of different crop types to revenue generation
High-potential
Central
Western
Western
Western
Crop
maize
highlands
transitional
highlands
lowlands
Share of land (percent)
Cereals
93.1
53.7
51.072.084.1
Industrial
3.6
26.9
43.4
16.6
14.3
Horticulture
3.3
19.3
5.5
11.4
1.6
Share of revenue (percent)
Cereals
84.7
28.9
36.8
71.4
58.9
Industrial
7.2
45.7
51.024.1
34.7
Horticulture
8.1
25.4
12.2
4.2
6.4
Land productivity (ksh/acre)
188
289
146
11090
Labor productivity (ksh/adult)
257
262
142
74
60
Source: Owuor (1999).
central Kenyan farmers compared to their counterparts in other regions. In western
Kenya, enterprise diversification has not yet been as extensive or profitable as in
central Kenya. Consequently, intensification of production is lagging too, and low
agricultural incomes are the norm. These general results mask important intra-
regional differences between households, however. Jayne et al. (2003b) find that
despite regional disparities, there exists substantial variation in household incomes
within regions, districts, and villages. In line with the meso- and microanalyses in
previous chapters, this shows that although getting the market economy right is an
important antipoverty intervention, it by no means guarantees that all households
can be uplifted. Special attention is still required for those households unable to seize
opportunities in the agricultural or nonagricultural sectors.
Summary and Ways Forward
This synthesis began by demonstrating the significant gap in poverty levels between
the relatively poor western highlands and the relatively better off central highlands
of Kenya. It further tried to show the extent to which historical and current agri-
cultural practices have influenced this divergence. Finally, policies and investments
that have underpinned positive changes in the agricultural sector have been noted.
A brief summary of this is shown in Table 8.9. In this section, we summarize those
analyses and offer suggestions as to how agriculture could become more productive
in the poverty hot spots.
In the Kenyan highlands, market development of higher-value agricultural
enterprises is a strategy that has paid off for a large number of smallholder farmers.
To reinforce the point that in the relatively market-oriented highlands of Kenya,
212
FRANK PLACE ET AL.
Table 8.9 Summary of comparative analysis
Indicator
Central Kenya
Western Kenya
Poverty rates
Low
High
Agricultural incomes
High
Low
Nature of agricultural enterprises
Diverse, commercial enterprises
Diverse, staple crops, local livestock breeds
including perennials and
high-grade dairy
Level of investment
Moderately high fertilizer use
Very little
Availability of credit
Mainly through cooperatives
No significant sources
Soil fertility management
Good, fertility improving
Poor, fertility declining
Public investment in agriculture
Tea, coffee, and dairy sectors with
Cotton and sugar mainly with mixed success
generally favorable results
Private sector investment in agriculture
Dairy marketing, contract farming
Contract farming tried but not successful
food security is mainly about income generation (and not producing one's own
food), Table 8.10 provides some data on sources of food consumed from western
Kenya. The first striking fact is that households demand and consume a wide range
of food products, and it is infeasible for households to produce all of these at suf-
ficient levels. Second, it is easily seen that households are relying on market pur-
chases, at least at times during the year, for most of the items, including maize.
Rommelse (2001a) found that about 70 percent of household expenditures in the
western highlands were for food. It is therefore clear that household food security
would benefit significantly from enhanced income sources, whether from agricul-
tural or nonagricultural sources.
Clearly, there are many examples of successful intensification from the central
highlands. For this region, a key foundation has been either coffee or tea, both
export crops with a ready buyer and supplier of inputs on credit. With these pillars
in place, other commercial-oriented enterprises such as dairy, macadamia, pyre-
thrum, vegetables, and fruit trees were easy to accommodate.
This type of development pathway has escaped the majority of the western
highlands. One factor has been the lack of parallel development of infrastructure
for processing coffee and tea and to service high-quality animals. Proximity to
Nairobi cannot be discounted as a factor. The end result is that much of western
Kenya has focused on the development strategy of diversifying into off-farm activ-
ities. For the poor, this often means seeking jobs as agricultural laborers or relocat-
ing to Nairobi to work in the low-paying informal sector. These nonfarm strategies
have yet to pay off for the majority of rural households.
Most households have invested considerable funds and foregone labor in the
education of their children. Not only is this done on moral grounds, but it is
expected to provide economic and social rewards to parents. In prior decades,
LAND MANAGEMENT IN THE HIGHLANDS OF KENYA
213
Table 8.10 Percentage of food consumption from
own-farm production in Siaya and
Vihiga
Percentage of
consumption from
own production
(range two visits)
Food item
Luhya
Luo
Maize
19ş46
59ş66
Kales
38ş56
71ş75
Banana, cooking
83ş87
88ş96
Sweet potato
65ş68
84
Beans
53ş66
61ş86
Cowpea leaves
83ş96
76ş92
Milk
24ş31
24ş27
Mango
44ş78
87
Beef
00
Avocado
65ş79
64ş81
Banana, ripe
51ş56
76ş85
Cabbage
0ş2
3ş7
Chicken
51ş78
97ş98
Pawpaw
66ş78
89ş94
Egg
64ş65
85ş97
Rice
00
Cassava
0ş33
53ş75
Millet
20ş38
8
Irish potato
01ş11
Pumpkin leaves
51ş55
68ş88
Groundnut
28ş36
21ş40
Sorghum
41ş59
20ş66
Tomato
11
11
Source: Rommelse (2001a).
educating children to high levels was a poverty-alleviation strategy with a relatively
high probability of success, even if after a long payback period. But now, education
is only a necessary but not sufficient condition for a successful livelihood because
job growth is poor if at all positive, and there are increasing numbers of educated
job seekers. Furthermore, the costs of education at secondary levels and beyond are
enormous. Thus, even this strategy requires the generation of funds for school fees.
Where can funds for this or other large investments come from?
In central Kenya, it is clear that many households are able to generate signifi-
cant sums of cash with which to meet such investments. It is thus more critical to
explore possible ways to generate investment capital in the western highlands. We
214
FRANK PLACE ET AL.
cannot explore all the potential nonfarm opportunities in this chapter, so we offer
a few immediate prospects within agriculture. In the Siaya-Vihiga food production
area, the 10 most commonly sold items are: (1) vegetables, (2) chickens, (3) fruits,
(4) poles and timber, (5) milk, (6) maize, (7) fuelwood, (8) beans, (9) eggs, and
(10) cattle and goats (Rommelse 2001a). Of these, some are feasible for households
with little cash. These would include short-term enterprises such as certain types of
vegetables (e.g., kales, but not tomatoes) and chickens (starting on a small scale).
Longer-term investments in trees for fruits, poles and timber, and fuelwood are also
feasible in terms of requiring little cash (but require land and the ability to bear
lengthy payback periods). But even these small investments may be difficult for the
poorest households. There are several "first steps" that households could take to
generate small sums of cash without having to invest cash. These include better
husbandry practices with existing crops including an expansion in the use of organic
nutrients. Thes major question is whether these incremental gains can be used to
fuel further investment in agriculture because the competition for cash from differ-
ent consumption needs is acute. Many integrated interventions would be required
for rapid and widespread improvements in agricultural productivity to take place in
poverty hot spots. In a place like western Kenya, with good potential for commer-
cial production but small farms, increasing credit opportunities will be essential.
Appendix: Description of Key Studies Synthesized
Author
Topics covered
Geographic area covered
Murithi (1998)
Farming system description, especially dairy
Central Kenya
100 hhs
Mugo (1999)
Female and male decisionmaking and tree planting
Central and western Kenya
200 hhs
Wangila, de Wolf, and
Description of farming practices
Western Kenya
Rommelse (1999)
1600 hhs
Owuor (1999)
Farm enterprises, inputs use, and productivity
All of Kenya
1500 hhs
Argwings-Kodhek et al. (1999)
Farming systems and income
All of Kenya
1500 hhs
Njuki (2001)
Female and male labor allocation, enterprise profitability
Central Kenya
200 hhs
Njuki and Verdeaux (2001)
Historical change in farming systems
Central Kenya
Focus groups
Rommelse (2001a)
Farm investment, consumption and expenditure
Western Kenya
120 hhs
Place et al. (2002)
Soil management
Western Kenya
1600 hhs
Note: All studies reflect data collected in the period 1995ş2000.
LAND MANAGEMENT IN THE HIGHLANDS OF KENYA
215
Notes
The authors thank John Pender, Isaac Minde, and an anonymous referee for helpful comments.
1. The Kenya Agricultural Marketing and Policy Analysis Project of Tegemeo Institute, Kenya
Agricultural Research Institute, and Michigan State University.
2. There is one tea factory in the north of the district, and the immediate surrounding area is
more prosperous than elsewhere. Our data do not include these households.
3. Two corollaries to this are (1) the influence of seniority among Luo men living together on
a single compound and (2) cases where land given to sons has not been officially confirmed as per-
manent by the father.
4. Young males in the Siaya and Vihiga are often maligned by local leaders as being lazy if not
delinquent (Wangila 2000).
5. For coffee, this may have changed during the downturn in coffee prices in the early 2000s.
6. Including the high-rainfall areas of Kakamega, Vihiga, and Siaya. Exceptions are former
resettlement areas (e.g., in Kakamega) and the drier areas to the west (Busia, Bungoma).
7. This may underestimate the true diversity because yams, tobacco, millet, onions, cow peas,
groundnuts, finger millet, coffee, sisal, sesame, and soybeans are also grown in the area.
8. A woody species grown as a bush whose main product is a stimulant that is sold in Somalia
and the Middle East.
9. The high potential maize zone spanning the edges of the Rift Valley is an exception whereby
cereals account for 93 percent of cultivated area on more medium- or large-scale farms (Owuor 1999).
C h a p t e r 9
Policies and Programs Affecting Land
Management Practices, Input Use,
and Productivity in the Highlands
of Amhara Region, Ethiopia
Samuel Benin
Increasing agricultural productivity is an important challenge in Sub-Saharan
Africa (SSA). Since the 1960s, agricultural production in SSA has failed to keep
up with population growth. The situation is severe in Ethiopia, particularly in
the highland areas, where agriculture is primarily rain fed (about 95 percent); soil
loss rates average 21 to 42 tons per hectare per year on cultivated lands (Hurni
1988; Kebede 1996); many soils show large negative nutrient balances (Stoorvogel,
Smaling, and Janssen 1993; Elias, Morse, and Belshaw 1998); cereal yields are less
than 1 ton per hectare in many places; and up to 2 percent of total crop production
is lost annually from soil erosion alone (Kappel 1996).
Since 1991, the federal and regional governments of Ethiopia, within the frame-
work of the Agriculture Development Led Industrialization (ADLI) strategy, have
undertaken a massive program of natural resource conservation and huge investment
in infrastructure (e.g., roads, irrigation), agricultural extension and credit, educa-
tion, and other services to reduce environmental degradation, increase agricultural
productivity, reduce poverty, and increase food security. Fundamental empirical
evidence based on sound scientific methodology on the contribution of these pub-
lic investments and programs to agricultural production is lacking. Also important
is the relative contribution of the public investments and programs to agricultural
productivity in low- versus high-agricultural-potential areas. Filling these knowledge
gaps is the main objective of this chapter.
218
SAMUEL BENIN
Data from household- and plot-level surveys conducted between 2000 and
2001 in the highlands of Amhara region are utilized in this chapter to examine the
contributions (and implications) of land redistribution and tenure, infrastructure
(irrigation, roads, markets), education, and agricultural extension to land manage-
ment practices, input use, and land productivity (crop yield) in low- versus high-
agricultural-potential areas. In contrast to many studies, several other factors includ-
ing land investments, household structure and endowments, plot quality, population
pressure, and natural factors that may affect land management practices, inputs,
and land productivity are controlled for. The analysis is similar to that presented in
Chapters 5 and 7 but focused on a different region.
The next section of this chapter presents the conceptual framework and
hypotheses for examining the effects of policies and programs on adoption of land
management practices, amount of inputs used, and land productivity. The study
area and data are presented in the third section. The econometric approach, results,
and discussion are presented in the fourth section, and conclusions and implica-
tions in the last section.
Conceptual Framework and Hypotheses
The underlying conceptual framework for the econometric analysis is similar to
that presented in Chapter 5, though we present the framework here because of
some important differences. It draws from the literature on agricultural household
models (Singh, Squire, and Strauss 1986; de Janvry, Fafchamps, and Sadoulet 1991).
In addition, the hypotheses about how land redistribution and tenure contracts
may influence land management, inputs, and productivity draw from the literature
on property rights and investment incentives (Barrows and Roth 1990; Feder and
Feeny 1993; Place and Hazell 1993; Besley 1995; Gavian and Fafchamps 1996;
Pender and Kerr 1999; Place and Swallow 2000; Otsuka and Place 2001a) and
land rental markets and agricultural efficiency (Cheung 1969; Otsuka and Hayami
1988; Otsuka, Chuma, and Hayami 1992; Ahmed et al. 2002; Pender and
Fafchamps 2006, forthcoming). The effects of other policies derive from theories
of induced technical and institutional innovation in agriculture (Boserup 1965;
Hayami and Ruttan 1985; Pender 1998; Fan and Hazell 2000).
Crop output is given by equation (9.1):
CROP OUTPUT
= f (LAND INVESTMENTS
, INPUTS
,
h,p,t
h,p,t
h,p,t
LAND MANAGEMENT PRACTICES
,
h,p,t
EXTENSION , CROP
, LAND
(9.1)
h,t
h,p,t
QUALITY
, TECHNICAL KNOWHOW ,
h,p,t
h,t
NATURAL FACTORS )
v,t
POLICIES AND PROGRAMS IN THE HIGHLANDS OF AMHARA
219
In equation (9.1), crop output of household h on plot p in year t is expressed
as a function of the stock of land investments (or indicators of long-term invest-
ments) on the plot, especially soil and water conservation structures (e.g., stone
terraces, soil bunds) and irrigation, amount of inputs used on the plot (e.g., labor,
animal draft power, seeds, chemical fertilizers), land management practices used on
the plot, especially soil-fertility practices (e.g., crop rotation, crop residues, manure),
extension, type of crops planted, and the operator's technical knowledge, which is
enhanced through education and farm experience.1 Other factors affecting crop
output include characteristics and quality of the land (e.g., size, slope, soil depth)
and natural factors (e.g., rainfall, elevation). Amount of inputs used, land manage-
ment practices, extension, and type of crops planted are in turn given by equation
(9.2), where X represents the vector of the above endogenous variables.
X
= f (LAND INVESTMENTS
, LAND QUALITY
,
h,p,t
h,p,t
h,p,t
TECHNICAL KNOWHOW , NATURAL FACTORS ,
h,t
v,t
LAND POLICY , LAND TENURE
,
v,t
h,p,t
(9.2)
ACCESS TO INFRASTRUCTURE AND CREDIT ,
h,t
ENDOWMENT OF ASSETS , SOCIAL CAPITAL ,
h,t
v,t
POPULATION DENSITY )
v,t
Here, the assumption is that inputs, land management practices, extension,
and type of crops planted depend on the factors determining profitability of crop
production. They depend also on the land policy and land tenure status (which affect
the future returns from current practices); household access to roads, markets, and
credit (which affect the ability to purchase or hire inputs); household endowments
of land, labor, oxen, and other assets, and social capital (which are important for
labor, draft power, manure, credit, etc., where markets for such inputs do not func-
tion properly or do not exist); and population density and other village-level factors
(which affect the value of land relative to labor).
Note that equation (9.1) is a production function and so excludes those factors
that do not have a hypothesized direct effect on crop production. Inputs, land
management practices, extension, and type of crops planted, on the other hand,
depend on additional factors that influence the awareness, availability, costs, bene-
fits, and risks associated with them. Once the equations are estimated, the estimated
coefficients can be used to predict the effect of the policy and program variables
on crop output, for example, directly as specified in equation (9.1) or indirectly via
the effects of land management practices, inputs, extension, and crop choice. For
example, irrigation can affect crop output directly as well as indirectly via its influ-
ence on land management, inputs, or crop choice decisions, whereas the effect of
220
SAMUEL BENIN
market access on crop productivity can be measured indirectly via its influence on
land management, inputs, and crop choice decisions.
Research Hypotheses
There are potentially a large number of testable hypotheses that can be considered
concerning the relationships between the dependent and explanatory variables, as
specified in the conceptual framework in equations (9.1) and (9.2). Many of these
hypotheses have already been discussed in Chapters 2, 5, and 7. In this section, we
focus on the effects of land redistribution and tenure, providing more local context
than was possible in Chapter 2.
The nature of tenure on a plot of land can affect land management and pro-
ductivity on that plot for several reasons. If land tenure is insecure, then the house-
hold operating the plot may have less incentive to invest in land improvement
(Feder and Feeny 1993). However, the household may increase investment if the
investment can in turn increase security of tenure (Besley 1995). Thus, there may
be more investment in land improvement on plots with insecure tenure.
In Ethiopia, and particularly the Amhara region, one source of tenure insecu-
rity derives from land redistribution, which has been frequent and ongoing since
1975 (instituted by the military government) to reduce landlessness and equalize
landholding size and quality across households. Although land redistribution was
stopped in many regions of Ethiopia in 1991 (with the current government com-
ing to power), it continued in many parts of the Amhara region. A major recent
redistribution exercise in the region took place in 1996ş97, raising the proportion
of farmers who owned land to about 72 percent (547,087 out of the total 756,809)
(GEA 1997). However, actual implementation, type and amount of land affected,
and population affected were not uniform across the region, as the exercise was left
to local officials for needs assessment and implementation. In general, newly mar-
ried couples (and the youth), widows, single women, and the poor were the main
beneficiaries, and those classified as bureaucrats (associated with the feudal system
or the previous military government and religious leaders), who were believed to
hold excessive amounts of land, were the losers. See Ege (1997), Yigremew (1997),
Gelaye (1999), and Ege and Aspen (2003), for example, for accounts of the imple-
mentation in specific parts of the region. Generally, the redistribution exercise drew
a massive reaction, both against and in support of it, which was expressed through
rallies and demonstrations (UNDP 1997) as well as songs and poetry (Gelaye 1999).
Very few studies, however, have examined the effects of land redistribution on land
management and productivity in Ethiopia. Although land redistribution may cause
tenure insecurity (Holden and Yohannes 2002), it may have mixed influences on
farmers' land management and productivity through short- and long-term effects
POLICIES AND PROGRAMS IN THE HIGHLANDS OF AMHARA
221
(Benin and Pender 2001). On one hand, by improving access to land of house-
holds that have relative surpluses of other important factors of production, such as
labor, oxen, or cash to purchase inputs, particularly in the context of prohibited
land sales and restricted lease markets as exist in Ethiopia, land redistribution may
increase intensity of land management and use of purchased inputs, which may in
turn increase productivity. On the other hand, land redistribution could also lead
to inefficient factor ratios by forcing households with greater access to those other
important factors of production to have the same landholding size as their poorer
counterparts. Furthermore, expectations of future land redistribution may under-
mine farmers' incentive to invest in land improvements and soil fertility because
farmers' ability to reap the benefits of such investments is undermined, adding to
the ambiguity of the effect of land redistribution. Although the notion that a farmer
may increase investment if the investment can in turn increase security of tenure or
prevent one's land from being redistributed is not as evident in Ethiopia as it is in
West Africa (for example, Besley 1995; Quisumbing et al. 2002), it can contribute
to the ambiguity because farmers are entitled to compensation for any investments
made on their redistributed lands, even if certain long-term investments such as
planting trees on farmland are discouraged from the start.
Also responding to the problem of unequal landholding is the practice of
transferring land through temporary leases in the form of sharecropping, fixed-fee
rentals, or borrowing. The ability to temporarily transfer land can help households
who own little or no land to overcome land constraints and also help those with little
or no inputs (especially oxen and labor) to lease out the land and obtain capital to
engage in other income-generating activity. However, the efficiency of alternative
land tenure contracts has generated a lot of discussion in the past (Johnson 1950;
Cheung 1969; Otsuka and Hayami 1988) and is still very much debated (Otsuka,
Chuma, and Hayami 1992; Otsuka and Place 2001a; Ahmed et al. 2002; Pender
and Fafchamps 2006, forthcoming). Underlying the debate about the inefficiency
of alternative land contracts is the incentive that the contracts provide to the ten-
ant. With perfect markets and no risk, fixed-fee or cash rental should result in an
efficient resource allocation, as in the case of owner cultivation, because the fixed-
fee rental would induce the tenant to produce the optimal level of output, where
the marginal product of the tenant's extra effort equals the marginal cost of putting
that effort. However, cash constraints (inability to pay the rent up front) or risk con-
siderations may hinder the ability or preference of tenants in using fixed-fee rental.
In this case, potential tenants may prefer sharecropping. However, because the share
tenant receives as marginal revenue only a fraction of the value of his or her mar-
ginal product of labor, sharecropping limits the tenant's incentive to supply labor
or other inputs at the optimum level, resulting in lower yields. If effort, however,
222
SAMUEL BENIN
can be easily monitored (or is costlessly enforceable), then a sharecropping arrange-
ment can be as efficient as owner-cultivated or fixed-fee tenancy (Johnson 1950;
Cheung 1969). The same result holds if there is mutual trust between the land-
owner and the tenant, as often exists in small communities where farmers know
each other and lease markets are not restricted (Otsuka and Hayami 1988; Pender
and Fafchamps 2006, forthcoming). To the extent that perfect markets for other
factors of production exist, achieving allocative and productive efficiency may not
require land rental markets to function (Pender and Fafchamps 2006, forth-
coming).2 However, imperfections in credit and input markets are important in
developing countries' agriculture (Holden, Shiferaw, and Pender 2001), and they
may be the main motive for the choice of sharecropping and the inefficiency sur-
rounding alternative land tenure systems (Ahmed et al. 2002).
Given imperfections in factor markets, then whether or not the cost of moni-
toring and enforcement are low enough to result in efficient sharecropping remains
an empirical question. The results can provide useful information, especially for
the development by the regional government of the modalities of land leasing in
the administration and use of land that has been ongoing in the region since 2000
(ANRSC 2000b).
Study Area and Data
Survey
The study is based on analysis of household and plot level surveys that were con-
ducted in the highland areas (above 1,500 meters above sea level) of the Amhara
region of Ethiopia in 2000 and 2001. These follow community surveys in 98 villages
(gots) conducted in 1999 and 2000. At the community level, a stratified random
sample of 49 peasant associations (PAs, usually consisting of three to five villages)3
and two villages randomly selected from each PA were selected from highland areas
of the region. Using district (woreda)-level secondary data, the stratification was
based on indicators of agricultural potential (low or high),4 market access (access or
no access to an all-weather road), and population density (1994 rural population
density greater than or less than 100 persons per square kilometer) (see Figure 9.1
in the color insert).5 Two additional strata were defined for PAs where an irrigation
project exists (in low- versus high-potential areas), resulting in a total of 10 strata.
Five PAs were then randomly selected from each stratum (except the irrigated
drought-prone stratum, in which there were only four PAs), for a total of 49 PAs
and 98 villages. From each village, initially five households, and later four to speed
POLICIES AND PROGRAMS IN THE HIGHLANDS OF AMHARA
223
up the data collection, were randomly selected to give a total of 434 households. In
addition, all plots (1,422 in total) operated by the household were surveyed.
Information collected through structured surveys includes presence of programs
and population in the community, household structure and endowments, house-
hold access to infrastructure and services, plot characteristics (mode of acquisition,
size, slope, quality, crops cultivated, etc.), land investments, land management
practices, inputs, and agricultural production in 1999. Recall methods were also
used to obtain information before 1999, specifically 1991. Data on altitude were
collected using a global positioning system (GPS). The primary data were supple-
mented by secondary information on amount of rainfall in 1999, obtained from
the Meteorological Services Agency for weather stations located in the districts
where the surveys were carried out.6
Data
Plot acquisition, tenure contracts, and land rights. In 1975, land was nationalized,
and households were given use rights only, with occasional redistribution of farm-
land to accommodate landless households. Since 1991, households have been given
the right to use the land indefinitely, lease it out temporarily to other farmers, and
transfer it only to their children. However, they cannot sell or mortgage the land.
In the Amhara region, land redistribution to address the increasing problem of
landlessness and equalize landholding and quality of farmland has been common.
There has been at least one land redistribution in about 73 percent of the villages
since 1991, with the average number being three.7 One of the villages interviewed
had experienced as many as 14 land redistributions since 1975.
About 89 percent of the plots surveyed were cultivated by their owners, that is,
by those receiving the land directly from the government or through gift, inheri-
tance, or permanent exchange. These plots are referred to as owner-cultivated plots.
The remaining 11 percent of the plots were mainly obtained through temporary
farmer-to-farmer exchanges in the form of rental, mostly sharecropping. Renting in
and out of plots of land is also common in other parts of the country, about 14 per-
cent in Tigray region (Pender, Gebremedhin, and Haile 2002) and 11 percent in
Oromiya region (Jabbar and Ayele 2002). Contracts for rented plots were very short
(one season or year on average), and equal sharecropping (one-half of crop output
to landowner) was the common practice. For fixed leases, rents were about 250ş
550 birr per hectare, depending on the quality of the land.8
Land rights associated with exchange, transfer, and making long-term invest-
ments were exclusive to owner-cultivated plots. There seems, however, to be a high
level of restriction on rented plots even for simple activities such as crop choice and
224
SAMUEL BENIN
grazing animals. Tenants could not choose what type of crops to plant on 50 per-
cent of the rented plots, and they could not graze their animals on 28 percent of the
rented plots. Expectations to operate the plot over the next 5 or 10 years or to be-
queath the plot were almost 100 percent on owner-cultivated plots but were between
20 and 28 percent on rented plots.9 The main reason for expecting not to operate
the plot in the future was fear of land redistribution on owner-cultivated plots and
termination of rental contract or uncertainty of renewal of contract on rented plots.
Land investments and adoption of management practices and modern inputs. The
presence of long-term land investments on plots was generally low. The most com-
mon types of investment were drainage ditches, occurring on 39 percent of all plots
(Table 9.1). Stone terraces, fences, and live fences were next, ranging from 12 to
22 percent of all plots. Check dams, soil bunds, grass strips, and tree planting
accounted for between 1 and 5 percent of all plots. There were some statistically
significant differences in investments by land tenure. The incidence of stone ter-
races, live fences, trees, and check dams was significantly higher on owner-cultivated
plots compared to rented plots, whereas the incidence of drainage ditches was
higher on rented plots. In fact, there were no trees or check dams on rented plots.
Possibly, owners of rented plots identify those as less productive or too far away and
so did not invest in them before renting out, whereas those renting them have little
or no incentive to invest in them. Note that it is not possible in the data to link
Table 9.1 Percentage of plots with investment by land tenure and redistribution in the highlands
of Amhara region, Ethiopia
Land redistribution
in village
Land tenure
since 1991
Type of investment
All plots
Owner-cultivated
Rented
No
Yes
Stone terrace
21.9
23.5*
9.3*
26.4
19.9
Soil bund
3.2
3.2
3.6
1.2*
3.8*
Check dam
1.4
1.6*
0.0*
1.5
1.4
Drainage ditch
39.2
37.5*
52.6*
18.6*
47.4*
Irrigation canal
3.3
3.5
1.6
5.1
2.7
Grass strip
4.9
5.2
2.72.1*
5.8*
Planting trees
2.8
3.1*
0.0*
1.1*
3.3*
Fence
16.2
15.3
23.0
9.1*
18.8*
Live fence
12.5
13.7*
2.8*
11.4
13.0
Number of plots
1,187.0
1,057.0
130.0
346.0
841.0
Note: Rented plots include sharecropped and fixed-fee rented plots. Sample means are adjusted for stratification,
weighting, and clustering of sample.
*Sample means in the relevant category are different at the 10 percent level of significance.
POLICIES AND PROGRAMS IN THE HIGHLANDS OF AMHARA
225
Table 9.2 Percentage of plots using land management practice by land tenure and redistribution
in the highlands of Amhara region, Ethiopia
Land redistribution
in village
Land tenure
since 1991
Type of investment
All plots
Owner-cultivated
Rented
No
Yes
Reduced tillage
25.2
25.721.1
22.5
25.1
Contour plowing
69.3
69.6
67.4
82.8*
64.9*
Crop rotation
62.4
63.7*
53.6*
64.4
60.8
Crop residues
64.0
64.0
59.6
73.9*
59.2*
Household refuse
17.4
19.4*
3.7*
17.6
17.5
Manure
9.0
9.8*
2.7*
10.6
8.4
Chemical fertilizers
34.5
32.1*
53.3*
10.6*
44.3*
Improved seeds
13.0
11.7*
22.7*
2.4*
17.0*
Number of plots
1,187.0
1,057.0
130.0
346.0
841.0
Note: Rented plots include sharecropped and fixed-fee rented plots. Sample means are adjusted for stratification,
weighting, and clustering of sample.
*Sample means in the relevant category are different at the 10 percent level of significance.
rented plots to their respective owners in order to verify this. Where there were
statistical differences by land redistribution, the incidence of investments on plots
was higher in villages that have experienced at least one land redistribution since
1991. Villages experiencing land redistribution tended to be located more in the
high-potential areas where such investments are more profitable.
Table 9.2 shows the most common land management practices used on the
plots, including contour plowing (occurring on 66 percent of all plots), plowing in
crop residues (64 percent), and crop rotation (62 percent). Reduced tillage was used
on 25 percent of all plots, and chemical fertilizer, household refuse, and improved
seed and manure were used on 35, 17, 13, and 9 percent of all plots, respectively.
The low incidence of manure use on plots is likely because it is also used as fuel.
However, increased use of chemical fertilizers under implementation of the massive
agricultural package program, which led to a substantial increase in the cultivated
area under chemical fertilizers, may have also reduced the need for manure. Here
too, there were some differences by land tenure and land redistribution. Applying
household refuse and use of manure were more common on owner-cultivated than
rented plots. On the other hand, using fertilizers was more common on rented plots.
This may reflect the relative long-term versus short-term return on investment in
different inputs, where those with immediate (one season) benefits are preferred on
rented plots. It is likely that renters have more resources including access to credit
to finance the purchase and use of chemical fertilizers. However, most of the rented
226
SAMUEL BENIN
plots are sharecropped, where sharing of chemical fertilizer cost is a common fea-
ture. Thus, the cost (and risk) of applying chemical fertilizer is reduced for each
party, which increases the likelihood of using chemical fertilizers on rented plots.
Moreover, several of the rented plots were planted to maize on which chemical fer-
tilizers are commonly applied. Looking at the differences by land redistribution
shows that use of chemical fertilizers and improved seeds was greater in villages
that have experienced land redistribution, whereas use of contour plowing and crop
residues was less. As mentioned earlier, villages experiencing land redistribution
were located more in the high-potential areas, where use of chemical fertilizers and
improved seeds is more profitable.
Land use, inputs, and crop production. A majority of the plots (76 percent) were
located in the fields, as opposed to those cultivated on the compound of the
household (homestead, 24 percent). With very little irrigation (about 4 percent of
all plots) and unreliable small rains (belg), crop production was restricted to the
main rainy season, which is normally from June to October. Cereals dominated the
crops cultivated. Teff, barley, wheat, and maize were the dominant monocropped
cereals, taking up 50 percent of all plots. Other cereals (sorghum, millet, and oat),
either monocropped or mixed with other cereals, made up 14 percent of the plots,
and cereals mixed with other noncereal crops made up 16 percent. Legumes culti-
vated as monocrops made up 11 percent of all plots. The remaining 9 percent of the
plots were cultivated with other crops or combinations of crops, excluding cereals.
The amounts of inputs used are shown in Table 9.3. For all plots, 287 man-
days, 54 animal-days, and 256 birr of labor, draft power, and seed were used per
hectare of land, respectively. With the exception of labor, the use of which was sta-
tistically significantly higher on owner-cultivated than on rented plots, use of other
inputs was not statistically different by land tenure or land redistribution. It is puz-
zling why labor was much lower (about 50 percent) on rented plots than on owner-
cultivated plots. Possibly, renters underestimated or did not report the contribution
of landowners. Recall that most of the rented plots were sharecropped where land-
owners often contributed labor. The average value of crop yield for all plots was
2,829 birr per hectare (Table 9.3).10 Consistent with the higher use of inputs on
owner-cultivated plots or in villages that have had at least one land redistribution
since 1991, average yield was also higher, although the difference is not statistically
significant.
Production and sociocultural environment. The highlands of Ethiopia are typi-
cally very densely populated. The highlands account for about 45 percent of the
total area of the country, but they are home to about 80 percent of the total human
POLICIES AND PROGRAMS IN THE HIGHLANDS OF AMHARA
227
Table 9.3 Amounts of inputs used and value of output by land tenure and redistribution in the
highlands of Amhara region, Ethiopia
Land
redistribution in
Land tenure
village since 1991
Type of investment
All plots
Owner-cultivated
Rented
No
Yes
Labor (man-days/hectare)
286.8
304.3*
157.6*
257.3
297.5
Draft animal (animal-days/hectare)
54.3
54.751.6
50.3
55.8
Seed (birr/hectare)
255.8
258.8
233.727
3.7249.4
Value of crop yield (birr/hectare)
2,829.1
2,887.6
2,407.1
2,703.4
2,874.4
Number of plots
1,187.0
1,057.0
130.0
346.0
841.0
Note: Rented plots include sharecropped and fixed-fee rented plots. Sample means are adjusted for stratification,
weighting, and clustering of sample.
At the time of the survey, US$1 8.50 Ethiopian birr.
*Sample means in the relevant category are different at the 10 percent level of significance.
population and 75ş80 percent of the cattle and sheep (Degefe and Nega 2000).
The survey data show an average of about 45 households per square kilometer in
each village. Rapid population growth has increased the demand for farmland and
contributed to farming on fragile lands, especially on hillsides with steep slopes,
which are traditional grazing areas. Compared to Tigray region and others, the
region has relatively good rainfall, with an average annual rainfall of 1,408 milli-
meters.11 The average elevation was 2,172 meters above sea level, and the average
distance to the district town was 34 km. When these characteristics were examined
by agricultural potential, population densities and rainfall amounts were higher in
high-potential areas. Villages in high-potential areas also had better access to their
respective district towns (less than one-half of the average distance in low-potential
areas) and were also located at relatively lower altitudes.
The sociocultural environment is shaped by the evolution and historical dis-
tributions of population settlement norms and, particularly in this context, those
that affect attitudes and behavior toward organization of agricultural production.
The administrative zones (North and South Gondar, Awi, East and West Gojjam,
Wag Hamra, Oromia, North and South Wollo, and North Shewa) best capture the
major sociocultural differences in the population across the region.12 The North
and South Gondar (representing about 30 percent of the sample) and North Shewa
(14 percent) zones are evenly distributed as low and high agricultural potential.
The Awi (3 percent) and East and West Gojjam (33 percent) zones are mostly of
high potential, whereas North and South Wollo (20 percent) zones are mostly of low
potential.
228
SAMUEL BENIN
Econometric Approach and Results
Econometric Approach
Econometric techniques were used to estimate equations (9.1) and (9.2) presented
in the conceptual framework. Specifically, we estimate and present regression results
for (1) whether various land management practices, including use of reduced tillage,
contour plowing, crop rotation, crop residues, household refuse, manure, chemical
fertilizers, and improved seeds, were used by farmers on their farm plots in 1999;13
(2) amount of labor and draft animal power and value of seed used by farmers per
hectare in 1999; and (3) value of crop yield (total output per hectare) in 1999.
Table 9.4 shows detailed description and summary statistics of the dependent
and endogenous variables. The econometric models used to estimate them depend
on how they are measured. For land management practices, probit models were used
to explain the probability of the management practice being used on the plot. Least-
squares models were used to explain the amount of labor, draft animal, and seed used
per hectare and value of crop yield obtained. Although not reported, the determi-
nants of extension visits and crop choice were also estimated, and the results used to
enrich the discussion of the chapter. Ordered probit and multinomial logit models
were used to estimate the probability of receiving extension and planting a particu-
lar crop or mix of crops, respectively.14
The explanatory variables used in the regressions are operational measure-
ments of the factors discussed in the conceptual framework. Detailed description
and summary statistics of the explanatory variables are also shown in Table 9.4,
grouped first by those used in estimating both equations (9.1) and (9.2) and those
excluded from the value of crop yield equation. How the variables were partitioned
will be explained shortly under estimation procedure. Then, within the two cate-
gories, they are grouped by plot-, household-, village/district-, and subregional-
level factors. Among the plot-level factors, the variables include whether the plot is
owner-cultivated or not and whether the farmer expects to operate the plot in the
next five years or not. Others include size, slope, perception of soil depth, soil color,
and waterlogging problems, presence of gullies, irrigation, stone terraces, and soil
bunds or fences, location of plot (homestead versus field), and walking time from
plot to residence. Household factors include endowments of human capital (gen-
der and age structure, size, and education), physical capital (size of farm operated,
number of oxen, and total stock of livestock measured in tropical livestock units),15
financial capital (exogenous income and access to credit), and access to infrastruc-
ture and services. The village/district-level factors include whether there was a land
redistribution since 1991 or not, population density, altitude, rainfall, distance to
the district town, availability of inputs, and social capital (presence of various local
POLICIES AND PROGRAMS IN THE HIGHLANDS OF AMHARA
229
associations). For ease of estimation, the region is divided into four subregions: the
northern part (North and South Gondar zones), the western part (Awi and East
and West Gojjam zones), the eastern part (North and South Wollo zones), and the
southern part (North Shewa zone).
Estimation Procedure
As the conceptual framework specified in equations (9.1) and (9.2) shows, land
management practices, inputs, extension, and crop choice are endogenous in the
crop production function. This endogeneity problem can be addressed by estimat-
ing the value of the crop yield equation by a two-stage procedure in which land
management practices, inputs, extension, and crop choice are predicted from the
first stage and used in the second-stage estimation of the value of crop yield regres-
sion. Some of the explanatory variables used in the first-stage estimation are excluded
from the second-stage estimation. This procedure is similar to estimating the value
of the crop yield equation by instrumental variables (IV), where the excluded ex-
planatory variables in the second stage are the instruments. Finding appropriate
instruments can be challenging because one needs to find variables (at least one
for each explanatory endogenous variable) that are correlated with the endogenous
explanatory variables being instrumented (i.e., land management practices, inputs,
extension, and crop choice) but not correlated with the dependent variable (i.e.,
value of crop yield after controlling for the explanatory variables in equation [9.1]).
First, potential exogenous variables that were hypothesized to have an influ-
ence on land management practices, inputs, extension, and crop choice but no
hypothesized direct effect on value of crop yield, in addition to the exogenous and
endogenous explanatory variables specified in equation (9.1), were used directly in
the value of crop yield model. The variables finally selected for exclusion from the
value of crop yield regression model were those exogenous variables that had a zero
effect (separately and jointly) on value of crop yield.
Ordinary least squares (OLS) and IV were used to estimate value of crop yield.
Then endogeneity bias, potentially resulting from using the actual values of the
endogenous explanatory variables (OLS method) rather than their predicted values
(IV method), was tested for using a Hausman test (Hausman 1978; Greene 1993).16
Exogeneity of land management practices, inputs, extension, and crop choice in the
cereal yield regression was not rejected, suggesting that the OLS gives consistent
and efficient estimates. Thus, only the OLS results are reported and discussed.
Recall that several of the factors specified in equation (9.2) with important
potential policy implications (e.g., access to infrastructure and services) for increas-
ing cropland productivity may in theory have only indirect effects on value of crop
yield via their effect on land management practices, inputs, extension, and crop
Table 9.4 Detailed description and summary statistics of variables, by agricultural potential
Low-potential
High-potential
Total sample
areas
areas
Variable name
Variable description
Mean
S.E.
Mean
S.E.
Mean
S.E.
t-test
Endogenous variables
Value of crop yield
Value of total crop output per hectare (Ethiopian birr/ha)
2,829.110
285.285
3,252.907322.046
2,57
6.460
412.893
Crops (cf. other crops)
Proportion of plot allocated to crops (compared to noncereals)
Barley only
Barley only
0.135
0.013
0.1970.026
0.0970.015
*
Maize only
Maize only
0.079
0.010
0.039
0.011
0.105
0.016
*
Wheat only
Wheat only
0.086
0.010
0.120
0.0170.064
0.012
*
Teff only
Teff only
0.1970.015
0.164
0.021
0.218
0.022
*
Other cereals
Other cereal crops or combination of cereal crops
0.142
0.016
0.116
0.016
0.159
0.023
Cereal and other crops
Cereals mixed with other crops
0.158
0.015
0.143
0.020
0.1670.020
Legumes only
Leguminous crops only
0.114
0.013
0.1570.019
0.088
0.018
*
Extension (cf. 0 visits)
Number of visits by an extension agent (compared to no visit)
1ş5 visits
1ş5 visits
0.305
0.038
0.362
0.048
0.269
0.055
6ş10 visits
6ş10 visits
0.193
0.035
0.140
0.033
0.2270.053
More than 10 visits
More than 10 visits
0.163
0.031
0.1370.032
0.17
9
0.047
Use of reduced tillage
Dummy variable equal to 1 if reduced tillage is used, 0 otherwise
0.244
0.029
0.389
0.043
0.154
0.040
*
Use of contour plowing
Dummy variable equal to 1 if contour plowing is used, 0 otherwise
0.6970.029
0.7
570.033
0.659
0.042
*
Use of crop rotation
Dummy variable equal to 1 if crop rotation is used, 0 otherwise
0.618
0.028
0.490
0.041
0.698
0.038
*
Use of crop residues
Dummy variable equal to 1 if crop residue is plowed in, 0 otherwise
0.631
0.035
0.640
0.048
0.625
0.050
Use of household refuse
Dummy variable equal to 1 if household refuse is used, 0 otherwise
0.175
0.010
0.155
0.017
0.188
0.014
Use of manure
Dummy variable equal to 1 if manure is used, 0 otherwise
0.090
0.010
0.102
0.018
0.082
0.012
Use of chemical fertilizers
Dummy variable equal to 1 if chemical fertilizer is used, 0 otherwise
0.353
0.029
0.1070.017 0.5070.042
*
Use of improved seeds
Dummy variable equal to 1 if improved seed is used, 0 otherwise
0.131
0.022
0.040
0.010
0.188
0.034
*
Amount of labor
Amount of total labor used (excluding harvest and postharvest)
286.854
32.592
297.530
38.237
280.177
47.252
(man-days/hectare)
Amount of draft power
Amount of total draft animal used (excluding threshing) (animal-days/hectare)
54.379
4.378
49.385
4.745
57.502
6.485
Value of seed
Value of total seed used (Ethiopian birr/hectare)
255.880
31.663
233.012
17.820
270.184
50.174
Exogenous variables (for all
endogenous variables)
Plot-level factors
Owner-cultivated
Dummy variable equal to 1 if plot is cultivated by the owner, 0 otherwise
0.880
0.020
0.956
0.014
0.833
0.030
*
Expectation to operate
Dummy variable equal to 1 if plot is expected to be operated within the next
0.885
0.021
0.964
0.013
0.836
0.032
*
5 years, 0 otherwise
Size
Size of plot (x10 m2)
0.335
0.0170.295
0.021
0.359
0.025
*
Slope
Average slope of the plot (degrees)
5.735
0.347
7.032
0.550
4.923
0.425
*
Soil depth (cf. deep)
Farmers' perception of depth of the soil on plot (proportion, compared to
"deep" soil)
Medium
Medium
0.595
0.025
0.564
0.032
0.615
0.035
Shallow
Shallow
0.228
0.019
0.301
0.0270.183
0.025
*
Soil color (cf. black)
Farmers' perception of color of the soil on plot (proportion, compared to
"black" soil)
Brown
Brown
0.2970.027 0.3370.035
0.27
2
0.038
Gray
Gray
0.076
0.013
0.093
0.023
0.066
0.017
Red
Red
0.342
0.031
0.180
0.026
0.442
0.046
*
Presence of gullies
Dummy variable equal to 1 if there are gullies on the plot, 0 otherwise
0.042
0.008
0.066
0.014
0.028
0.010
*
Waterlogging problem
Dummy variable equal to 1 if water logging is a problem on the plot, 0 otherwise
0.078
0.012
0.095
0.020
0.068
0.016
Investments on plot
Irrigation
Dummy variable equal to 1 if plot is irrigated, 0 otherwise
0.039
0.008
0.025
0.008
0.048
0.012
Stone terraces
Dummy variable equal to 1 if there are stone terraces on plot, 0 otherwise
0.216
0.019
0.365
0.029
0.124
0.025
*
Drainage ditch
Dummy variable equal to 1 if there are drainage ditches on plot, 0 otherwise
0.3970.034
0.160
0.030
0.546
0.052
*
Live fence
Dummy variable equal to 1 if there are live fences (e.g., living trees) on plot,
0 otherwise
0.126
0.013
0.094
0.020
0.146
0.019
*
Fence
Dummy variable equal to 1 if there are non-live fences on plot, 0 otherwise
0.162
0.023
0.106
0.020
0.1970.034
*
Household-level factors
Gender of head
Dummy variable equal to 1 if household head is male, 0 otherwise
0.964
0.012
0.976
0.016
0.956
0.018
Average education
Average education of household members (years)
42.911
0.88744.562
1.008
41.87
8
1.300
Age of head
Age of household head (years)
1.887
0.187
1.756
0.174
1.969
0.283
Size of farmland
Size of the total landholding of the household (x10 m2)
1.278
0.062
0.935
0.061
1.492
0.088
*
Number of oxen
Number of oxen owned by the household
1.616
0.083
1.336
0.0871.7
92
0.120
*
Tropical livestock units
Number of tropical livestock units owned by the household
3.918
0.216
3.5470.281
4.151
0.301
(c o n t i nu e d )
Table 9.4 (continued)
Low-potential
High-potential
Total sample
areas
areas
Variable name
Variable description
Mean
S.E.
Mean
S.E.
Mean
S.E.
t-test
Village/district-level factors
Land redistribution
Dummy variable equal to 1 if land redistribution occurred in village after 1991,
0 otherwise
0.734
0.031
0.627
0.044
0.802
0.043
Household density
Number of households in the village per square kilometer
44.757
1.529
38.470
1.514
49.035
2.289
*
Altitude
Average altitude in the village (meters above sea level)
2,171.955
33.532
2,296.283
47.795
2,087.357
43.946
Rainfall
Annual rainfall (millimeters)
1,407.815
33.931
1,049.204
15.281
1,632.131
47.761
*
Subregional location
Location (cf. Southern)
Subregional location of household (compared to North Shewa Zone)
Northern
Dummy variable equal to 1 if North/South Gondar Zones, 0 otherwise
0.2970.033
0.331
0.028
0.27
6
0.052
Western
Dummy variable equal to 1 if Awi/East/West Gojjam Zones, 0 otherwise
0.3570.027 0.016
0.002
0.57
1
0.047*
Eastern
Dummy variable equal to 1 if North/South Wollo Zones, 0 otherwise
0.1970.016
0.509
0.032
0.002
0.000
*
Variables excluded from the
value of crop yield equation
Plot level
Homestead plot
Dummy variable equal to 1 if plot is located in the homestead, 0 otherwise
0.240
0.012
0.238
0.018
0.241
0.015
Plot to residence
Walking time in minutes from the plot to the household's residence
15.850
1.008
18.026
1.360
14.488
1.414
*
Household level
Household size
Number of household members
6.855
0.206
6.553
0.204
7.043
0.306
Proportion male
Proportion of household members that are male
0.542
0.012
0.5070.016
0.563
0.016
*
Dependency ratio
Proportion of household members less than 15 years old or more than
59 years old
0.540
0.013
0.519
0.0170.553
0.019
Exogenous income
Sum of remittances, food aid, gifts, and pension (Ethiopian Birr)2
76.815
10.910
156.171
24.704
27.177
7.766
*
Access to markets or services
Walking time in minutes from the household's residence to the nearest
market/service
Drinking water
Drinking water source in the main cropping season
10.770
0.711
13.146
1.214
9.284
0.859
*
Grain mill
Grain mill
56.062
3.877
88.117
7.748
36.011
3.325
*
All-weather road
All-weather road
180.372
10.694
274.296
23.310
121.622
8.062
*
Development agent
Development agent's office
38.791
2.478
53.790
4.690
29.430
2.396
*
Bus service station
Bus service station
205.270
11.342
304.282
25.152
143.336
7.935
*
Fuelwood
Fuelwood source in main cropping season
54.212
4.516
68.714
6.909
44.996
5.866
*
Input supply shop
Input supply shop
145.704
8.347
211.117
13.708
104.768
8.768
*
Village/district-level factors
Distance to district town
Average distance from the peasant association to the district town (kilometers)
33.536
1.936
51.058
3.851
20.926
1.115
*
Access to fertilizers
Dummy variable equal to 1 if chemical fertilizers are available in the village,
0 otherwise
0.972
0.008
0.929
0.022
1.000
0.000
*
Access to improved seeds
Dummy variable equal to 1 if improved seeds are available in the village,
0 otherwise
0.876
0.027
0.927
0.020
0.844
0.041
*
Access to purchased feed
Dummy variable equal to 1 if livestock feed can be purchased in the village,
0 otherwise
0.499
0.040
0.702
0.045
0.373
0.056
*
Access to credit
Dummy variable equal to 1 if credit from Amhara Credit and Savings Institution
is available in the village, 0 otherwise
0.216
0.034
0.0970.027 0.290
0.053*
Presence of local association
Dummy variable equal to 1 if local association or organization or cooperative is
present in the village, 0 otherwise
Input cooperative
Input cooperative
0.3970.039
0.151
0.028
0.550
0.055
*
Marketing cooperative
Marketing cooperative
0.044
0.011
0.114
0.028
0.000
0.000
*
Women's/youth
Women's/youth
0.955
0.012
1.000
0.000
0.9270.020
*
Church
Church
0.944
0.009
0.858
0.025
0.998
0.000
*
Water users
Water users
0.536
0.040
0.452
0.048
0.589
0.056
*
Note: Agricultural potential is an adaptation of the classification used by the Ethiopian Disaster Prevention and Preparedness Commission, referring to non-drought-prone districts as high-
agricultural-potential areas (located to the west and southern tip of the region) and drought-prone districts as low-agricultural-potential areas (located to the east) (see Fig. 9.1).
Sample means and standard errors are adjusted for stratification, weighting, and clustering of sample.
At the time of the survey, US$1 8.50 Ethiopian birr.
*Sample means are different by agricultural potential at the 10 percent (or less) level of significance.
234
SAMUEL BENIN
choice. In order to examine the direct and indirect effects, a reduced-form model
that excludes the endogenous variables as explanatory variables but includes the in-
struments (discussed earlier) is also estimated. The reduced-form specification allows
estimation of the total effects of the exogenous explanatory variables on crop pro-
duction. Furthermore, it eliminates the potential for endogeneity bias altogether.
In estimating the inputs (labor, draft animal power, and seed) and value of crop
yield models, a logarithmic Cobb-Douglas specification was used.17 This specifica-
tion was chosen on empirical merit. For example, the translog specification, which
is a more flexible form, was also attempted but not utilized because of severe multi-
collinearity problems introduced by the interaction and other terms. The logarith-
mic transformation also reduces problems resulting from outliers and nonnormality
of the error term when an ordinary linear specification is used.
An attempt was made to examine the effect of interactions between some key
variables on value of crop yield model, for example, the complementary effects of
moisture-enhancing technologies and modern inputs. Various interactions among
use of chemical fertilizers, improved seeds, irrigation, and stone terraces were tried.
However, the interaction variables were dropped from the final regressions because
there were too few observations (less than 2 percent in many cases) to warrant a
reliable estimation, the results being very sensitive to a few positive observations.
Finally, the models were estimated for the total sample and then separately for low-
and high-agricultural-potential areas to provide information on the relative contri-
bution of the policies and programs to technology adoption, land management, and
productivity in the two production environments. Statistical test results show, except
for use of reduced tillage, household refuse, and manure, significant differences in the
effects of the explanatory variables between low- and high-agricultural-potential
areas, suggesting that the observations should not be pooled in the regressions.18
Thus, only results from estimation of the restricted models for use of reduced
tillage, household refuse, and manure and the unrestricted models for the others
are reported and discussed.
Generally, the different regression models were estimated and presented in
order to provide as much information as possible as well as to generate a greater
degree of confidence in the robustness of the econometric results. STATA software
(StataCorp 2005) was used for the regression analysis, and the results are corrected
for sample stratification, weighting, and clustering.
Regression Results
Detailed results of the econometric estimations are shown in Tables 9.5ş9.7.
Because of the large amount of output, which in turn is related to the large num-
ber of explanatory variables used,19 discussion of the results is limited to those vari-
POLICIES AND PROGRAMS IN THE HIGHLANDS OF AMHARA
235
ables that are of interest in this chapter in order to conserve space. Thus, although
all the estimated coefficients associated with the explanatory variables are reported
for all the regression models, the discussion of results focuses on the effects of land
redistribution and tenure, plot and farm size, household endowments (gender,
education, oxen, and livestock ownership), population density, and access to infra-
structure and services. The effects of irrigation, stone terraces, extension, land man-
agement practices, and use of conventional inputs (labor, draft animal, and seeds)
and modern inputs (improved seeds and chemical fertilizers) on value of crop yield
are also discussed.
Adoption of land management practices. Table 9.5 shows regression results for
use of reduced tillage, household refuse, and manure on household farm plots for
the total sample and for use of contour plowing, crop rotation, crop residues,
chemical fertilizers, and improved seeds on household farm plots by agricultural
potential.
With other factors controlled, owner-cultivated plots compared to rented plots
were associated with a greater likelihood of using crop rotation and plowing in crop
residues in high-potential areas only. Although it is meant to replenish soil fertility,
Benin, Ehui, and Pender (2003b) argue that the concept of crop rotation as used in
the Ethiopian highlands can be misleading because the rotation cycles practiced by
farmers to incorporate legumes or fallow may not be long enough to be effective.
In high-potential areas too, rented plots compared to owner-cultivated plots were
associated with greater likelihood of using improved seeds, which is consistent with
other observations that rented plots were planted more to maize for which improved
seeds were used more. In general (i.e., in both low- and high-potential areas), inci-
dence of manure use was lower on owner-cultivated plots than on rented plots,
whereas in low-potential areas, incidence of use of chemical fertilizers and improved
seeds was greater on owner-cultivated plots. Plots located in villages where there
had been land redistribution were associated with lower likelihood of using several
of the land management practices, especially in low-potential areas.
Larger plots were associated with greater likelihood of use of crop rotation in
general and plowing in crop residues or using chemical fertilizers and improved
seeds in high-potential areas in particular. Larger farms in low-potential areas were
associated with greater likelihood of using contour plowing and improved seeds
but lower likelihood of plowing in crop residues. In high potential areas, larger
farms were associated with greater likelihood of using chemical fertilizers.
Irrigated plots were associated with greater likelihood of using household refuse
but, surprisingly, lower likelihood of using chemical fertilizers in both low- and
high-potential areas and lower likelihood of using improved seeds in low potential
236
SAMUEL BENIN
Table 9.5 Probit regression results of use of land management practice by agricultural potential in
the highlands of Amhara region, Ethiopia, 1999
Reduced
Contour plowing
Crop rotation
tillage
Low-
High-
Low-
High-
Total
potential
potential
potential
potential
sample
areas
areas
areas
areas
Plot-level factors
Owner-cultivated
ş0.396
ş1.802***
0.189
ş0.412
0.679*
Expectation to operate
0.445
1.534*
ş0.314
ş0.374
0.407
Ln Size
0.010
ş0.058
0.018
0.220**
0.279***
Ln Slope
0.026**
0.126***
0.083***
ş0.035**
0.031*
Soil depth (cf. deep)
Medium
0.848***
0.380
ş0.271
ş0.361
ş0.010
Shallow
0.783***
0.324
ş0.168
ş0.362
0.232
Soil color (cf. black)
Brown
ş0.415**
0.389
0.5570.130
ş0.120
Gray
0.033
0.193
0.625
0.016
ş0.377
Red
0.134
0.3670.245
0.356
0.366
Presence of gullies
0.274
1.041***
ş0.579
ş0.001
ş0.087
Water logging problem
ş0.165
0.261
0.970**
ş0.508*
0.162
Investments on plot
Irrigation
ş0.100
ş0.736
ş0.159
0.170
0.870
Stone terraces
0.043
0.834***
1.525***
ş0.072
0.203
Drainage ditch
0.015
0.289
0.644***
ş0.408
ş0.021
Live fence
ş0.909***
0.011
0.039
ş0.206
ş0.039
Fence
ş0.193
0.915***
0.634**
0.339
0.133
Household-level factors
Gender of head
ş1.065***
ş0.793
0.314
ş0.100
0.248
Ln Age of head
ş1.276***
ş0.686
0.045
ş0.216
ş0.358
Average education
ş0.142***
ş0.063
0.079
0.031
ş0.140***
Ln Size of farmland
0.025
0.447**
0.034
0.025
ş0.203
Number of oxen
0.332***
0.046
ş0.123
ş0.459***
ş0.374*
Tropical livestock units
ş0.128***
ş0.022
0.026
0.159***
0.157*
Village/district-level factors
Land redistribution
ş0.004
ş0.762**
ş0.485
ş0.625**
0.358
Ln Household density
ş1.397***
ş1.855***
0.091
ş0.235
ş0.037
Ln Altitude
1.108**
ş1.259
1.438
0.415
ş1.544
Ln Rainfall
1.991***
6.197***
2.159***
0.710
1.279
Subregional location
Location (cf. Southern)
Northern
ş0.804***
0.767*
0.034
ş0.091
ş1.611**
Western
ş5.156***
0.278
1.647
0.869
ş1.624**
Eastern
1.457***
2.164***
2.312***
ş0.754*
1.409
Variables excluded from the value of crop
yield equation
Plot level
Homestead plot
0.070
0.480*
0.271
0.128
ş0.613***
Ln Plot to residence
0.002
0.010*
0.000
ş0.007ş0.011***
POLICIES AND PROGRAMS IN THE HIGHLANDS OF AMHARA
237
Use of
Use of
Crop residues
Household
chemical fertilizers
improved seeds
refuse
Manure
Low-
High-
Low-
High-
Low-
High-
potential
potential
Total
Total
potential
potential
potential
potential
areas
areas
sample
sample
areas
areas
areas
areas
ş0.156
0.874*
ş0.103
ş0.811**
0.692*
0.881
1.686*
ş1.514***
1.079
ş1.273***
ş0.754*
0.935**
ş0.552
ş1.176**
ş0.375
0.897
0.143
0.244*
ş0.115
ş0.070
0.111
0.674***
ş0.127
0.440**
ş0.002
ş0.011
ş0.068***
ş0.031
ş0.115***
ş0.048***
ş0.333***
0.023
0.457*
ş0.372
0.367
0.052
0.228
0.035
0.730
ş0.649
1.326***
ş0.434
ş0.532
ş0.624*
0.408
0.610
0.318
ş0.466
ş0.303
0.956***
0.379
0.652***
0.110
ş0.132
1.089***
ş0.125
ş0.453
1.210***
0.729*
0.731**
0.589
ş1.013*
1.398***
ş1.915**
0.329
0.934***
0.486
0.567*
ş0.215
0.262
ş0.934*
1.339***
ş1.369***
ş0.724
ş1.656***
ş0.438
ş0.353
ş0.226
2.405***
1.068**
0.783***
0.394
0.369
ş0.311
ş0.008
0.383
1.010***
ş0.861
ş0.228
ş0.233
1.194***
0.479
ş1.035***
ş1.859***
ş1.709**
0.892
0.463*
ş0.081
ş0.914***
0.069
0.827***
0.720*
0.405
0.315
0.267
0.819***
0.402
0.490***
0.112
0.763***
1.187***
0.159
ş1.075***
ş0.393
0.669***
0.821***
ş0.778*
0.114
ş0.033
ş0.208
0.213
0.120
0.223
0.602***
ş0.174
0.092
0.656
0.173
1.902***
1.572***
0.362
0.688
0.950
0.586
n.e.
ş0.992
ş0.643
ş2.646***
0.862
ş0.403
ş1.147**
ş3.281***
ş1.222
ş2.565***
0.049
ş0.120**
0.015
0.036
ş0.038
0.130*
0.098
0.246***
ş0.357*
ş0.351
0.276
ş0.137
ş0.350
0.803***
1.142***
0.155
0.463***
ş0.219
ş0.467***
ş0.097
0.218
1.396***
0.451
0.466
ş0.173***
0.079
0.204***
0.146**
0.019
ş0.453***
ş0.230*
ş0.047
ş0.965***
1.793***
ş0.396
ş0.535*
0.318
ş2.728***
0.515
ş0.476
1.859***
3.543***
ş0.090
ş0.184
ş0.988**
0.148
2.718***
0.043
3.441***
ş10.821***
0.203
0.529
2.160**
1.741
0.669
7.524*
2.143*
0.121
1.642***
1.829***
0.346
ş1.399
1.585
0.779
ş3.755***
ş0.056
0.353
ş1.445***
1.617**
4.838***
6.290***
7.766
ş2.955***
ş1.140
0.061
ş1.094**
5.527***
5.453***
8.224
4.557
ş3.734***
0.986
1.168
ş0.134
2.884***
2.495*
2.639*
5.265
ş0.014
ş0.106
2.301***
0.825***
0.043
ş0.198
ş0.326
0.800**
0.014***
ş0.011**
ş0.168***
ş0.081***
ş0.005
ş0.016**
ş0.024
ş0.021*
(continued )
238
SAMUEL BENIN
Table 9.5 (continued)
Reduced
Contour plowing
Crop rotation
tillage
Low-
High-
Low-
High-
Total
potential
potential
potential
potential
sample
areas
areas
areas
areas
Household level
Ln Household size
0.749***
0.612
ş0.610
ş0.015
1.067***
Proportion male
0.401
0.722
ş1.596*
ş1.611***
0.590
Dependency ratio
ş0.736
ş0.909
ş2.582***
ş0.037
ş2.483***
Exogenous income
0.000
0.000
ş0.001*
ş0.001*
0.001*
Access to markets or services
Ln Drinking water
ş0.521***
0.019
ş0.093
0.346***
0.405***
Ln Grain mill
0.144
ş0.172
0.021
ş0.114
0.053
Ln All-weather road
0.556***
0.312***
0.710***
ş0.177
ş0.380**
Ln Development agent
ş0.067ş0.010
ş0.599***
0.028
ş0.102
Ln Bus service station
ş0.606***
0.236
ş0.416*
0.625***
ş0.001
Ln Fuelwood
ş0.002
0.007***
ş0.002
ş0.001
ş0.007***
Ln Input supply shop
0.235**
0.2470.220
ş0.441***
0.415**
Village/district-level factors
Ln Distance to district town
ş0.432***
ş1.208***
ş0.685
ş0.202
1.205***
Access to fertilizers
ş1.123***
0.412
n.e.
n.e.
n.e.
Access to improved seeds
1.074***
ş1.037
1.235**
0.837*
0.891*
Access to purchased feed
ş0.841***
0.462
ş0.448
ş0.531*
ş0.056
Access to credit
0.719***
ş0.908*
0.489
ş0.124
0.243
Presence of local association
Input cooperative
1.631***
ş1.387ş1.639*
ş1.351***
0.7
96
Marketing cooperative
ş1.221***
1.595*
n.e.
2.875***
n.e.
Women's/youth
ş1.829***
n.e.
0.844
n.e.
n.e.
Church
ş0.363
ş2.521***
n.e.
ş0.341
ş1.665***
Water users
0.787***
1.167***
0.357
0.272
0.845**
Constant
ş10.591*
ş26.017***
ş24.402*
ş4.769
ş0.775
Wald chi-square
258.470***
173.970***
183.860***
142.620***
159.310***
Pseudo-R 2
0.4970.408
0.448
0.306
0.340
Likelihood ratio testa
48.304
149.92***
120.26***
Note: See Table 9.4 for detailed description of variables. Coefficients and standard errors are adjusted for stratification,
weighting, and clustering of sample.
*, **, and *** mean coefficient is statistically significant at the 10 percent, 5 percent, and 1 percent level, respectively.
Ln means variable is transformed by natural logarithm. n.e. means coefficient was not estimated because the associated vari-
able was dropped to avoid dummy variable trap or because it perfectly predicted the outcome.
POLICIES AND PROGRAMS IN THE HIGHLANDS OF AMHARA
239
Use of
Use of
Crop residues
Household
chemical fertilizers
improved seeds
refuse
Manure
Low-
High-
Low-
High-
Low-
High-
potential
potential
Total
Total
potential
potential
potential
potential
areas
areas
sample
sample
areas
areas
areas
areas
1.713***
1.439***
ş0.740***
ş0.685**
0.378
0.887
ş0.324
1.537**
ş0.9471.015
ş0.980
ş0.447
ş1.517
*
0.069
ş3.939***
0.439
0.205
ş1.467
0.116
0.811
ş1.753*
ş2.494***
1.226
ş2.487*
0.000
0.000
ş0.001
0.000
0.001
ş0.001
0.005***
ş0.002
0.204
0.212
0.151
0.354***
ş0.123
ş0.080
ş0.227ş0.519**
0.689***
0.313*
ş0.411***
ş0.048
0.079
ş0.170
0.528*
ş0.422*
0.205
ş1.369***
ş0.250
0.090
0.269
0.033
0.497**
0.392
ş0.813***
0.102
0.099
0.082
ş0.491***
ş0.690***
ş0.344*
ş0.410
ş0.653***
0.435**
0.481**
0.156
0.101
ş0.236
ş0.650*
0.258
0.005**
0.012***
0.002
0.000
0.000
0.010***
0.004
0.002
1.050***
0.270
ş0.007
0.331***
ş0.112
0.286
ş0.014
ş0.185
0.333
2.486***
0.191
ş0.517***
ş0.299
ş0.686*
0.423
ş1.047
1.911***
n.e.
ş0.110
ş0.216
n.e.
n.e.
n.e.
n.e.
ş1.037
ş2.211***
ş0.204
0.679*
ş0.265
1.769***
n.e.
n.e.
ş1.343***
0.014
ş0.820***
ş0.140
ş0.056
1.535***
ş0.124
1.520
ş0.085
1.446***
ş0.340
ş0.032
ş1.086*
1.094***
ş2.174***
ş0.242
1.288*
ş0.481
ş1.615***
ş1.052***
ş0.404
1.001*
n.e.
3.496***
0.821
n.e.
0.364
0.769
1.017
n.e.
0.204
n.e.
n.e.
ş4.058***
0.464
ş0.898*
n.e.
0.530
n.e.
ş1.770
ş1.524***
n.e.
0.297
ş0.177
ş0.179
n.e.
ş2.644***
n.e.
ş0.974***
ş0.877*
ş0.244
ş0.049
0.464
1.535***
0.440
0.429
49.015***
73.876***
ş17.730*
ş15.739*
ş12.239
ş5.293
ş35.157**
ş63.165
365.02***
323.790***
257.500***
165.580***
189.810***
165.950***
124.990***
95.730***
0.699
0.648
0.691
0.502
0.324
0.545
0.569
0.485
356.67***
38.349
57.197
156.36***
128.80***
aThe likelihood ratio (LR) test, similar to a Chow test in a least-squares regression, is a test of equality of the coefficients in
low- and high-potential areas, where LR = ş2 [ln L
+ ln L
ş ln L
] 2(k); ln L is the log likelihood in regression for
LPA
HPA
pooled
i
low-potential areas only, high-potential areas only, and the pooled data, respectively, and k is the number of coefficients.
240
SAMUEL BENIN
areas. Probably, manure is seen as a substitute for chemical fertilizers. As expected,
the presence of stone terraces was associated with greater likelihood of using chem-
ical fertilizers as well as contour plowing, although it was also associated with lower
likelihood of using household refuse in low-potential areas.
Female-headed households in low-potential areas were more likely to use
reduced tillage on their farm plots, which is expected given the customary prohibi-
tion of women using oxen to plow in many places in the highlands of Ethiopia.
Better-educated households in high-potential areas were less likely to use crop rota-
tion or to plow in crop residues, but they were more likely to use chemical fertilizers
and improved seeds on their farm plots because education enhances the ability of
individuals to utilize technical information associated with such modern inputs.
Ownership of livestock in general, and of oxen in particular, had the opposite
effects. For example, in high-potential areas, although greater ownership of oxen
was associated with greater likelihood of using chemical fertilizers, greater owner-
ship of livestock in general was associated with lower likelihood of using chemical
fertilizers. However, the magnitudes (in absolute value terms) of the effects associ-
ated with ox ownership are larger, indicative of the relative importance of oxen
within the household.
More densely populated villages were associated with a lower likelihood of
using reduced tillage and greater likelihood of plowing in crop residues in general
but greater likelihood of using improved seeds and lower likelihood of using chem-
ical fertilizers in low-potential areas. These findings are mixed regarding the Bose-
rupian (Boserup 1965) perspective about the responses of households to population
pressure. However, some of the findings may be caused by the negative effect of
population pressure on ownership of oxen and livestock (Benin, Ehui, and Pender
2003a; Chapter 6), thereby reducing the capability of households to plow while
easing the demand on crop residues for livestock feed and increasing the likelihood
of recycling them in the soil.
Amount of labor, draft animal power, and seed used. Regression results with
respect to the amount of labor, draft animal power, and seed used on farm plots by
agricultural potential are shown in Table 9.6. Owner-cultivated farms were associ-
ated with greater amounts of labor per hectare in high-potential areas and lower
amounts of animal draft power and seed per hectare in low-potential areas. Villages
in which land redistribution had taken place were associated with lower amounts
of labor and animal draft power in low-potential areas. It seems that in an attempt
to equalize the quality of landholding among households, especially in the low-
potential areas, land redistribution may have made farms more fragmented, and,
consequently, more resources (especially time spent to and from the different plots)
POLICIES AND PROGRAMS IN THE HIGHLANDS OF AMHARA
241
are required per unit of area to manage the farm efficiently, reducing the actual
amount of time spent on a particular plot.
As expected, larger plots were associated with lower amounts of labor, draft
animal power, and seed per hectare. Irrigated plots were associated with greater use
of labor and seed in high-potential areas and greater use of animal draft power in
low-potential areas. Plots with stone terraces were associated with greater amounts
of labor in low-potential areas only, reflecting additional labor input necessary for
their maintenance. The other investments also were positively associated with
some of the inputs, although the effects were different in low- versus high-potential
areas.
Female-headed households were associated with smaller amounts of labor and
animal draft power on their farm plots, which is consistent with the earlier result
that they use more reduced tillage. However, they were associated with greater
amounts of seed used in low-potential areas. Households with more educated mem-
bers were associated with smaller amounts of labor and seed in high-potential areas
and low-potential areas, respectively. Households with more oxen were associated
with using less labor on their farm plots in high-potential areas, suggesting replace-
ment of labor with animal draft power. Greater exogenous (nonfarm) income was
associated with greater use of labor and animal draft power in both low- and high-
potential areas, showing the positive influence of the nonfarm sector in promoting
on-farm investment.
Access to infrastructure and services had mixed and varying effects on the
amounts of the three inputs used in low- versus high-potential areas. For example,
households that were closer to the district town or to an all-weather road were asso-
ciated with lower amounts of labor and animal draft power in high-potential areas.
This likely reflects higher opportunity costs of labor and capital assets among house-
holds with better access to towns where nonfarm employment opportunities are
higher. Availability of formal credit in a village, on the other hand, had opposite
effects and was associated with greater use of labor in low-potential areas but less
use of labor in high-potential areas, which suggest use of credit for different pur-
poses in the two areas.
Value of crop yield. Table 9.7 shows regression results with respect to value
of crop yield (value of total output per hectare) in low- and high-agricultural-
potential areas. The first two sets of results show the direct effects of the explana-
tory variables estimated by OLS. The other two show results of the reduced-form
model (i.e., excluding extension, crop choice, land management practices, and
inputs), which measures the total (direct and indirect) influence of the explanatory
variables included. The discussion is based on the OLS model, the preferred model,
Table 9.6 Regression results of amounts of inputs used by agricultural potential in the highlands of Amhara region, Ethiopia, 1999
Amount of laborAmount of dr
aft power Value of seed
(Ln [man-days/hectare])
(Ln [animal-days/hectare])
(Ln [birr/hectare])
Low-potential
High-potential
Low-potential
High-potential
Low-potential
High-potential
Explanatory variable
areas
areas
areas
areas
areas
areas
Plot-level factors
Owner-cultivated
ş0.200
0.426***
ş0.561***
0.245
ş0.472**
0.052
Expectation to operate
0.277
ş0.193
0.687***
ş0.188
0.805*
ş0.126
Ln Size
ş0.723***
ş0.684***
ş0.771***
ş0.542***
ş0.522***
ş0.572***
Ln Slope
ş0.009
0.008
0.000
ş0.004
0.024***
ş0.017
Soil depth (cf. deep)
Medium
ş0.142
0.020
0.001
0.000
ş0.304**
ş0.265
Shallow
ş0.182
0.038
ş0.065
0.116
ş0.374**
ş0.041
Soil color (cf. black)
Brown
0.024
0.019
ş0.025
0.194
ş0.382***
ş0.048
Gray
0.191
ş0.055
ş0.078
ş0.036
ş0.129
0.284
Red
0.111
0.139
0.026
0.092
ş0.030
ş0.009
Presence of gullies
0.211
0.298
0.011
0.075
ş0.176
ş0.001
Waterlogging problem
ş0.347***
0.073
0.092
ş0.320**
ş0.066
ş0.128
Investments on plot
Irrigation
0.426
1.168***
0.581***
0.258
0.609
1.974***
Stone terraces
0.581***
0.218
0.035
0.212
0.201
ş0.340
Drainage ditch
0.289***
ş0.004
0.422***
0.206*
0.387***
0.090
Live fence
0.192
0.319***
ş0.122
0.081
0.183
0.242
Fence
0.459***
0.249***
0.081
0.278**
0.443***
ş0.064
Household-level factors
Gender of head
1.077***
0.333
0.322*
0.299*
ş0.670*
ş0.210
Ln Age of head
ş0.034
ş0.272
ş0.266*
ş0.449**
ş0.435
ş0.301
Average education
ş0.048
ş0.048*
ş0.025
ş0.003
ş0.063*
ş0.020
Ln Size of farmland
ş0.154*
0.179*
0.131*
ş0.111
ş0.051
ş0.078
Number of oxen
0.073
ş0.217***
0.067
ş0.141
0.125
0.277
Tropical livestock units
0.022
0.054
0.008
0.054
ş0.008
0.009
Village/district-level factors
Land redistribution
ş0.237*
0.363
ş0.316***
0.016
0.097
0.286
Ln Household density
0.336*
ş0.087ş0.053
0.119
0.055
ş0.531**
Ln Altitude
ş0.597*
0.580
ş0.516*
0.518
0.995***
1.691**
Ln Rainfall
ş0.633
ş0.316
ş0.119
0.246
1.124*
ş1.064*
Subregional location
Location (cf. Southern)
Northern
0.566***
ş0.543
0.159
ş0.810***
ş0.338
1.143***
Western
0.568
ş0.688*
0.207ş0.137ş0.961*
0.930**
Eastern
0.359
0.196
0.314*
ş0.061
ş0.153
0.764
Variables excluded from the value of crop yield equation
Plot level
Homestead plot
0.106
0.200**
0.079
ş0.190
ş0.332*
ş0.375**
Ln Plot to residence
0.000
0.000
0.003*
ş0.001
0.002
0.004
Household level
Ln Household size
ş0.142
0.034
ş0.095
0.136
0.469
ş0.095
Proportion of males
0.029
0.609**
0.216
0.872***
0.327
0.729
Dependency ratio
0.180
ş0.822***
0.038
ş0.325
0.023
0.468
Exogenous income
0.001***
0.001***
0.001***
0.001***
0.000
0.000
Access to markets or services
Ln Drinking water
ş0.023
0.015
0.026
0.026
ş0.127ş0.07
1
Ln Grain mill
0.009
ş0.001
0.001
ş0.012
0.050
ş0.089
Ln All-weather road
ş0.083
0.101
0.0070.162*
0.049
0.060
Ln Development agent
0.012
ş0.014
0.015
0.117*
0.030
0.145
Ln Bus service station
0.015
ş0.235***
ş0.063
ş0.158
0.053
ş0.160
Ln Fuelwood
0.001
ş0.002**
0.000
0.002*
0.001
ş0.001
Ln Input supply shop
0.050
0.075
0.041
0.009
ş0.275***
ş0.021
(continued )
Table 9.6 (continued)
Amount of laborAmount of dr
aft power Value of seed
(Ln [man-days/hectare])
(Ln [animal-days/hectare])
(Ln [birr/hectare])
Low-potential
High-potential
Low-potential
High-potential
Low-potential
High-potential
Explanatory variable
areas
areas
areas
areas
areas
areas
Village/district-level factors
Ln Distance to district town
0.113
0.323**
ş0.019
0.080
0.105
0.139
Access to fertilizers
0.161
n.e.
ş0.140
n.e.
ş0.338
n.e.
Access to improved seeds
0.070
ş0.482***
ş0.125
ş0.152
0.136
0.296
Access to purchased feed
ş0.108
ş0.107ş0.013
0.344***
ş0.549***
ş0.231
Access to credit
0.528***
ş0.362**
0.141
0.165
ş0.108
0.222
Presence of local association
Input cooperative
0.053
0.844***
0.2670.485**
ş0.193
ş0.266
Marketing cooperative
ş0.647***
n.e.
ş0.408
n.e.
ş0.103
n.e.
Women's/youth
n.e.
ş0.512*
n.e.
ş0.384
n.e.
1.564***
Church
0.168
n.e.
ş0.001
n.e.
0.352*
n.e.
Water users
ş0.011
ş0.292**
0.1170.358**
0.410**
0.157
Constant
15.592***
6.473
12.127***
1.167
ş6.041
3.259
F
11.680***
13.420***
26.320***
9.840***
7.300***
6.930***
R 2
0.636
0.696
0.710
0.554
0.454
0.460
Chow testa
2.169***
2.775***
2.391***
Note: See Table 9.4 for detailed description of variables. Coefficients and standard errors are adjusted for stratification, weighting, and clustering of sample.
*, **, and *** mean coefficient is statistically significant at the 10 percent, 5 percent, and 1 percent level, respectively.
Ln means variable is transformed by natural logarithm. n.e. means coefficient was not estimated as the associated variable was dropped to avoid dummy variable trap or because it perfectly
predicted the outcome.
At the time of the survey, US$1 8.50 Ethiopian birr.
aThe Chow test is a test of equality of the coefficients in low- and high-potential areas.
POLICIES AND PROGRAMS IN THE HIGHLANDS OF AMHARA
245
Table 9.7 Least-squares regression results of value of crop yield by agricultural potential in the
highlands of Amhara region, Ethiopia, 1999
Ordinary least squares
Reduced form
Low-potential
High-potential
Low-potential
High-potential
Factor
areas
areas
areas
areas
Exogenous variables
Plot-level factors
Owner-cultivated
ş0.067ş0.318*
ş0.508**
ş0.237
Expectation to operate
0.155
0.468***
0.873***
0.288
Ln Size
ş0.111
ş0.283***
ş0.572***
ş0.424***
Ln Slope
0.014**
0.008
0.018**
0.011
Soil depth (cf. deep)
Medium
ş0.132
0.107ş0.230
0.054
Shallow
ş0.342***
ş0.044
ş0.468***
ş0.202
Soil color (cf. black)
Brown
0.124
0.080
ş0.054
0.137
Gray
ş0.257*
0.309*
ş0.359
0.004
Red
ş0.134
ş0.072
ş0.267*
ş0.084
Presence of gullies
ş0.039
ş0.062
ş0.053
0.213
Waterlogging problem
ş0.051
ş0.492***
ş0.124
ş0.740***
Investments on plot
Irrigation
0.172
0.128
0.789***
0.352
Stone terraces
0.110
0.069
0.351***
0.197
Drainage ditch
ş0.380***
0.134*
0.042
0.232**
Live fence
0.138
0.089
şş0.085
0.303**
Fence
ş0.050
ş0.163
0.149
0.044
Household-level factors
Gender of head
0.529
0.339*
0.771
0.475**
Ln Age of head
ş0.020
ş0.419***
0.276
ş0.634***
Average education
0.0270.000
0.020
0.033
Ln Size of farmland
ş0.279***
ş0.072
ş0.314***
ş0.020
Number of oxen
0.0470.154**
0.146
0.188*
Tropical livestock units
ş0.008
ş0.053*
ş0.008
ş0.026
Village/district-level factors
Land redistribution
0.278***
0.558***
0.184
0.467*
Ln Household density
ş0.281***
ş0.294***
0.031
ş0.037
Ln Altitude
0.128
0.693*
0.198
1.291**
Ln Rainfall
0.323
0.158
ş0.274
0.019
Subregional location
Location (cf. Southern)
Northern
0.521***
0.056
0.443*
ş0.322
Western
0.567*
ş0.152
1.256***
ş0.517
Eastern
0.408***
0.857***
0.635**
1.122**
(continued )
246
SAMUEL BENIN
Table 9.7 (continued)
Ordinary least squares
Reduced form
Low-potential
High-potential
Low-potential
High-potential
Factor
areas
areas
areas
areas
Endogenous variables
Crops (cf. other crops)
Barley only
0.196
0.108
Maize only
0.152
0.254
Wheat only
0.106
0.198
Teff only
0.529
0.465***
Other cereals
0.4170.492***
Cereal and other crops
1.038***
0.632***
Legumes only
1.111***
0.302
Extension (cf. 0 visits)
1ş5 visits
0.153
0.269***
6ş10 visits
0.108
0.305***
More than 10 visits
ş0.186
0.214*
Use of reduced tillage
0.003
ş0.236
Use of contour plowing
ş0.095
ş0.029
Use of crop rotation
0.025
ş0.035
Use of crop residues
ş0.279***
ş0.114
Use of household refuse
ş0.245*
ş0.212*
Use of manure
ş0.101
0.148
Use of chemical fertilizers
ş0.010
0.442***
Use of improved seeds
0.199
0.387***
Ln Amount of labor
0.146***
0.163***
Ln Amount of draft power
0.309***
0.011
Ln Value of seed
0.279***
0.189***
Instruments
Plot level
Homestead plot
ş0.081
ş0.248*
Ln Plot to residence
0.003
ş0.002
Household level
Ln Household size
ş0.156
ş0.079
Proportion male
ş0.191
0.266
Dependency ratio
ş0.132
ş0.668*
Exogenous income
0.000
0.000
Access to markets or services
Ln Drinking water
ş0.033
ş0.087
Ln Grain mill
0.122*
ş0.077
Ln All-weather road
0.020
0.221**
Ln Development agent
0.066
ş0.095
Ln Bus service station
0.054
ş0.192*
Ln Fuelwood
ş0.001
ş0.001
Ln Input supply shop
ş0.151*
0.001
POLICIES AND PROGRAMS IN THE HIGHLANDS OF AMHARA
247
Table 9.7 (continued)
Ordinary least squares
Reduced form
Low-potential
High-potential
Low-potential
High-potential
Factor
areas
areas
areas
areas
Village/district-level factors
Ln Distance to district town
0.042
ş0.045
Access to fertilizers
0.158
n.e.
Access to improved seeds
0.018
ş0.165
Access to purchased feed
ş0.390***
0.135
Access to credit
0.535**
ş0.285
Presence of local association
Input cooperative
ş0.724***
0.581**
Marketing cooperative
ş0.175
n.e.
Women's/youth
n.e.
ş0.303
Church
0.436***
0.708**
Water users
0.303
ş0.254
Constant
3.181
2.226
9.739***
2.157
F
17.580***
12.540***
7.600***
5.040***
R 2
0.661
0.604
0.479
0.474
Hausman testa
4.400
0.010
Chow testb
3.174***
2.093***
Note: Values are Ln (birr/hectare). See Table 9.4 for detailed description of explanatory variables. Coefficients and
standard errors are adjusted for stratification, weighting, and clustering of sample.
*, **, and *** means coefficient is statistically significant at the 10 percent, 5 percent, and 1 percent level, respectively.
Ln means variable is transformed by natural logarithm.
At the time of the survey, US$1 8.50 Ethiopian birr.
aHausman test of endogeneity when the instruments are used to predict the endogenous variables in an instrumental
variables (IV) regression.
bThe Chow test is a test of equality of the coefficients in low- and high-potential areas.
although the reduced-form estimates are occasionally discussed to distinguish in-
direct effects.
Consistent with the finding of Benin and Pender (2001), land redistribution
was directly associated with higher value of crop yield, although the effect was
about twice as large in the high-potential areas, where the incidence of land redis-
tribution was also higher. This result is surprising, however, because land redistrib-
ution, although associated with greater plowing in of crop residues in high-potential
areas, was associated with lower incidence of use of several of the land management
practices as well as use of labor and animal draft power (see Tables 9.5 and 9.6).
Owner-cultivated plots, compared to rented plots, were weakly associated
with lower value of crop yield by 27 percent in high-potential areas.20 This result is
also puzzling because it contradicts the tendency of yields to be lower on rented plots
248
SAMUEL BENIN
(Otsuka and Hayami 1988). It also contradicts results from other parts of Ethiopia
in the Oromiya region (Ahmed et al. 2002; Pender and Fafchamps 2006, forth-
coming) and the Tigray region (Pender, Gebremedhin, and Haile 2002). Pender
and Fafchamps found no difference in yields between owner-cultivated and share-
cropped plots, and Ahmed et al. (2002) and Pender, Gebremedhin, and Haile (2002)
found that crop yields were lower on sharecropped plots than on owner-cultivated
plots. The result is puzzling also because the econometric results do not show many
statistically significant differences in land management practices and inputs between
owner-cultivated and rented plots in high-potential areas, except the case where
likelihood of using manure or improved seeds was lower on owner-cultivated plots,
whereas likelihood of using crop rotation, crop residues, and labor was higher (see
Tables 9.5 and 9.6). Although the result is consistent with some of the findings
of Holden, Shiferaw, and Pender (2001), who found that barley yield was about 51
percent higher on rented plots, the puzzle was addressed by reestimating the value
of crop yield regression in high-potential areas using a household fixed-effects
model and also by restricting the sample to households with both owner-cultivated
and rented plots only.21 In the household fixed-effects model, all variables that do
not vary across plots (within the household) are dropped. The results of these esti-
mations, presented in the appendix, show that the weak negative effect associated
with owner-cultivated plots was not robust, suggesting that the land rental market
may actually be operating efficiently. Note, however, that there is substantial loss of
information (i.e., dropping several variables in the fixed-effects model and observa-
tions in the restricted sample) associated with these models. Thus, although their
estimates compare fairly well with those in Table 9.7, they are not preferred for fur-
ther discussion.
For the same total farm size, larger plots were associated with lower value of
crop yield in high-potential areas only (value of crop yield elasticity with respect to
plot size is ş0.28), which is consistent with the lower use of inputs, especially labor,
animal draft power, and seed. Larger farms also were associated with lower value of
crop yield, but significantly so in low-potential areas only (yield elasticity of ş0.28).
This inverse farm sizeşproductivity relationship is consistent with the findings of
many studies, including Hayes, Roth, and Zepeda (1997) and Holden, Shiferaw,
and Pender (2001). However, these findings should not be misinterpreted to mean
that plots and farm sizes in the region should be reduced in order to increase farm-
land productivity, as farm holdings are already small: they average 1.3 hectares per
household, and more than one-half of the households own less than 1 hectare.
Irrigation contributed to a higher value of crop yield in low-potential areas
only via choice of high-value crops and greater use of some inputs. That is, irriga-
tion by itself had no direct effect on value of crop yield, controlling for crop choice,
POLICIES AND PROGRAMS IN THE HIGHLANDS OF AMHARA
249
input use, and other factors. This finding is consistent with results from the Tigray
region (Chapter 5), where irrigation was also found to have no direct effect on crop
yield, although it contributed significantly to increased use of inputs. Similarly, plots
with stone terraces had no direct effect on value of crop yield. The indirect effect,
however, was significant in low-potential areas (associated with 42 percent more
value of crop yield). This result is consistent with other findings from Tigray region,
which is typical of low moisture and generally of low agricultural potential (Gebre-
medhin, Swinton, and Tilahun 1999; Pender, Gebremedhin, and Haile 2002).
Male-headed households were weakly associated with higher value of crop yield
(about 40 percent more) than their female-headed counterparts in high-potential
areas. Because we control for factors that may be biased against female-headed
households and contribute to lower value of crop yield (e.g., household size, com-
position, and education, access to credit, extension, and inputs), it is not clear why
this is the case. Perhaps, as most women take over the management of the farm
only when their husbands are not in a position to manage the farm, they may be
less experienced in managing the farm than their male counterparts. This result
suggests that poverty and food insecurity may be more problematic in female-
headed households in high-potential areas. Ownership of an additional ox was
associated with greater value of crop yield (about 15 percent) in high-potential
areas, whereas ownership of additional livestock in general was weakly associated
with lower value of crop yield (about 5 percent) among households in the same high-
potential areas.
Extension had a significant positive effect on value of crop yield in high-
potential areas only, and there seems to be an inverted-U-shaped relationship
between value of crop yield and number of extension visits received by the house-
hold. Households that received between one and five visits were associated with 31
percent more value of crop yield than those that received none. However, those
that received between 6 and 10 visits were associated with 36 percent more value of
crop yield, and those that received more than 10 visits were associated with 24 per-
cent more value of crop yield.22 These data suggest that repeated extension visits
are more effective, although the marginal effect declines as other aspects of liveli-
hoods on which extension also focuses become more profitable, so that resources
are shifted into those areas. The reason for extension not having a significant posi-
tive effect in low-potential areas is likely the emphasis on improved seeds and
chemical fertilizers, as number of extension visits was similar in the two areas (see
Table 9.4). Improved seeds and chemical fertilizers are more appropriate in high-
potential areas or where ample and reliable moisture is available. This finding is
consistent with the limited impact of these inputs and extension found in Tigray
in Chapter 5. Value of crop yield was higher by 47 percent and 56 percent on plots
250
SAMUEL BENIN
that used improved seeds or chemical fertilizers, respectively, in high-potential areas.
Plots in low-potential areas on which crop residues were used were associated with
lower value of crop yield, whereas those in both low- and high-potential areas on
which household refuse was used were associated with lower value of crop yield.
These results may seem surprising, but organic materials take longer to break down
and can actually reduce the availability of soil nitrogen to crops if their carbon to
nitrogen content is high (Giller et al. 1997).
The value of crop yield elasticity with respect to labor, animal draft power, and
seed in low-potential areas were 0.15, 0.31, and 0.28, respectively, and 0.16, 0.01,
and 0.19 in high-potential areas, although the elasticity with respect to animal
draft power was not significant in the latter. In low-potential areas, the elasticities
translate into marginal returns of 4.75, 10.05, and 9.08 birr per hectare for 1 per-
cent increase in labor (equal to 4.4 man-days), animal draft power (0.5 animal-
day), and seed (2.5 birr) per hectare, respectively.23 In high-potential areas, the
marginal returns are 4.20 and 4.87 birr for labor and seed, respectively. At the time
of the survey, the average farm wage rate for men was about 4 birr per day, whereas
renting an ox cost 5 birr per day. With these unit values used, and all other factors
controlled at the margin, oxen (except in high-potential areas) and seed returned
significant profits, but farm labor was substantially overpaid.
Population density had a negative influence on the value of crop yield, with
elasticities of ş0.28 and ş0.29 in low- and high-potential areas, respectively. These
contradict the Boserupian (Boserup 1965) optimistic perspective about the responses
of households to population pressure and suggest that, under current conditions,
crop production in high-potential areas will not be able to support its growing popu-
lation, and so the trickle-down effect to low-potential areas cannot be justified.
The effects of access to infrastructure and services on value of crop yield were
mixed, and the estimates are obtainable from the results of the reduced-form regres-
sion model only. For example, households in the high-potential areas and closer to an
all-weather road were associated with lower value of crop yield, whereas those closer
to a bus service station were associated with greater value of crop yield. Presence of
an input cooperative was associated with greater value of crop yield in high-potential
areas but lower value in low-potential areas, but access to credit had a positive effect
in low-potential areas only.
Conclusions and Implications
This chapter has presented a large amount of primary empirical evidence based
on sound scientific methodology on the factors (biophysical, socioeconomic, policy,
and program) that influence adoption of various land management practices and
POLICIES AND PROGRAMS IN THE HIGHLANDS OF AMHARA
251
modern inputs (including reduced tillage, contour plowing, crop rotation, crop
residues, household refuse, manure, improved seeds, and chemical fertilizers),
amounts of inputs used (labor, draft animal power, and seed), and value of crop
yield on farm plots in the highlands of Amhara region. Survey data from a total
of 434 households and 1,434 plots were used in the analyses. The evidence was
presented separately by agricultural production potential (low and high). In the
discussion of the evidence, however, the chapter focused on the influences of land
redistribution and tenure, plot and farm size, household endowments (gender,
education, and ox and livestock ownership), population density, and access to
infrastructure and services (access to roads, markets, and credit). The effects of irri-
gation, stone terraces, extension, land management practices, and use of conven-
tional inputs (labor, draft animals, and seeds) and modern inputs (improved seeds
and chemical fertilizers) on value of crop yield were also discussed.
Econometric results show that value of crop yield was significantly higher on
household plots in villages affected by land redistribution since 1991, suggesting
that land redistribution may have served well in the past to equalize farmland hold-
ing across households, especially in improving access to farmland of landless house-
holds. In conjunction with the finding that larger plots and farms were associated
with lower value of crop yields, the result may seem to suggest that reallocation of
resources among households is desirable, especially if the market transactions are
artificially suppressed. However, such gains in the past should not be a guide for
the future. The current farming situation is desperate: average farmland holding
per household is only 1.3 hectares, and more than half of the households own less
than 1 hectare. In addition, current conditions and farm technology barely support
an average production of 1 ton per hectare. Thus, it is difficult to envisage how
households can effectively meet their food needs with further smaller plots and
farms. Other viable alternatives should be considered. For example, larger farms
also tend to be more fragmented, requiring more resources per unit of area to man-
age them efficiently. Therefore, consolidation of farms may be a more desirable
approach to improve land productivity.
The results also show that improving tenure security of farmers would be very
beneficial, as we find that plots on which households felt more secure (i.e., expect-
ing to operate for the next five years) were associated with greater value of crop
yield, especially in high-potential areas (about 60 percent more). A major source
of tenure insecurity is fear of loss of land during redistribution, which can have a
negative effect on the land rental market, as land-abundant households may not be
willing to rent out land. This is because renting out land is believed to increase
tenure insecurity by increasing the likelihood of that plot being redistributed, as
renting out signals inability to farm (Holden and Yohanner 2002). Fortunately, the
252
SAMUEL BENIN
Amhara regional government stopped land redistribution in 2000. This would
help to increase tenure security, which in turn would help to increase and sustain
higher yields and also strengthen the efficiency of the current land rental market.
Several of the other policy and program variables considered, including irriga-
tion, extension, and use of modern inputs, had differential significant effects on
value of crop yield in low- and high-agricultural-potential areas. The results show
that extension and use of improved seeds and chemical fertilizers had significant
positive effects on value of crop yield in the high-potential areas only. Irrigation, on
the other hand, had substantial total effect in low-potential areas only. These results
suggest that different strategies are needed for the different environments. For
example, in the low-potential areas, the extension strategy should focus more on
promoting soil and water conservation structures such as stone terraces, which
were associated with 42 percent more value of crop yield in those areas. Relying on
external inputs (chemicals fertilizers and improved seeds) in low-potential areas,
which has been the strategy in the past, is not likely to be beneficial unless moisture
availability issues are addressed.
In the high-potential areas, improving input delivery and extension services
would be very beneficial. In addition, adopting policies and programs that improve
farm management abilities of women and promoting more education for children
(especially girls) would have long-run beneficial effects, as the results show that
female-headed households and households with more dependents were associated
with lower value of crop yields, especially in high-potential areas.
Though the effects of access to infrastructure and services were mixed, pro-
moting more nonfarm income-earning activities, especially in areas close to towns
and roads, where the opportunity costs of farm labor and of other agricultural fac-
tor inputs are higher or where more exit options out of agriculture exist, would also
be helpful. In addition, adopting policies and programs that reduce population
pressure would be beneficial, as the results show that more densely populated vil-
lages were associated with lower farming intensity in several instances and lower
value of crop yield in both low- and high-potential areas. Else, the notion of the
trickle-down effect from high- to low-agricultural-potential areas will remain just
that because crop production in high-potential areas will not be able to support its
own growing population.
POLICIES AND PROGRAMS IN THE HIGHLANDS OF AMHARA
253
Appendix: Least-Squares Regression Results to Examine the
Robustness of the Negative Impact of Land Tenure (Owner-
Cultivated Plots) on Value of Crop Yield (Ln [birr/ha]) in 1999
in the High-Agricultural-Potential Areas of the Highlands of
Amhara Region
High-potential areas
(ordinary least squares)
Household fixed-effects
Households operating owner-cultivated
model, full samplea
and rented plots onlyb
Exogenous variables
Plot-level factors
Owner-cultivated
ş0.023
ş0.184
Expectation to operate
0.152
0.326
Ln size
ş0.129**
ş0.280***
Ln slope
ş0.002
0.028*
Soil depth (cf. deep)
Medium
0.048
0.106
Shallow
ş0.039
0.255*
Soil color (cf. black)
Brown
0.124
0.226
Gray
0.016
0.250
Red
ş0.008
ş0.068
Presence of gullies
ş0.055
0.365*
Waterlogging problem
ş0.246**
ş0.183
Investments on plot
Irrigation
0.051
ş0.110
Stone terraces
0.146
0.199
Drainage ditch
0.038
ş0.221*
Live fence
0.104
0.165
Fence
ş0.039
0.084
Household-level factors
Gender of head
Ln age of head
ş1.155***
Average education
0.054***
Ln size of farmland
ş0.339***
Number of oxen
0.198
Tropical livestock units
ş0.018
Village/district-level factors
Land redistribution
0.351
Ln household density
ş0.303***
Ln altitude
ş1.778***
Ln rainfall
0.369
Subregional location
Location (cf. Southern)
Northern
0.399
Western
0.563
Eastern
0.750
(continued )
254
SAMUEL BENIN
Appendix (continued)
High-potential areas
(ordinary least squares)
Household fixed-effects
Households operating owner-cultivated
model, full samplea
and rented plots onlyb
Endogenous variables
Crops (cf. other crops)
Barley only
0.168
0.115
Maize only
0.122
0.042
Wheat only
0.244
0.565***
Teff only
0.385***
0.458**
Other cereals
0.431***
0.356**
Cereal and other crops
0.702***
0.851***
Legumes only
0.658***
0.501*
Extension (cf. 0 visits)
1ş5 visits
0.338*
6ş10 visits
0.311*
More than 10 visits
ş0.077
Use of reduced tillage
ş0.066
ş0.476***
Use of contour plowing
ş0.103
ş0.534***
Use of crop rotation
0.083
0.119
Use of crop residues
ş0.123
ş0.239*
Use of household refuse
ş0.186*
ş0.649***
Use of manure
0.019
0.230
Use of chemical fertilizers
0.230***
0.242
Use of improved seeds
0.198*
0.427***
Ln amount of labor
0.219***
0.239***
Ln amount of draft power
0.132***
ş0.030
Ln value of seed
0.215***
0.113*
Constant
4.963***
24.348***
F
10.770***
37.390***
R2
0.511
0.826
Fixed-effect testc
2.740***
Note: See Table 9.4 for detailed description of explanatory variables. Coefficients and standard errors are adjusted for
stratification, weighting, and clustering of sample. At the time of the survey, US$1 8.50 birr.
*, **, and *** mean that coefficient is statistically significant at the 10, 5, and 1 percent level, respectively.
Ln means variable is transformed by natural logarithm.
n.e. means coefficient was not estimated because the associated variable was dropped to avoid dummy variable trap
or because it perfectly predicted the outcome.
a In the household fixed-effects regression model, all variables that do not vary within households are dropped and a
dummy variable for each household is included.
b Only households that operate both owned and rented plots are included here. Number of observations is 163.
c Test that the coefficients on the dummy variables for each household are jointly zero.
POLICIES AND PROGRAMS IN THE HIGHLANDS OF AMHARA
255
Notes
1. Subscripts v, h, p, and t refer to village, household, plot, and time, respectively.
2. Following the same line of argument, restrictions on land sales, as exist in Ethiopia, need
not be a source of inefficiency.
3. The peasant administration is the lowest unit of government.
4. The classification of drought-prone versus non-drought-prone districts used by the Ethio-
pian Disaster Prevention and Preparedness Commission was adapted for defining agricultural
potential, referring to drought-prone districts as low-agricultural-potential districts (located in the
eastern part of the region) and non-drought-prone districts as high-agricultural-potential districts
(located mainly in the west and southern tip of the region).
5. Districts that have more than 50 percent of their total area below 1,500 meters above sea
level were excluded from the sample frame.
6. Observations with missing data, mostly uncultivated plots, were dropped, leaving 1,187
observations for analysis.
7. Land redistribution was recently phased out in the region. However, there were significant
differences across regions with respect to its implementation leading up to the time of data collec-
tion. For example, in the Tigray region, land redistribution was stopped in 1991, and the policy of
no future redistribution was made official by a land use and tenure policy in 1997. In the Oromiya
region too, there has not been a land redistribution since 1992, and the regional government is cur-
rently developing its land use policy.
8. At the time of the survey, US$1 8.50 birr.
9. On rented plots, bequeath refers to the expectation of transferring the rental contract to
an heir in the event that the current contract holder is unable to continue farming.
10. Because of the different crops produced on a plot, total output was aggregated using one
set of unit prices of crops for all households.
11. Monthly rainfall data for 1999 were obtained from the Meteorological Services Agency
for weather stations located in the districts where the surveys were carried out, and elevation data
were obtained from the geo-referenced Country Almanac Ethiopia Database.
12. Wag Hamra and Oromia zones were excluded from the sample frame because they were
predominantly lowland (see note 5).
13. The selection of land management practices for the econometric analysis was based on
those practices occurring on 10 percent or more of all plots.
14. The regression results of these are available on request.
15. One tropical livestock unit (TLU) is equivalent to one cow weighing 250 kg. Conversion
factors for other types of animals, based on weights, have been estimated by ILRI.
16. The Hausman test is given by the chi-square value, 2 = ( ş
)(Var
ş Var
)ş1
IV
OLS
IV
OLS
( ş
), where and Var are the estimated coefficient and variance, respectively. Detailed test
IV
OLS
results are reported in the relevant tables of results.
17. Note that only continuous explanatory variables without zero values were transformed by
natural logarithm.
18. Detailed results of log-likelihood ratio tests for the probit models and Chow tests for the
linear models are shown in the relevant tables of results.
19. With the large number of explanatory variables, there is the potential for a multi-
collinearity problem. This was tested using variance inflation factors, which were in the acceptable
range of less than 10 (Kennedy 1985).
256
SAMUEL BENIN
20. The predicted impact of these and other discrete variables on value of crop yield can be
calculated by taking the exponential of the relevant coefficient in Table 9.7 because the dependent
variable is the logarithm of total output per hectare.
21. Thanks to Kei Otsuka for suggesting these methods for addressing the puzzle.
22. Discrete variables (rather than a continuous one) for extension visits were used in the
regression analysis because of two problems. First, there were many zero values, and the logarithm
of zero is not defined. Second, there was insufficient variation in the nonzero values for reliable
continuous-variable estimation. The same applies to other inputs such as manure, chemical fertilizers,
and improved seeds.
23. The predicted returns in birr to a 1 percent increase in input can be calculated by multi-
plying the elasticity with respect to that input in Table 9.7 by 3,252.91 or 2,576.46 birr, which are
the average values of output per hectare in low- and high-potential areas, respectively (see Table 9.4).
C h a p t e r 1 0
Community Natural Resource
Management in the Highlands of Ethiopia
Berhanu Gebremedhin, John Pender, and Girmay Tesfay
Common property resources1are important sources of timber, fuelwood,
and grazing land in developing countries. When community members have
unrestricted access to the resource, or when use regulations are ineffective,
these resources are exploited on a first-come, first-served basis. Each individual user
of the resource will tend to continue to use the resource until her average revenue
is equal to the marginal cost of using the resource (Gordon 1954). In the presence
of externalities, social marginal cost exceeds private marginal cost, and common
property resources can still be degraded if an individual equates her marginal cost
with her marginal benefit of utilizing the resource. These conditions lead to over-
exploitation of the resource and the dissipation of the scarcity rent.
Several alternative solutions have been proposed to solve this problem, includ-
ing collective action,2 privatization, and imposition and enforcement of use rules
by external forces such as the government (Wade 1987). The transaction cost of
enforcing use rules imposed on communities by an external force is likely to be
prohibitively high because of the high incentives of individual users to shirk or of
the community members to collude against the use rules. Privatization is not always
superior to community resource management because poverty, dependence on the
natural resources, and natural and environmental risks may make common prop-
erty a more rational solution to problems of resource management (Runge 1992).
McCarthy, Kamara, and Kirk (2001) argue that private property of communal
rangelands will become optimal only when collective action is so poor that it
becomes welfare-improving to appropriate land individually.
258
BERHANU GEBREMEDHIN, JOHN PENDER, AND GIRMAY TESFAY
Collective action for natural resource management can also mitigate the nega-
tive influence of population pressure on natural resource management as predicted
by the Malthusian perspective. In the presence of collective action, institutional and
organizational development, and the development of infrastructure, population
pressure is more likely to have a positive effect on natural resources than in the
absence of these developments (Pender 2001). Moreover, the success of public
policies to improve natural resource management depends to a large extent on the
presence and effectiveness of local-level institutions and organizations to enforce
them (Rasmussen and Meinzen-Dick 1995).
Hence, the solution to the problem of resource degradation in developing
countries depends not only on appropriate technologies and efficient market prices
but also on local-level institutions of resource management and the organizations
to enforce them (Rasmussen and Meinzen-Dick 1995; Baland and Platteau 1996).
Community resource management institutions and organizations are now receiv-
ing greater attention as a viable alternative to regulation by the state or privatization
as a means of rectifying inefficiencies caused by attenuated property right systems,
externalities, and other market failures.
However, devolving rights to local communities to help build institutions for
common property management may not be a sufficient condition for sustainable
use of such resources. Effectiveness in internal governance is needed for the effec-
tive application of community rules (Turner, Pearce, and Bateman 1994; Swallow
and Bromley 1995). Hence, the need to identify factors that facilitate or hinder the
development and effectiveness of local level institutions and organisations for nat-
ural resource management becomes important for developing policies to strengthen
community resource management.
In Ethiopia, rural communities depend primarily on common property re-
sources for irrigation water, construction material, fuelwood, and grazing land.
Population pressure, market and government failures, and the absence or ineffec-
tiveness of use regulations of common property resources have resulted in severe
degradation of the resources (Stahl 1990; Gebremedhin 1998). Perhaps as a result,
Ethiopia has been identified as the country with the most environmental problems
in the Sahel belt (Hurni 1985).
After the 1974 revolution, increasing shortage of biomass for fuelwood and
construction purposes resulted in emphasis given to rural afforestation and refor-
estation. Guided by Marxist ideology, the military government then favored state
and social forestry, and individual tree planting efforts were undermined (Bruce,
Hoben, and Rahmato 1994). Since 1991, the policies of the national and regional
governments emphasized natural resource conservation as a key component of the
agricultural development strategy. Unlike during the military government, decen-
tralization of resource management has been encouraged. For example, in Tigray
COMMUNITY MANAGEMENT IN THE HIGHLANDS OF ETHIOPIA
259
region, woodlot management has been devolved from community (tabia, which
usually consists of four or five villages) level to village level to subvillage level and to
individual farmers (Jagger, Pender, and Gebremedhin 2003). However, most of the
woodlots in the region still remain under community management.
As part of the conservation-based agricultural development strategy pursued
in the northern Ethiopian highlands of Tigray that is aimed at rehabilitating the
degraded environment, several natural resource conservation and development
efforts have been under way in the region, especially since 1991. These efforts
include construction of soil and water conservation structures, area enclosures
(areas closed from human and animal interference to allow natural regeneration
with enrichment plantations), community woodlot development, community graz-
ing land management, and the development of small-scale irrigation.
However, there is a scarcity of evidence regarding the factors that facilitate or
hinder community resource management in the region. Empirical evidence on the
determinants of collective action for natural resource management can provide
useful guidance to policy makers in the region in their effort to enhance the effec-
tiveness of community resource management efforts. The empirical results will also
contribute to the growing literature and debate on collective action for natural
resource management in developing countries.
This chapter provides evidence on the determinants of collective action for
community woodlot and communal grazing land management in the highlands of
Tigray. The chapter uses multivariate econometric methods to analyze the determi-
nants of collective action and its effectiveness in managing woodlots and grazing
lands.
Data
This study is based on a survey of 50 tabias (the lowest administrative unit in
Tigray, comprising usually four or five villages) and 100 villages in the highlands3
of Tigray in the 1998ş99 cropping season, as part of the IFPRI/ILRI/Mekelle Uni-
versity research project on Policies for Sustainable Land Management in the High-
lands of Tigray. Sample tabias were selected based on random sampling stratified
by proximity to a market town and presence of an irrigation project. Within each
tabia, two villages were selected randomly. A semistructured questionnaire was
administered with representative individuals at both levels. Each interview involved
10 respondents chosen to represent different age groups (below 30 years of age, and
older), villages (representation of each sample village), primary occupations (farm-
ing or off farm), and gender. The survey collected information about changes in
agricultural and natural resource conditions between 1991 and 1998 and their causes
and effects.
260
BERHANU GEBREMEDHIN, JOHN PENDER, AND GIRMAY TESFAY
Community woodlots and grazing lands with use regulations are common in
the highlands of Tigray. Almost 9 out of 10 tabias in the highlands of Tigray have
woodlots (Table 10.1), and 90 percent of villages have restricted grazing areas4
(Table 10.2). There are nine woodlots per tabia on average, and these average about
8 hectares in size; the average area of restricted grazing land per village was 38 hect-
ares. Most of the woodlots were established since the fall of the military govern-
ment in 1991. However, more than 58 percent of the restricted grazing areas were
established before 1966, and only 17 percent were established after 1991. The estab-
lishment of most woodlots (95.5 percent) has been promoted by external organiza-
tions, usually the Tigray Regional Bureau of Agriculture and Natural Resources
(TBoANR), while only 32 percent of the restricted grazing areas were promoted by
external organizations and programs.
Whereas all restricted grazing lands were managed at the village level, wood-
lots were managed at both the village and tabia levels. Tabia-managed woodlots
Table 10.1 Characteristics of community woodlots: Means
Item
Village-managed
Tabia-managed
All woodlots
Percentage of tabias with a woodlot
57.7
29.9
87.6
(8.1)
(7.2)
(5.8)
Number of woodlots per tabia
7.2
0.9
9.0
(1.3)
(0.2)
(1.3)
Area of woodlots (hectares)
5.1
18.5
7.9
(0.9)
(3.8)
(1.4)
Percentage of woodlots established since 1991
75.6
91.3
78.0
(8.8)
(5.2)
(7.6)
Percentage of woodlots
Promoted by a program or organization
94.6
98.7
95.5
(3.8)
(1.4)
(3.0)
Promoted by BoANRD
76.5
91.4
79.5
(8.7)
(7.4)
(7.2)
Promoted by REST
4.6
0.0
3.7
(3.7)
(0.0)
(3.0)
Promoted by BoANRD and REST
4.8
7.3
5.3
(4.6)
(7.2)
(3.9)
Promoted by World Vision
4.8
0.0
3.8
(4.6)
(0.0)
(3.7)
Percentage of woodlots where users are:
All tabia members
0.0
94.8
19.6
(0.0)
(5.3)
(6.4)
Only village members
100.0
0.0
79.1
(0.0)
(0.0)
(6.4)
Only the guard
0.0
5.2
1.1
(0.0)
(5.3)
(1.1)
Note: Standard errors in parentheses. Means and standard errors are corrected for sampling stratification and weights.
COMMUNITY MANAGEMENT IN THE HIGHLANDS OF ETHIOPIA
261
Table 10.2 Characteristics and allowed uses of restricted grazing areas
Item
Village level
Grazing area level
Percentage of villages with restricted grazing lands
89 (0.0096)
Number of restricted grazing lands per village
3.98 (0.16)
Average area of restricted grazing lands (hectares)
38.2 (3.61)
10.45 (1.11)
Average age of restricted grazing land
23 (0.8)
Percentage of grazing lands promoted by external organizations
32 (3.5)
Value of community contribution for grazing land management (birr)
Value per grazing land
1,580 (615)
Value per hectare
300 (60)
Value per household
3.66 (0.85)
Allowed uses of restricted grazing lands (percent)
Cutting grass
22 (3.0)
Fuelwood collection
53 (3.4)
Collecting dung
90 (2.1)
Collecting fruits
66 (3.3)
Beekeeping
60 (3.2)
Cutting trees
0 (0.0)
Note: Standard errors in parentheses. Means and standard errors are corrected for sampling stratification and weights.
tend to be larger than village-managed woodlots, averaging more than 18 hectares
in size compared to about 5 hectares for village woodlots (Table 10.1). The most
common use allowed on woodlots is to cut and collect grass for animal feed, roof
materials, or other purposes. Collecting fruits and beekeeping in woodlots are also
commonly allowed. These uses are more common on village-managed than tabia-
managed woodlots. In restricted grazing areas, in addition to grazing animals, fuel-
wood and dung collection and beekeeping are commonly allowed uses. Cutting
and collecting grass was also practiced in 22 percent of the restricted grazing areas.
Cutting trees, shrubs, branches, or roots and collecting fuelwood, barks, leaves, or
dung are not allowed in woodlots. In a few cases animals are allowed to graze in the
woodlot, but only during a drought.
Almost all woodlots and most grazing areas are protected by a guard paid in
cash or in kind. In some cases, the guard is compensated by being allowed to col-
lect grass from the woodlot or grazing area. It is more common for the local com-
munity to hire the guard for village-managed than for tabia-managed woodlots.
In 77 percent of the restricted grazing lands, village residents contributed cash or in
kind for guard payment.
The most common violations of restrictions of woodlots and grazing lands
reported in 1998 were cutting grass and grazing animals when not allowed. Cutting
of trees or branches were also frequently reported violations on woodlots. Violations
are more common on tabia-managed than village-managed woodlots.
262
BERHANU GEBREMEDHIN, JOHN PENDER, AND GIRMAY TESFAY
Given the limited allowed uses of the woodlots, the benefits received are, not
surprisingly, small. Of 164 village-managed woodlots in our sample, benefits were
reported being received in 1998 from only 57 woodlots, mainly from cutting grass.
Fewer than half of the households in the villages benefited from grass cutting on
average, and the average estimated value of benefit was 2,783 EB per woodlot in
1998, only about 2 EB per capita in the villages where benefits were received. The
benefits from tabia-managed woodlots are even lower, averaging only 352 EB per
woodlot, less than 0.10 EB per capita. In the case of restricted grazing areas, 42 per-
cent of households were reported to have benefited from grazing animals in 1998.
Other benefits of grazing lands to rural households include cutting grass for feed
and other purposes, collecting dung, and collecting fuelwood from dead trees.
Villages are pursuing a more intensive strategy of woodlot management than
tabias. Labor for tree planting, constructing soil and water conservation structures,
weeding, and harrowing are the main collective input, averaging 0.18 person-days
per capita for village-managed woodlots and 0.13 person-days per capita for tabia-
managed woodlots. Village woodlots are also planted much more densely than
tabia woodlots. The average survival rate is somewhat higher for tabia woodlots,
but in view of the differences in planting densities, the number of surviving trees
per hectare is still much higher on village woodlots. Considering the average
returns per capita reported above, the average return per person-day invested in
1998 was about 10 EB for village-managed woodlots (comparable to the daily
wage rate in rural Tigray) but less than 1 EB for tabia-managed woodlots.
The main benefit of a woodlot is not likely the value of grass collected but
rather the value of the trees in the woodlot, a nonliquidated capital gain. The most
commonly planted trees in community woodlots are eucalyptus trees (especially
globulus and camaldulensis). The average price of eucalyptus poles in the high-
lands of Tigray was about 28 EB per pole in 1998 (Jagger and Pender 2003). On
the basis of the average planting density (about 4,500 trees per hectare) and survival
rate (64 percent), a woodlot of average-sized eucalyptus trees would be worth more
than 80,000 EB per hectare on average, and much more in places where wood
is very scarce. With an average of more than 70 hectares of woodlots per tabia
(nine woodlots averaging almost 8 hectares each), this represents a substantial con-
tribution to the wealth of communities in Tigray (averaging more than 5 million EB
per community). Thus, despite the limited amount of current benefits that people
are receiving from community woodlots in Tigray, community members are gener-
ally satisfied that they will benefit from them eventually. Only a small fraction of
communities report uncertainty about future benefits as a problem, although the
problem is more commonly reported for tabia-managed than village-managed wood-
lots. In almost all cases, community members reported that the condition of the
area where the woodlot or the restricted grazing lands were established had im-
COMMUNITY MANAGEMENT IN THE HIGHLANDS OF ETHIOPIA
263
proved substantially as a result of the protection and investment in developing the
resources. Only a few communities reported a problem of increasing pressure on
other lands as a result of the protection of woodlots or grazing lands.
Empirical Approach
When community resource users are able to negotiate among themselves to set
rules of access, when cost of monitoring compliance or violations is not very high,
and when noncooperation would lead to nonprovision, rational individuals will
tend to voluntarily comply with rules of restrained access, thus paving the way to
the development of collection action. Analysis of individual incentives to con-
tribute to collective action for common property resource management has been
the most dominant economic approach to the study of the determinants and effec-
tiveness of collective action (Baland and Platteau 1999; Agrawal 2001; Varughese
and Ostrom 2001). Underlying these incentives is the perceived distribution of ben-
efits and costs, which may in turn be influenced by factors related to the nature of
the resource, the characteristics of the community, the interrelationships between
the community and the resource, the external environment such as the role of
external programs and organizations, and access to markets (Agrawal 2001).
Hence, in this study, factors related to the number and characteristics of com-
munity members (by facilitating or hindering trust and cooperation), the external
environment (through the effect of the involvement of external organizations and
programs or access to markets on costs and benefits of collective action), impor-
tance of the resource for livelihood, and community experience in establishing and
managing local organizations are considered important determinants of collective
action and its effectiveness for woodlot and grazing land management.5
The indicators of collective action and effectiveness in managing woodlots used
in the econometric analysis include the amount of uncompensated collective labor
per hectare invested, whether the community pays for a guard to protect the wood-
lot, whether there were any violations of the restrictions on use of the woodlot, the
number of trees planted per hectare on the woodlot since its establishment, and
the survival rate of the trees planted. In the case of grazing lands, we used area of
restricted6 grazing land per household in the village, whether communities pay
for a guard to protect the grazing land, the monetary value of contribution per
household for grazing land management, whether communities established penalty
systems for violations of use restrictions, and whether violations of use rules and
regulations occurred in 1998, as indicators of collective action.
Community members may respond to noncooperation by cooperating to
increase each other's incentive to cooperate or through exhortation and penalties.
Thus, establishment of a penalty system is used as an indicator of collective action.
264
BERHANU GEBREMEDHIN, JOHN PENDER, AND GIRMAY TESFAY
Violations of use restrictions and regulations are used as an indicator of failure of
collective action.
The type of regression model used depends on the nature of the dependent
variable. We use a Tobit model to explain collective labor investment and survival
rate in the case of woodlots, and area of restricted grazing land per household and
monetary household contribution per hectare in the case of grazing lands, because
these variables are censored. We use binary probit models to explain whether the
community pays for a guard, whether there were violations of restrictions in wood-
lots or grazing lands, and whether the community established a penalty system in
the case of grazing lands, because these are binary variables. We use least-squares
regressions for tree planting density because this variable is continuous.
The factors used to explain variations in collective action and its effectiveness
in managing woodlots include population density, access to market, involvement
of external organizations or programs in the establishment of woodlot, whether the
woodlot is managed at the village or tabia level, and the area of the woodlot. The
factors used to explain differences in collective action in managing grazing lands
include the number of total households in a village,7 heterogeneity in ox ownership
by the community, community experience in running local organizations, distance
to market, involvement of external organizations or programs in establishing the
restricted grazing land, whether cattle production is the second most important
source of livelihood in a community, and the total area of the community.
At low levels of population, the demand for collective action to manage com-
munity resources may be low, and the organizational costs of attaining it high,
because of fixed costs. As population grows, increasing resource scarcity will increase
the benefits of improved resource management, whether through collective action
or development of private property. This may induce increased collective action, par-
ticularly if economies of scale or high exclusion costs favor collective over private
management. However, as population grows to very high levels, the gains from col-
lective action may be outweighed by the incentive problems associated with it, as
rising scarcity increases the benefits from attempting to "free-ride" on the efforts
of others or lowers the per capita benefits of cooperating. Thus, there may be an
"inverse-U relation" between collective action and population, with higher levels and
effectiveness of collective action at intermediate population than at very low or very
high population (Pender and Scherr 2002).
The effect of market access on collective action for community resource man-
agement is ambiguous. On one hand, having better access to markets increases the
value of resources and thus the value of managing resources well, which may favor
collective action. On the other hand, better market access may tend to undermine
individuals' incentives to cooperate by increasing the opportunity cost of labor or
by offering more "exit" options, making it more difficult to punish those who fail
COMMUNITY MANAGEMENT IN THE HIGHLANDS OF ETHIOPIA
265
to cooperate (Bardham 1993; Baland and Platteau 1996; Pender and Scherr 2002).
The presence of external organizations or programs may favor collective action for
community resource management when those organizations are seeking to pro-
vide complementary inputs to local collective inputs but may undermine collective
action if external organizations are providing substitutes for collective action or
otherwise undermining collective action (Pender and Scherr 2002).
We expect that collective action will be more prevalent and more effective for
village-managed woodlots than for tabia-managed woodlots because villages are
smaller, more cohesive, and a more stable unit than tabias (e.g., the tabias were
reorganized in 1995 to include more villages). We were not able to test for the
effect of level of management on collective action for grazing land management
because all restricted grazing lands were managed at the village level. To the extent
that economies of scale are important in favoring collective action (for example,
in protecting the woodlot), we expect that collective action should be greater and
more effective on larger woodlots.
The effect of heterogeneity on collective action is unresolved because commu-
nities may be heterogeneous in several aspects including sociocultural background,
interests, and endowments, and each of these aspects may affect collective action
differently (Baland and Platteau 1996; Baland and Platteau 1999). The conditions
under which certain aspects of heterogeneity enhance or undermine collective
action also remains unknown (Varughese and Ostrom 2001). In this study, we
considered heterogeneity in terms of ox ownership in the community. We hypoth-
esize that heterogeneity in ox ownership may undermine collective action for graz-
ing land management because of possible divergence of interests in and perceived
benefits from use of the grazing lands. We measured heterogeneity by the coeffi-
cient of variation of the distribution of the proportion of households with no oxen,
one ox, two oxen, and more than two oxen.
Experience with local organizations should favor collective action because of
possible learning effects, and the effect of social capital on the costs or community
ability to enforce collective action (Rasmussen and Meinzen-Dick 1995; Baland
and Platteau 1996; Pender and Scherr 2002). Up to ten different local organiza-
tions operate in the study area. Not all communities have all the local organizations.
We measured differences in community experience with local organizations by the
number of local organizations operating in a given community and expect that
higher experience with local organizations will favor collective action for grazing
land management.
Communities that depend on a common property resource for livelihood and
are likely to use the resource over a long time horizon may be more likely to self-
organize to manage the resource collectively (Varughese and Ostrom 2001). The
primary source of livelihood for rural communities in the study area is cereal crops
266
BERHANU GEBREMEDHIN, JOHN PENDER, AND GIRMAY TESFAY
production. Communities showed differences in their second most important source
of livelihood. We include a dummy variable representing whether the second most
important livelihood source in a given community is cattle rearing. We expect that
where cattle rearing is an important livelihood strategy, collective action for grazing
land management will be more likely.
We include dummy variables for the different zones of Tigray to proxy for dif-
ferences in agroclimatic potential, as well as other differences between these zones
(e.g., differences in enforcement of restrictions on woodlots by zonal and woreda
authorities), for both woodlots and grazing lands. The Southern and Western zones
generally have higher potential as a result of better soils, higher rainfall, and irriga-
tion. We include population density and population density squared for woodlots,
and population and population squared for grazing lands to test for an inverted-U-
shaped relationship between population density and collective action. Market access
is represented by distance to the woreda (district) town, which is usually where
farmers market their produce and purchase inputs. The effect of external organiza-
tional presence is investigated by including a dummy variable indicating whether
the woodlot or restricted grazing land was promoted by an external organization.
Another dummy variable reflects whether the woodlot is village-managed or tabia-
managed. Finally, the size of the woodlot is included to investigate whether there
are economies (or diseconomies) of scale in woodlot protection and management.
In the case of grazing lands, we include area of village to test if collective action in
grazing land management is higher in villages that have wider total area.
Results
Woodlots
The econometric results for the determinants of collective action for woodlot man-
agement are presented in Table 10.3. We find that the intensity of management of
woodlots (labor input, community contribution to protection, and planting den-
sity) is lowest in the Central zone of Tigray, but survival rate is the highest in this
zone (controlling for other differences between zones). This suggests that a less
intensive approach to woodlots is being pursued in the Central zone but that this
can be consistent with higher survival rates (though lower density of surviving
trees), probably because of less competition among trees in the less densely planted
woodlots for water, sunlight, and nutrients. Community labor input is also lower
in the Eastern zone than in the Southern zone, but community contributions to
protecting woodlots are greater, leading to fewer violations of restrictions and
higher survival rates. Thus, the approach to community woodlots in the Eastern
Table 10.3 Determinants of collective action and its effectiveness on community woodlots, 1998
Collective labor
Whether
Whether any
Number of
input (person-
community pays
violations of
trees planted
Survival rate of
Explanatory variable
days/hectare)
for guard
restrictions occurred
per hectare
planted trees (%)
Central zone (cf. Southern zone)
ş1,541.292**
ş1.258*
ş0.437
ş11,374**
18.03*
Eastern zone (cf. Southern zone)
ş928.882**
1.060*
ş1.509***
2,288
17.50*
Western zone (cf. Southern zone)
ş1,442.685
0.363
ş1.029
6,853
5.24
1994 population density (persons/km2)
36.545**
0.0110
ş0.0122
ş249.3**
0.0085
1994 population density squared
ş0.1023**
ş0.0000601
0.0000387
0.693**
ş0.000255
Distance to woreda town (kilometers)
16.0929**
ş0.00462
ş0.00623
241.5**
0.350***
Woodlot promoted by external organization
1,148.053
ş1.286***
0.0870
5,505
ş5.573***
Woodlot managed by village (cf. managed by tabia)
ş615.094
0.668
ş0.158
5,114
7.712
Area of woodlot (hectares)
ş28.1209
ş0.0122
0.00500
ş278.3
0.426
Intercept
ş3,639.085**
0.842
0.900
12,067
38.95**
Type of regression
Tobit
Probit
Probit
Least-squares
Tobit
R 2/pseudo-R 2
0.231a
0.273b
0.136b
0.525
0.436a
Number of positive observations/total observations
66/223
110/219
53/219
76/76
73/76c
Note: All regression results are corrected for sampling stratification and sampling weights, and standard errors are robust to heteroskedasticity and nonindependence within the primary sampling
units (tabias).
***, **, * indicate significance levels at 1 percent, 5 percent, and 10 percent, respectively.
aR2 for least-squares regression on the same data.
bPseudo-R2 values.
cPlanting density and survival data were not collected for all woodlots in the sample.
268
BERHANU GEBREMEDHIN, JOHN PENDER, AND GIRMAY TESFAY
zone appears to be oriented toward less labor intensity of management but greater
effort to protect the trees, with a favorable effect on tree survival. We find no statis-
tically significant differences in tree management, protection, or survival between
the Western and Southern zones.
We find that the labor intensity of woodlot management is positively asso-
ciated with population density but negatively associated with population density
squared, consistent with the hypothesis of an inverse U-shaped relationship
between population density and collective action. The turning point in this rela-
tionship (where maximum predicted collective labor input occurs) is at 179 per-
sons per square kilometer, well within the range of population density observed in
Tigray (the range in our sample is from 39 to 302 persons per square kilometer).8
The magnitude of the effect is also substantial: an increase of population density
from 40 to 50 persons per square kilometer would increase predicted labor input
per hectare by 273 labor days (much more than the average labor input per hectare
on woodlots, which is 164 labor days per hectare).
Other indicators of collective action and its effectiveness, including whether
the community pays for a guard, violations of restrictions, and survival rate of trees,
also show a relationship consistent with the inverted-U hypothesis (with the signs
of the coefficients reversed for violations of restrictions), though these relationships
are statistically insignificant. Unexpectedly, there is a statistically significant U-
shaped relationship between planting density and population density, with plant-
ing density first falling and later rising as population density increases (the turning
point is at 180 persons per square kilometer). It may be that lower planting density
at moderate population density is a result of collective action; that is, a decision by
communities to not overexploit the woodlot area by restricting the planting den-
sity. If this is the case, then this relationship also supports the hypothesis of an
inverse-U relationship between collective action and population density. However,
this is only an ex post hypothesis to explain a result that we did not expect, and fur-
ther research would be needed to confirm or reject this hypothesis.
With regard to market access, we find that communities that are more remote
provide greater collective labor input, plant trees more densely, and obtain higher
survival rates. These results are both statistically and quantitatively significant:
being 10 kilometers further from the woreda town increases predicted labor input
by 16 labor days per hectare (10 percent of average labor input), predicted planting
density by 2,400 trees per hectare, and tree survival by 3.5 percentage points. These
findings are consistent with the argument that improved market access undermines
collective action by increasing labor opportunity costs and/or giving people more
"exit" options from the community.
COMMUNITY MANAGEMENT IN THE HIGHLANDS OF ETHIOPIA
269
The presence of external organizations, as indicated by whether the woodlot was
promoted by an external organization (usually the TBoANRD), has a negative asso-
ciation with whether the community pays for a guard and with tree survival. The
negative association with community payment for a guard is probably because
external organizations often pay for the guard, reducing the need for this aspect of
collective action. This is similar to results found by Pender and Scherr (2002) in
Honduras, where external government organizations were found to displace local
collective action. The negative association of external promotion with tree survival
suggests that external programs may not be achieving full participation of local
communities in promoting woodlots. Part of the problem may be that local com-
munities often prefer to plant eucalyptus, which survive well and grow rapidly
under the uncertain rainfall of Tigray, whereas external organizations sometimes
promote other species that may be less hearty or less preferred by local households
( Jagger and Pender 2003).
Contrary to our expectations, we did not find that collective action was sig-
nificantly greater or more effective on village-managed woodlots than on tabia-
managed woodlots, after controlling for other factors. This may be because the dif-
ferences in benefits, community stability, or cohesiveness between the tabia level
and the village level are relatively small, and other factors such as population density,
market access, or external organizations may be more responsible for the differ-
ences in collective action found on different woodlots. The area of the woodlot also
had a statistically insignificant effect on our measures of collective management of
woodlots and its effectiveness. This suggests that economies or diseconomies of scale
in woodlot management are weak.
Grazing Lands
The results of econometric analysis are presented in Table 10.4. We find that the
Western zone has the least area of restricted grazing lands per household, consistent
with the existence of a relatively more abundant grazing land in the zone compared
to other zones of the region, thus perhaps reducing the need for restricted grazing
areas. The Central and Eastern zones also have less area of restricted grazing lands
per household compared with the Southern zone. However, communities in the
Central zone are more likely to pay for guards and establish penalty systems for vio-
lations of use restrictions, and communities in the Eastern zone are less likely to
violate use restrictions and are more likely to establish penalty systems than those in
the Southern zone, suggesting that in areas where collective action for grazing land
management is not easily established, it can nevertheless succeed once the hurdle of
establishment is overcome.
Table 10.4 Determinants of collective action for grazing land management, 1998
Average value of
If violations of
Area of restricted
household contribution
If community
use restrictions
grazing land
Whether community
for grazing
established
and regulations
Explanatory variable
per household
pays for guard
land management
penalty system
occurred in 1998
Central zone (cf. Southern zone)
ş0.169***
1.017***
2.126
1.002*
ş0.254
Eastern zone (cf. Southern zone)
ş0.115**
0.073
ş2.757
0.978*
ş1.214***
Western zone (cf. Southern zone)
ş0.259***
0.0173
2.000
0.053
0.153
Total number of households in village (average of 1991 and 1998)
ş0.00038
0.033***
0.009
ş0.0046
ş0.00495*
Total number of households in village squared
0.000000065
ş0.0000372***
ş0.00001
0.000006*
0.0000067**
If restricted grazing area was promoted by external organization
ş1.888***
3.380
0.249
0.076
Distance to nearest market town (walking time in minutes)
ş0.000034
0.0078***
0.006
0.005**
0.0016
If cattle rearing is second most important livelihood source
0.0237
ş0.255
0.585
0.031
ş0.231
Total number of local organizations operating in village
ş0.0037
ş5.375**
1.906**
1.591*
ş1.502*
Heterogeneity of ox ownership in community
ş0.029
ş0.481
ş25.708
2.816
3.713*
Total area of community
0.0015***
ş0.0067
0.0639
0.0068
ş0.0036
Intercept
0.218
ş3.873*
ş9.845
ş0.3812
0.248
Type of regression
Tobit
Probit
Tobit
Probit
Probit
Number of positive observations/total observations
74/100
119/154
161/225
210/231
62/237
Note: All regression results were corrected for sampling stratification and weights, and standard errors are robust to heteroskedasticity and nonindependence within the primary sampling units
(tabias).
***, **, * indicate significance levels at 1 percent, 5 percent, and 10 percent, respectively.
COMMUNITY MANAGEMENT IN THE HIGHLANDS OF ETHIOPIA
271
Communities are more likely to pay for guards at intermediate population
than at low or very high total population. The turning point in this relationship
(where maximum probability of communities paying for guards occurs) is 450
households per village, well within the range of total number of households per vil-
lage and very close to the average number of households per village.9 We also find
that violations of use restrictions are least likely to occur at intermediate population
(368 households per village). These results of the effect of population on collective
action for grazing land management are consistent with the hypothesis of an
inverse-U-shape relationship between population and collective action.
The involvement of external organizations in promoting restricted grazing
areas reduced the likelihood of communities paying for guards, suggesting that
the need for communities to pay for guards is eliminated by the payment made by
the external organizations. Involvement of external organizations has a positive
(but statistically insignificant) effect on household contributions for grazing land
management.
Communities with greater presence of local organizations make higher contri-
butions per household for grazing land management, are more likely to establish a
penalty system, and are less likely to have violations of use restrictions and regula-
tions. These results are consistent with the hypothesis that collective action for
natural resource management may be higher and more effective in communities
that have higher social capital. However, we also find a negative effect of experience
with local organizations on the likelihood of communities paying for a guard. Per-
haps a guard is less necessary in communities with greater investment in such local
social capital.
Communities that are more distant from markets are more likely to pay for
guards and establish a penalty system for grazing land management, suggesting that
more distant communities have a higher need for restricted grazing lands and that
collective action may be more likely because of lower opportunity cost of labor or
limited exit options in such areas. These results suggest that in areas closer to mar-
kets, alternative management options such as private management of grazing lands
may be a better option.
Whether or not cattle rearing is a second most important source of livelihood
in a community failed to affect any of the indicators of collective action signifi-
cantly. This may be because cereal crops production is the first most important
source of livelihood in all communities, and cattle rearing is considered only as
supplementary to crop production.
Heterogeneity in ox ownership tends to detract from collective action for graz-
ing land management, perhaps because of divergence in interest or benefits received
from restricted grazing lands. Heterogeneity increases the likelihood of violations
272
BERHANU GEBREMEDHIN, JOHN PENDER, AND GIRMAY TESFAY
of use restrictions and regulations (an indicator of failure of collective action).
Heterogeneity was also associated with less household contribution for grazing
land management, but that correlation was statistically insignificant. Communities
with larger total area have higher area of restricted grazing land, as expected.
A possible explanation for the weak influence of some of the explanatory vari-
ables is that there may be multicollinearity among the explanatory variables. We
tested for problems of multicollinearity in the regressions of woodlots and grazing
lands and found potential problems only between population density and popula-
tion density squared, and between the total number of households in village and its
squared value. We have retained these variables because they were necessary to test
the hypothesized inverted-U-shaped relationship. Moreover, omitting one of these
variables could result in omitted variable bias, given their significance in several of
the regressions.
Conclusions and Implications
Collective action in managing woodlots and grazing lands generally functions well
in the highlands of Tigray. Despite the fact that community benefits from wood-
lots in 1998 were limited as a result of various restrictions on use, the woodlots
contribute substantially to community wealth. Community members remain gen-
erally satisfied with the woodlots as a reserve of natural capital. Farmers perceive
that developing and enforcing use rules and regulations for grazing land manage-
ment results in significant regeneration of the grazing lands, and the conditions of
the area under community woodlot management have improved significantly.
Benefits from woodlots were greater, and reported problems of management
lower, on woodlots managed at the village level compared to the higher municipality
level. Communities that manage woodlots at the village level applied greater labor
inputs, planted much more densely, hired guards more often, and reported viola-
tions of restrictions less often. All restricted grazing lands are managed at the village
level and remain enforced once established. Community members contribute to
woodlot and grazing land management through cash, in kind, or through uncom-
pensated labor contributions.
We found support for the hypothesis of an inverted-U-shape relationship
between population density and collective action for woodlot management. We
also found evidence for an inverse-U-shape relationship between population level
and collective action for grazing land management. Collective action is higher and
more effective at intermediate population density or level.
Market access detracted from collective action for woodlot and grazing land
management, probably by increasing opportunity cost of labor and/or providing
COMMUNITY MANAGEMENT IN THE HIGHLANDS OF ETHIOPIA
273
more exit options to rural communities. Involvement of external organization was
associated with lower tree survival rate in woodlots and reduced the need for com-
munity contributions for protecting woodlots and grazing lands.
Experience in organizing and running local organizations encourages collec-
tive action for grazing land management, perhaps because learning effects of man-
aging cooperative effort or social capital helps to reduce the cost of attaining and
enforcing collective action. Heterogeneity in ox ownership appears to decrease
collective action for grazing land management, perhaps because of divergence in
interest or in benefits received from restricted grazing lands.
Our findings support the role of community resource management in redress-
ing resource degradation. The results suggest that community resource manage-
ment can be an effective means of redressing resource degradation and increasing
community wealth. The results also imply that community resource management
may be more effective and beneficial if conducted at the most local level and if
involvement of external organizations is demand driven and complementary to local
initiatives. Collective action for community resource management is likely to
be more effective in areas with intermediate population that are far from market
places and have higher social capital. In areas of greater market access and high
population density, privately oriented approaches to resource management may
be more effective.
Appendix 1: Summary Statistics of Variables Used in
Regressions for Woodlot Management
Number of
Standard
Variable
observations
Mean
error
Minimum
Maximum
Labor days per hectare
223
164.76
65.90
0
10,800
Whether community hires a guard
223
0.490
0.092
0
1
Whether violations of restrictions occurred
223
0.228
0.054
0
1
Number of trees planted per hectare
80
4,453
1,837
333
51,750
Tree survival rate (percent)
80
63.7
5.1
0
97.5
Southern zone
233
0.141
0.049
0
1
Central zone
233
0.423
0.100
0
1
Eastern zone
233
0.397
0.100
0
1
Western zone
233
0.039
0.019
0
1
1994 population density (per square kilometer)
225
154.9
14.7
39.5
301.7
Distance to woreda town (kilometers)
229
27.6
5.0
0
87
Woodlot promoted by external organization
227
0.949
0.233
0
1
Woodlot managed by village (versus managed
227
0.799
0.063
0
1
by tabia)
Area of woodlot (hectares)
227
7.76
1.34
0.13
100
Note: Means and standard errors are corrected for sampling stratification and weights.
274
BERHANU GEBREMEDHIN, JOHN PENDER, AND GIRMAY TESFAY
Appendix 2: Summary Statistics of Variables Used in
Regressions for Grazing Land Management
Number of
Standard
Variable
observations
Mean
error
Minimum
Maximum
Whether village has restricted grazing area
100
0.89
0.050
0
1
Area of restricted grazing area per household
100
0.067
0.015
0
1.916
(hectares)
Whether community pays for guard
154
0.72
0.042
0
1
Average household contribution for grazing
226
3.661
0.852
0
63.157
land management (Birr)
Whether village established penalties
231
0.97
0.008
0
1
Whether violations occurred
229
0.35
0.036
0
1
Eastern zone
231
0.23
0.047
0
1
Southern zone
231
0.30
0.050
0
1
Western zone
231
0.13
0.038
0
1
Central zone
231
0.32
0.053
0
1
Households per village
100
410
20.62
85
1,050
Walking distance from village to nearest
231
200
8.04
10
720
woreda town (minutes)
If grazing land promoted by external
231
0.31
0.035
0
1
organization
If cattle rearing is second most important
231
0.68
0.053
0
1
livelihood source
Number of local organizations operating in
231
4.1
0.124
1
6
village
Heterogeneity of ox ownership (coefficient of
231
0.25
0.007
0.10
0.45
variation)
Area of community (square kilometers)
231
62.08
4.78
12.3
179
Note: Means and standard errors are corrected for sampling weights and stratification.
Notes
1. Common property resources are defined as those resources that are owned and possibly
managed by a given community. They are contrasted with open access resources, which have no
defined owner.
2. Collective action is defined as action taken by a group (either directly or on its behalf
through an organization) to achieve a common objective, when the outcome depends on inter-
dependence of members.
3. Highlands are defined as those areas above 1,500 meters above sea level.
4. All villages in the highlands have some type of communal grazing lands, including re-
stricted and unrestricted.
5. The history of land tenure and redistributions is similar throughout the region. Hence, no
variables of local histories of land allocation and tenure were included in the regressions.
6. Every village has communal grazing lands. Some communities organize rules and regula-
tions to use and manage part of the community grazing lands. We used the area of the community
grazing land used according to community rules and regulations as indicator of collection action.
COMMUNITY MANAGEMENT IN THE HIGHLANDS OF ETHIOPIA
275
7. Total number of households was used instead of population density because all restricted
grazing lands were managed at the village level, for which we did not have area data.
8. Summary statistics of the variables used in the regressions are presented in Appendix 1.
9. Total number of households per village in the study area ranged from 85 to 1,050 with
an average value of 410. Summary statistics of variables used in the regressions are presented in
Appendix 2.
C h a p t e r 1 1
Influences of Programs and
Organizations on the Adoption of
Sustainable Land Management
Technologies in Uganda
Pamela Jagger and John Pender
Governments are devolving service and infrastructure provision, regulatory
authority, and decisionmaking in many developing countries. Market re-
forms and structural adjustment policies devolve the provision of services
and infrastructure to nongovernmental organizations (NGOs), community-based
organizations (CBOs), and the private sector (Farrington and Bebbington 1993;
Uphoff 1993; Pender and Scherr 2002). The transition from the provision of
extension services, input supply, rural credit delivery, regulation, and other aspects
of natural resource management from centralized governments to alternative in-
stitutions may have significant implications for the capacity of smallholders to
sustainably manage their resources.
Uganda presents an interesting opportunity to analyze the challenges and op-
portunities for institutional change in the face of government devolution and
increasing land degradation. The government of Uganda is presently decentralizing
many of its services, including those that are directly related to agriculture and the
environment. There is considerable evidence that land degradation in Uganda's
rural areas has been increasing and will continue to do so. Average annual soil
nutrient losses in Uganda of more than 70 kilograms of nitrogen, phosphorus, and
potassium (NPK) are among the highest rates of depletion in Sub-Saharan Africa
(Stoorvogel and Smaling 1990). Analysis of community perceptions about changes
278
PAMELA JAGGER AND JOHN PENDER
in natural resource conditions since 1990 indicates that the availability and quality
of cropland, grazing land, forests, and woodland are perceived to be decreasing
throughout the country (Pender et al. 2004a). Soil fertility is perceived to have sig-
nificantly deteriorated, and soil moisture-holding capacity and erosion problems
are worsening. Natural water sources and the biodiversity of plants and animals are
also perceived to be deteriorating in availability and quality (Pender et al. 2004a).
Land management policy in Uganda is currently being shaped by the Plan for
the Modernization of Agriculture (PMA), the Poverty Eradication Action Plan
(PEAP), and the Decentralization of Public Service Reform Plan. One of the main
goals of the PMA is that all activities related to agricultural production, agricultural
processing, trading, the supply of inputs, and the import and export of agricultural
produce will eventually be carried out by the private sector (MAAIF 1999). How-
ever, given lags in the time it takes for effective private sector intervention, non-
governmental organizations and community-based organizations are being asked
to take the lead in providing these services in the medium term, with the goal of
privatization of services by 2020.
The primary objective of this chapter is to characterize programs and organi-
zations in Uganda and to determine whether or not community and/or household
involvement in programs and organizations is influencing household-level adoption
of land management technologies. If community and/or household involvement
in programs and organizations have an observable influence on the adoption of
sustainable land management technologies, then there is a case for providing incen-
tives to encourage their development and sustainability. In particular, less-favored
areas that have traditionally been serviced by few programs and organizations may
be key areas for the promotion of organizations.
This chapter is organized as follows. The next section provides a brief historical
review of the roles of programs and organizations in Uganda from the mid-1950s
to the present. We then describe the study area and survey. Using survey data we
characterize programs and organizations that operated in rural Uganda between
1990 and 1999. The next section provides a conceptual framework and econo-
metric analysis of the determinants of programs and organizations and their effect
on the adoption of land management technologies. We conclude with a discussion
of policy implications emanating from the study.
NGOs and CBOs in Uganda: A Brief History
Organizations, including indigenous NGOs, urban associations, trade unions, and
cooperative societies such as the Ugandan African Farmer's Association enjoyed rel-
ative independence under the colonial government (Mamdani 1993). However, the
PROGRAMS AND ORGANIZATIONS IN UGANDA
279
newly independent government of Milton Obote was quick to impose government
regulation of cooperatives (Cooperative Societies Act of 1963), and the regulation
of trade unions (1970 Trade Union Act), which resulted in the formulation of a
single state-run cooperative and a single trade union in the early 1960s (Hyden
1983). Although a 1973 decree restored the autonomy of unions, organizations
were unable to function effectively under Idi Amin's regime.
Government programs dealing with agriculture and/or sustainable land man-
agement also failed under Obote and Amin. Agricultural research and extension
services collapsed in the late 1970s (ISNAR 1988). Smallholder cash crop pro-
duction was seriously affected. Food crops that could be sold in local or regional
markets replaced cotton production, and coffee survived through the smuggling of
produce across borders by an evolving network of private traders (Brett 1991).
Throughout the 1970s and 1980s, only a few international NGOs functioned
in the country, providing disaster and relief services, and indigenous NGOs had
very limited reach (Dicklitch 1998). During this time the most outspoken rural
voices were churches, which, in addition to acting as human rights watchdogs,
provided assistance to meet basic social needs. Churches also became increasingly
involved in the provision of basic health and education services as the economic
collapse of state services worsened in the early 1980s (Nabuguzi 1995).
When Musuveni took over leadership of the country in the mid-1980s, rural
infrastructure was in serious disrepair (Brett 1991, 1994; Howes 1997). However,
economic, social, and political change was rapid under Musuveni's National Resis-
tance Movement. The implementation of structural adjustment programs that
emphasized market rather than state delivery of services was the focus of the new
government. In addition, donors, self-help organizations, NGOs, and others arrived
to assist with rebuilding the country (Dicklitch 1998). Uganda's relative success
with structural adjustment led to growth in real agricultural GDP of 4 percent per
annum between 1987 and 1997, while real manufacturing GDP averaged 16 per-
cent growth (Belshaw, Lawrence, and Hubbard 1999).1
In the late 1980s, during the first structural adjustment phase, the National
Agricultural Research Organization (NARO) was formed. In addition to a strong
focus on agricultural research, NARO took on the responsibility of organizing and
training extension personnel to service the rural areas (ISNAR 1988). Land distri-
bution and tenure rights were also significant issues. Throughout the Amin years
the elite appropriated large tracts of land and evicted occupants without recourse,
resulting in common lands and forest reserves being invaded by squatters (Brett
1991). The new government assumed responsibility for monitoring and protecting
common land and protected areas as foreign NGOs, indigenous NGOs, commu-
nity organizations, and cooperatives reorganized.
280
PAMELA JAGGER AND JOHN PENDER
The current framework of decentralization is providing an enabling enviroment
for NGO activities. The National Agricultural Advisory Service (NAADS) is an
example of one of the five central initiatives of the PMA that is relying on NGOs
to provide demand-driven fee-for-service extension services to smallholders until
the provision of services can be fully privatized. Proposed requirements to align
government policy with NGO mandates will make the transition to fee-for-service
extension smoother but may also limit the previously independent scope of NGOs
focused on natural resource management.
Community-based organizations (CBOs) are much less formally organized in
Uganda and generally grow out of an identified need within the community.
CBOs are not registered unless their activities go beyond the needs and services of
the immediate community. Because of the absence of a registration system or any
formal requirements at the district level to document their presence, information on
CBOs is scarce, and their numbers are difficult to estimate. CBOs have the poten-
tial to reach policy makers by communicating their message through the established
local council (LC) system or by directly lobbying their member of parliament.
Research Method
We investigate the presence and roles of programs and organizations and their
influence on the adoption of sustainable land management technologies using data
collected from a series of surveys (community, village, and household level), con-
ducted between 1999 and 2001. Community-level characterization of programs and
organizations is based on a survey of 107 LC1s (local councils comprised of one
or a few villages), and villages from throughout most of Uganda conducted in
1999ş2000.2 A random sample of LC1s was stratified by agricultural potential,
market access, and population density.3
Agricultural potential classification was based on average length of growing
period, average rainfall, maximum annual temperature, and altitude (Ruecker et al.
2003). Six zones were identified: the low- and medium-potential unimodal-rainfall
areas at moderate elevations (much of northeastern Uganda and parts of northern
and eastern Uganda), the low-potential bimodal-rainfall area at moderate elevations
(lower-elevation parts of southwestern Uganda), the medium-potential bimodal-
rainfall area at moderate elevation (most of central and parts of western Uganda), the
high-potential bimodal-rainfall areas (Lake Victoria crescent), the high-potential
bimodal-rainfall areas of the southwest highlands, and the high-potential eastern
highlands (see Figure 7.1, in color insert). Market access was classified using the
measure of potential market integration estimated by Wood et al. (1999), which
is a measure of travel time from any location to the nearest five towns or cities,
weighted by the population of the towns or cities. Areas with high market access
PROGRAMS AND ORGANIZATIONS IN UGANDA
281
include most of the Lake Victoria region, the southwest and eastern highlands, and
parts of the north and west that are close to major roads or towns (Sserunkuuma,
Pender, and Nkonya 2001) (see Figure 7.2). Population density was classified on
the basis of parish-level rural population density in 1991, where more than 100
persons per square kilometer was classified as a high-population-density parish
(Sserunkuuma, Pender, and Nkonya 2001). Both highland (elevation greater than
1,500 meters above sea level) and lowland sites are represented in the sample.
One village was randomly selected from within each LC1. Respondents were
groups of approximately 8 to 15 LC1 or village members selected to represent dif-
ferent ages, occupations, and genders. Data on programs and organizations encom-
passed all programs and organizations present at the LC1 level and below.
Household surveys were conducted during 2000ş01 with four or five ran-
domly selected households from within each LC1. The household head as well as
other members of the household actively engaged in household decisionmaking
were interviewed. Data on household-level involvement with all types of programs
and organizations were collected. Information on sustainable land management
technologies used by the household was also collected in this survey. We have a
sample size of 451 households.
Characterizing Programs and Organizations in Rural Uganda
Types of programs and organizations. Programs are characterized as institutions asso-
ciated with the government of Uganda. Programs are unique in their ability to evoke
the authority of the state to levy taxes and prohibit certain behaviors by imple-
menting and enforcing laws (Uphoff 1993). We divided organizations into two
categories. Community-based organizations are those that evolve and are adminis-
tered, financed, and managed at the local level. Community-based organizations
are not registered with the government. Nongovernmental organizations include
both international and indigenous organizations established to provide services to
communities or districts. They are autonomous and are required to conform to the
government's regulatory requirements regarding registration and reporting.
We examined community-level presence of programs and organizations between
1990 and 1999, focusing on the number of each type of program or organization
present in each community. We also considered household-level involvement in
programs and organizations, where household involvement was defined as any mem-
ber of the household participating in the program or organization between 1990
and 2000 (Table 11.1). At the community level, NGOs were the most common
type of organization, with an average of almost one NGO per LC1. The bimodal
high- and low-rainfall zones had the highest average number of NGOs present per
LC1. These areas, including the Lake Victoria crescent and the southwest cattle
Table 11.1 Average number of programs and organizations per LC1, 1990ş1999, and household involvement in programs and organizations, 1990ş2000
Agricultural potential
Market
Population
access
density
Bimodal
Bimodal
Bimodal
Southwest
Eastern
Program or organization
Average
Unimodal
low
medium
high
highlands
highlands
Low
High
Low
High
Community presence (n =107)
Number of programs or organizations per community
Government program
0.64
0.74
0.36
0.39
1.10
0.17
0.30
0.58
0.66
0.60
0.66
(0.11)
(0.17)
(0.15)
(0.11)
(0.32)
(0.10)
(0.22)
(0.11)
(0.15)
(0.11)
(0.16)
NGO
0.99
1.10
1.41
0.50
1.44
0.79
0.55
0.64
1.130.78
1.10
(0.11)
(0.40)
(0.37)
(0.14)
(0.22)
(0.29)
(0.25)
(0.14)
(0.14)
(0.13)
(0.15)
CBO
0.62
0.07
0.85
0.33
0.52
2.13
0
0.25
0.78
0.48
0.70
(0.08)
(0.07)
(0.36)
(0.14)
(0.15)
(0.35)
(0.12)
(0.11)
(0.14)
(0.12)
Household involvement (n = 451)
Percentage of households
Government program
0.71
0
0
0
1.2
1.7
0
0
1.0
6.9
18.5
(0.41)
(0.1)
(1.7)
(1.0)
(2.7)
(3.5)
NGO
14.9
20.3
3.4
6.2
21.1
3.1
17.0
8.8
17.0
76.9
84.0
(2.6)
(9.5)
(3.4)
(2.4)
(4.6)
(1.9)
(9.7)
(2.9)
(3.3)
(3.1)
(2.9)
CBO
81.8
74.2
75.1
76.1
86.2
96.6
2.5
70.7
85.7
6.9
18.5
(2.2)
(9.6)
(6.7)
(4.0)
(3.1)
(2.4)
(11.0)
(4.2)
(2.6)
(2.7)
(3.5)
Note: Means and errors are corrected for sampling stratification and sampling weights. Values in parentheses represent standard errors.
PROGRAMS AND ORGANIZATIONS IN UGANDA
283
corridor, have good access to roads and markets, which may influence why NGOs
operate in these regions. The lowest average numbers of NGOs per LC1 were
found in the medium-potential bimodal-rainfall and eastern highland zones.
The average number of government programs and community-based organi-
zations present in sample communities was approximately equal. The highest aver-
age number of government programs was found in the bimodal high-potential
areas, which are close to the urban areas of Kampala and Jinja. The unimodal areas
in the north and east had the second highest number of government organizations.
Conversely, the southwest and eastern highlands had very few government pro-
grams. Community-based organizations were most common in the southwestern
highlands, in sharp contrast to the eastern highlands and low-potential unimodal
areas, where there were no or few CBOs.
We found higher numbers of NGOs in areas with good market access and in
areas with high population density. The number of government programs did not
vary significantly across low- and high-market-access areas or areas of low and high
population density. Like NGOs, community-based organizations were more com-
mon in areas with good market access and high population densities. Households
reported being primarily involved in NGOs and CBOs. Low reported levels of
involvement in government programs might result from the fact that most gov-
ernment programs are infrastructure related. Though these programs may have
required labor inputs from households, the households themselves were unlikely to
perceive this as "involvement" in the program.
Approximately 15 percent of households reported having at least one member
involved in a nongovernment organization at some time between 1990 and 2000.
These organizations include both externally organized (for example, CARE, African
Highlands Initiative, World Vision) and locally organized groups that were regis-
tered as NGOs. The unimodal and bimodal highland areas had the highest levels
of household involvement in NGOs with approximately 20 percent of households
reporting involvement by at least one household member. The eastern highlands
also had a relatively high level of involvement in NGOs, which contrasts with very
low levels of involvement in community-based organizations in this region. Over
80 percent of households in our sample were involved in CBOs between 1990 and
2000, with almost all households in the southwestern highlands being involved in
a CBO. The proportion of households involved in NGOs and CBOs was higher
in more densely populated areas and areas with good market access. These find-
ings are consistent with community-level data on the presence of programs and
organizations.
The general picture of organizational presence in the sample communities is
that government programs, NGOs, and CBOs were well represented in the bimodal
284
PAMELA JAGGER AND JOHN PENDER
high-potential areas close to urban centers. Government programs, NGOs, and
CBOS were poorly represented in the highland regions with the exception of CBOs
in the southwestern highlands. The absence of significant differences in the pres-
ence of government programs between high- and low-market-access areas or areas
of varying population density indicates that government programs were relatively
unbiased with respect to investment in less-favored areas. Higher average numbers
of NGOs in areas with good market access and high population densities may
result from the lower transactions costs of operating in these areas and contacting
potential participants, higher potential economic returns to organizational activities,
and the potential for influencing a greater number of people. Our finding that
CBOs were more common in areas with good market access may be explained by
better access to information about how to organize and the potential benefits of
organization, as well as ease of organizing when community members are located
closer together.
Main focus of programs and organizations. Programs and organizations in rural
Uganda operate in a wide variety of sectors. We consider both the proximate and
underlying causes of land degradation to categorize programs and organizations
and to identify their potential relationships to sustainable land management. The
proximate causes of land degradation include natural factors such as soil type and
climate fluctuation and unsustainable farming practices such as decreased fallow
periods and the cultivation of fragile lands. We hypothesize that programs and
organizations focused on agriculture or environment related topics such as tree plant-
ing or the distribution of agricultural inputs are likely to have a direct effect on the
adoption of land management technologies (Table 11.2). Programs and organiza-
tions also focus on issues such as population pressure, poverty, lack of infrastructure
and services, lack of access to credit, and the provision of social services. Though
the goal of these types of programs and organizations is not to address the issue of
land degradation, they may have an indirect effect on the adoption of land manage-
ment technologies.
In approximately half of the LC1s in our survey at least one program or or-
ganization focused on agriculture- or environment-related issues during the 1990s
(Table 11.3). Agriculture and environment programs and organizations were most
common in the high-potential bimodal-rainfall areas. Surprisingly, there were very
low numbers of these programs and organizations in the highland areas where land
degradation is a particularly serious problem, and in the medium-potential bimodal-
rainfall areas. Approximately 30 percent of the households in our survey reported
involvement in an agriculture- or environment-focused organization. Above-average
levels of involvement were found in the unimodal-rainfall areas (42 percent) and in
Table 11.2 Main focus of programs and organizations in relation to the proximate and underlying causes of land degradation
Relationship to
Cause of land degradation
Description of cause
land management
Main focus of programs or organizations (activities)
Proximate causes of land degradation
Natural factors
Soil type and climate variability
Direct
Agriculture and veterinary services/extension (training and sensitization, supply of inputs, stocking
and restocking livestock, credit for input purchase, promoting adoption of new technologies,
marketing of agroproducts)
Unsustainable farming practices
Decreased fallows and cultivation of
Direct
Environment (afforestation, promoting soil and water conservation, energy conservation and
fragile lands
research)
Underlying causes of land degradation
Population pressure
Increased land pressure as a result of
Indirect
Women's empowerment and emancipation (increase household decisionmaking power and
decreased fallows and partitioning
community participation)
of farmland, increased food demand
Health (sex education and family planning)
Lack of infrastructure and services
Poor infrastructure can slow price
Indirect
Education (construction and maintenance of schools, provision of scholastic materials)
signals and reduce access to
Health (construction and maintenance of health facilities, provision of medical supplies and
agricultural inputs
pharmaceuticals)
Lack of adequate education, health,
Water and sanitation (improved access to water for drinking and irrigation)
water services, and so on can
General infrastructure (investment in roads)
reduce labor productivity
Lack of credit
Providing credit may affect the use or
Indirect
Credit
adoption of inputs and sustainable
land management technologies
Poverty
May lead to short-term planning
Indirect
Income generation (job training, entrepreneurial skills)
horizons that inhibit households
Poverty eradication
from investing in land management
Social development
Social assistance to the disadvantaged
Lack of community services
Generally meet short- to medium-term
Very indirect
Mutual support
community needs for assistance
Funeral arrangements
Youth programs
Table 11.3 Average number of programs and organizations per LC1, 1990ş1999, and household involvement in programs and organizations, 1990ş2000, by sector
Agricultural potential
Market
Population
access
density
Bimodal
Bimodal
Bimodal
Southwest
Eastern
Main focus of program or organization
Average
Unimodal
low
medium
high
highlands
highlands
Low
High
Low
High
Community presence (n =107)
Number of programs or organizations per community
Agriculture/environment
0.44
0.32
0.57
0.14
0.87
0.13
0.25
0.17
0.55
0.26
0.53
(0.07)
(0.19)
0.23)
(0.06)
(0.19)
(0.10)
(0.21)
(0.10)
(0.10)
(0.10)
(0.10)
Population
0.09
0.15
0.08
0
0.17
0.09
0.25
0.02
0.130.05
0.12
(0.03)
(0.08)
(0.08)
N/A
(0.08)
(0.09)
(0.21)
(0.02)
(0.05)
(0.03)
(0.05)
Infrastructure and services
0.74
0.74
0.76
0.76
0.58
0.52
0.61
0.77
0.71
0.67
0.75
(0.10)
(0.10)
(0.33)
(0.25)
(0.17)
(0.22)
(0.29)
(0.18)
(0.11)
(0.16)
(0.12)
Credit
0.08
0.07
0.07
0
0.18
0.09
0
0.030.11
0.07
0.09
(0.04)
(0.07)
(0.07)
N/A
(0.11)
(0.09)
N/A
(0.02)
(0.06)
(0.04)
(0.06)
Poverty
0.76
0.68
0.97
0.49
0.82
1.35
0.09
0.51
0.86
0.74
0.76
(0.12)
(0.27)
(0.33)
(0.19)
(0.26)
(0.3)
(0.05)
(0.19)
(0.15)
(0.18)
(0.15)
Community service
0.18
0
0.17
0.04
0.12
0.91
0
0.04
0.25
0.08
0.24
(0.03)
N/A
(0.13)
(0.04)
(0.07)
(0.14)
N/A
(0.03)
(0.05)
(0.04)
(0.05)
Household involvement (n = 451)
Percentage of households
Agriculture/environment
29.8
41.5
11.0
23.1
34.2
25.0
27.4
19.7
33.4
26.6
31.3
(3.4)
(9.6)
(6.5)
(4.8)
(6.2)
(6.3)
(10.7)
(4.5)
(4.3)
(3.6)
(4.7)
Population
0
0
0
0
0
0
0
0
0
0
0
Infrastructure and services
14.9
28.9
8.9
12.1
12.0
23.9
13.6
12.2
15.9
11.3
16.6
(2.3)
(10.1)
(4.4)
(3.8)
(3.4)
(5.8)
(9.0)
(3.9)
(2.8)
(3.7)
(2.9)
Credit
41.8
32.3
62.3
34.4
37.9
82.1
22.6
35.9
43.9
41.2
42.1
(3.1)
(5.8)
(8.0)
(4.9)
(5.7)
(5.3)
(11.3)
(5.0)
(3.7)
(4.9)
(3.8)
Poverty
14.0
9.9
13.6
11.6
13.5
23.5
27.6
10.8
15.2
12.5
14.7
(2.6)
(5.0)
(7.0)
(3.8)
(4.6)
(7.3)
(11.3)
(3.7)
(3.2)
(4.1)
(3.2)
Community service
48.6
27.7
49.1
34.4
56.2
83.4
23.4
42.5
50.8
38.1
53.4
(2.8)
(9.6)
(9.1)
(5.0)
(4.3)
(6.1)
(9.9)
(5.3)
(3.2)
(4.8)
(3.4)
Labor exchange
12.8
8.2
15.8
14.7
11.2
25.9
1.314.4
4.0
17.8
10.5
(2.1)
(4.8)
(7.1)
(4.5)
(3.4)
(6.8)
(1.3)
(12.2)
(2.4)
(4.3)
(2.3)
Miscellaneous
12.2
11.1
4.7
8.7
16.5
9.6
4.2
9.5
13.2
9.9
13.3
(2.6)
(9.1)
(4.7)
(3.6)
(4.6)
(3.4)
(3.8)
(3.4)
(3.3)
(3.4)
(3.4)
Note: Means and errors are corrected for sampling stratification and sampling weights. Values in parentheses represent standard errors.
288
PAMELA JAGGER AND JOHN PENDER
the bimodal high-rainfall areas (34 percent). Given the relatively limited community-
level presence of such organizations in the unimodal zone, household participation
in the unimodal areas was higher than expected.
Of the programs and organizations focused on topics other than agriculture
and the environment, community respondents cited very few with a main focus on
credit or reducing population pressure. A high proportion of programs and orga-
nizations deal with infrastructure and services (including those focused on educa-
tion, health, water, and general infrastructure). The highest average number of such
programs and organizations was in the southwestern highlands, which may explain
general improvements in health and education in this region between 1990 and
1999 (Pender et al. 2004a).
Household involvement in organizations focused on credit or community
service was most common. This finding contradicts community-level data, which
show such organizations to be relatively rare in many areas. It is possible that com-
munity members did not perceive locally organized credit and savings groups as
"organizations" when responding to the community level survey. Alternatively, it
could be that the provision of credit is the function that many households identify
NGOs and CBOs with, whereas community leaders may not have identified credit
as the organization's primary focus. The highest proportion of household-level
involvement in community serviceşfocused organizations was in the southwestern
highlands. The bimodal high-rainfall and bimodal low-rainfall areas also had
above-average household involvement in community serviceşfocused organizations.
In general, our findings with respect to household-level involvement in infrastruc-
ture and service or poverty reductionşfocused organizations were consistent with
community-level data on the presence of programs and organizations.4
Higher average numbers of agriculture and environment programs were
found in LC1s with good market access or high population density. Households in
areas with good market access also had higher rates of participation in agriculture-
and environment-focused programs and organizations. Both poverty alleviation and
community serviceşfocused programs and organizations were more common in
high-market-access areas. Household involvement in credit programs and organiza-
tions did not differ significantly with market access or population density. Approx-
imately 50 percent of households in areas with good market access and higher pop-
ulation densities were involved in community serviceşfocused organizations.5
Consideration of how main focus varies by type of program or organization
illustrates the differing agendas of government programs, nongovernmental orga-
nizations, and community-based organizations. Table 11.4 summarizes the main
focus of the government programs, NGOs, and CBOs found among the LC1s that
identified programs or organizations functioning within their communities between
PROGRAMS AND ORGANIZATIONS IN UGANDA
289
Table 11.4 Main focus of programs and organizations by type
Program or organization (%)
Main focus of program
or organization
Total (n = 249)
Government
NGO
CBO
Agriculture/environment
18.5
6.7
10.8
1.0
(1.7)
(2.4)
(0.1)
Population
4.2
0
3.2
1.0
N/A
(1.0)
(0.1)
Infrastructure and services
31.9
12.3
17.4
2.2
(2.0)
(3.1)
(1.2)
Credit
3.6
0
2.6
1.0
N/A
(1.6)
(0.1)
Poverty
33.8
8.9
10.1
14.8
(2.7)
(2.2)
(2.7)
Community service
8.2
0
0
8.2
N/A
N/A
(1.4)
Total
~100
27.9
44.1
28.2
Note: Means and errors are corrected for sampling stratification and sampling weights. Values in parentheses represent
standard errors.
1990 and 1999. Approximately 19 percent of the total number of programs and
organizations are focused on the proximate causes of land degradation. NGOs
account for the largest percentage of agriculture- and environment-focused pro-
grams and organizations, whereas community-based organizations make up only
1 percent of agriculture- and environment-focused organizations. Programs and
organizations focused on infrastructure and poverty alleviation are most common.
The highest proportion of infrastructure programs is NGOs, though government
programs are also well represented. CBOs are heavily focused on poverty alleviationş
related activities, though NGOs and government programs are also well repre-
sented in this category. The proportion of total programs and organizations
devoted to population (e.g., family planning) and credit is relatively small (4.2 and
3.6 percent, respectively). The majority of organizations that deal with these focus
areas are NGOs.
To investigate the effects of programs and organizations on farmers' adoption
of land management technologies, we consider household use of inorganic fertil-
izer, animal manure, incorporating crop residues, mulching, and pesticides (Table
11.5). A higher proportion of households adopted pesticides when there was an
agriculture- or environment-focused program or organization in the LC1. Rates of
adoption of inorganic fertilizer, animal manure, and applying crop residues were
only slightly lower for these communities. Having other types of programs or orga-
nizations present in the LC1 appears to have little influence on whether or not
Table 11.5 Household-level adoption of selected land management technologies, all households, households in communities with programs or organizations
present, and households with involvement in organizations, 2000
Involved in
Agricultural/environmental
Organization focused
Involved in
organization focused
program/organization
on indirect causes of
agriculturally/environmentally
on indirect causes of
All households
in LC1
land degradation in LC1
focused organization
land degradation
Technology
(n = 446)
(n = 147)
(n = 323)
(n = 112)
(n = 318)
Applying inorganic fertilizer
10.0
9.1
7.6
17.9
10.9
(2.0)
(3.7)
(2.2)
(5.5)
(2.6)
Applying animal manure
23.0
22.1
22.6
25.5
24.3
(2.8)
(4.8)
(3.3)
(6.0)
(3.5)
Applying crop residue
17.6
14.319.0
19.4
17.8
(2.4)
(3.6)
(2.9)
(5.9)
(5.7)
Mulching and applying organic matter
20.4
21.2
20.7
28.1
21.6
(2.6)
(4.9)
(3.1)
(6.6)
(3.2)
Applying pesticides
23.4
29.9
21.5
25.0
26.3
(2.9)
(5.9)
(3.4)
(5.8)
(3.6)
Note: Values are percentages. Means and errors are corrected for sampling stratification and sampling weights. Values in parentheses represent standard errors.
PROGRAMS AND ORGANIZATIONS IN UGANDA
291
technologies are adopted. Rates of technology adoption were higher in all cases
where households were involved in an agriculture- or environment-focused orga-
nization, most significantly the adoption of pesticides, mulching, and applying
organic matter. Household involvement in other types of programs or organiza-
tions (i.e., infrastructure, credit, poverty alleviation, and community service) also
had a positive association with the adoption of all land management technologies
considered, though to a lesser extent than household involvement in agriculture-
and environment-related programs and organizations. However, these associations
may be related to other factors, such as differences in agricultural potential or mar-
ket access, rather than to participation in these programs and organizations. The
analysis in the following section further explores the potential effects of organiza-
tional presence or household-level involvement in an organization on the adoption
of sustainable land management technologies, controlling for other factors.
Conceptual Framework for Econometric Analysis
We propose six possible outcomes related to the effect of a program or organiza-
tion on the adoption of land management technologies (Figure 11.1). We first
consider whether or not the program or organization is present in the community.
Our hypothesis is that households located in communities with agriculture- or
Figure 11.1 Organizational presence and the potential for sustainable land
management (SLM) technology adoption
Is the organization present
in the community?
Organization
Organization
present
not present
Household
Household not
Household not
involved with
involved with
involved with
the organization
the organization
the organization
Household
Household
Household
Household
Household
Household
adopts SLM
does not
adopts SLM
does not
adopts SLM
does not
technology
adopt SLM
technology
adopt SLM
technology
adopt SLM
technology
technology
technology
292
PAMELA JAGGER AND JOHN PENDER
environment-focused programs or organizations are more likely to adopt land
management technologies, even if not directly involved in such organizations, as a
result of knowledge spillover effects. We also expect that communities that have
programs or organizations focused on credit provision, poverty reduction, and
other areas that generally lead to improved incomes and welfare may be more likely
to adopt land management technologies. However, this linkage will be indirect.
The second decision deals with whether or not the household participates in
the program or organization. This decision is determined by the organization if
they are targeting households that fit specific program criteria, as well as the house-
hold. We explore the determinants of household-level involvement in programs
and organizations econometrically. As with the presence of a program or organi-
zation in a community, we hypothesize that households directly involved with an
organization focused on agriculture- or environment-related issues are more likely
to adopt land management technologies. We also expect that household-level
involvement in organizations focused on poverty reduction, reducing population
pressure, and so on may indirectly affect technology adoption. Involvement in these
types of programs or organizations may lead to medium to long-run changes in the
ability or willingness of smallholders to adopt land management technologies.
However, these longer-term effects may be difficult to discern from the limited
time period our data consider.
The third decision is whether or not the household will adopt the land man-
agement technology. We estimate a two-stage probit model to determine the
effect of the presence of a program or organization in a community and house-
hold-level involvement in the program or organization on the adoption of land
management technologies.
When there is no program or organization in the community, there are two
possible outcomes in our model: the technology is adopted or not adopted by the
household. Technology adoption could depend on interactions with government
extension officers, farmer innovations, information diffusion through social net-
works, and so on. We control for these and other factors in our analysis. The frame-
work we have proposed enables us to investigate the direct effects of programs and
organizations on the adoption of land management technologies versus spillover
or diffusion effects. Spillover or diffusion effects come into play when a program or
organization has the ability to affect adoption even among households not directly
working with the program or organization through diffusion of information. This
is very important to investigate because the ability of technologies to be widely
adopted depends largely on ease of diffusion. Some technologies are more likely to
diffuse than others. For example, soil and water conservation measures such as Fanyu
PROGRAMS AND ORGANIZATIONS IN UGANDA
293
ju terraces that require substantial labor investments and offer limited returns in
the short to medium term are less likely to diffuse easily than low-cost, high-return
technologies such as improved seeds.
Explanators of Organizational Presence
The dependent variables used in our analysis of community-level program or orga-
nizational presence were whether or not there is an agriculture- or environment-
focused program or organization functioning in the community and whether or
not there is another type of program or organization functioning in the commu-
nity. Our analysis includes only programs and organizations that started working
in communities in 1990 or later.6 The explanatory variables in our analysis include
agroclimatic zone, market access, population density, community-level indicators
of welfare and wealth estimated for 1990, estimated community-level indicators of
average education, and access to basic infrastructure and services in 1990.7 By using
explanatory variables based on estimates of conditions in 1990, we get a sense of
the factors that have motivated programs or organizations to locate or evolve in
these communities since then (Table 11.6).8
We have only one significant variable in our model to explain the presence of
agriculture- and environment-focused programs and organizations. The finding
that the coefficient of distance to a tarmac road is negative and significant is con-
sistent with our descriptive analysis and indicates that agricultural and environ-
ment programs and organizations are associated with good market access. Because
we have few significant variables, our model may be failing to capture some key
explanatory variables, or these programs may not be well targeted. The model
better explains the presence of programs and organizations that may influence the
indirect causes of land degradation, though most of our significant variables are
only weakly significant. We find that such programs and organizations are less
likely to occur in the bimodal medium-rainfall and eastern highland regions. We
find that programs and organizations are more likely in more populous communi-
ties and also where housing quality (measured by the proportion of people with a
metal roof ) is lower. We also find that these programs and organizations are more
likely in communities where the proportion of school-aged children enrolled in
secondary school is higher, suggesting a linkage between education and organiza-
tional development. Finally, we find that programs and organizations are more
likely where access to basic infrastructure is poorer (in the case of roads) but where
access to resources is better (with respect to access to fuelwood). Such programs
and organizations appear to focus on less-market-connected and more-resource-
abundant communities.
Table 11.6 Determinants of program or organization presence by main focus between 1990 and 1999, probit estimation
Program or organization focused
on agriculture and/or the
Program or organization focused
Variable
environment present in LC1
on other issues present in LC1
Agricultural potential (cf. unimodal)
Bimodal low
0.1102
0.0422
Bimodal medium
ş0.2148
ş0.3234*
Bimodal high
0.3085
0.2269
Southwestern highlands
0.02230.1655
Eastern highlands
0.1903ş0.53
19*
Market access (0/1 dummy where high = 1)
0.1941
0.1937
Population density (0/1 dummy where high = 1)
0.0313
ş0.1767
(ln) Households in LC1 in 1990 (number)
0.0561
0.1290*
Households without adequate food in 1990 (proportion)
ş0.00230.03
46
Households with metal roof in 1990 (proportion)
ş0.0041
ş0.5448*
Households where adult can read and write, 1990 (proportion)
ş0.0018
ş0.5253
Households with children of secondary school age in school, 1990 (proportion)
ş0.0041
0.5497*
(sqrt) Distance to tarmac road in 1990 (miles)
ş0.0724**
0.0593*
(sqrt) Distance to primary school in 1990 (miles)
0.0612
ş0.0153
(sqrt) Distance to nearest fuelwood source in 1990 (miles)
ş0.0708
ş0.1588**
(sqrt) Distance to drinking water source (dry season) in 1990 (miles)
ş0.0296
0.0244
(sqrt) Distance to drinking water source (rainy season) in 1990 (miles)
0.0735
0.0152
Number of observations
98
98
Mean of dependent variable
31.6
73.8
Mean predicted probability of program or organization
23.9
80.0
Pseudo-R 2
0.28630.2773
Note: Reported coefficients represent the effect of a unit change in explanatory variable on probability of a program or organization being present at the mean of the data. Coefficients
are adjusted for sampling weights and stratification and are robust to heteroskedasticity. Intercept is not reported.
* and ** mean coefficient statistically significant at 10 percent and 5 percent levels, respectively.
PROGRAMS AND ORGANIZATIONS IN UGANDA
295
Explanators of Household Involvement in Organizations
Household-level characteristics determine whether or not households will be in-
volved in organizations. The dependent variables for our probit regressions include
whether or not any member of the household was involved in any type of organi-
zation, any agriculture- or environment-focused organization, or any organization
with a focus on topics that might influence the indirect effects of land degradation,
between 1990 and 2000 (Table 11.7). Our explanatory variables include the human,
social, and physical capital of the household. Indicators of human capital include
the education level of the household head, whether or not the household head is
female, the number of male and female members in the household, and the age of
the household head. We consider religion and ethnicity of the household head as
well as whether or not the household head and spouse were born in the village they
currently reside in, as indicators of social capital.9 We use estimated acres of land
owned or operated by the household in 1990,10 the number of bulls and cows or
heifers owned by the household in 1990, and whether or not the household owned
a radio or bicycle in 1990 as our proxies for physical capital.
We also consider whether or not the primary or secondary source of income of
the household is dependent on farming or some other natural resourceşbased
enterprise (for example, fuelwood-intensive enterprises such as brickmaking and
beer brewing). We expect households with a high degree of resource dependence
(i.e., those households where both the primary and secondary sources of household
income are related to agriculture or natural resources) to be more involved in agri-
culture- or environment-focused organizations than households less dependent on
natural resources for income.11,12
In general, social capital is an important determinant in household involvement
in organizations. Households where the head is from a dominant ethnic group
(e.g., Banyankore and other southwestern highland peoples), or where the head's
spouse was born in the village, are more likely to be involved in programs and
organizations. Human capital and gender are also an important determinant in our
regressions. Female-headed households and households with higher proportions of
women are more likely to be involved in programs and organizations. We also find
that higher levels of education of the household head are positively and strongly
associated with involvement in agriculture- or environment-related organizations.
Note also that all households with education beyond "O" level participated in some
kind of organization. This is a significant result, although the variable had to be
dropped since it predicts participation perfectly. We find that resource dependence
is positively correlated with household-level involvement in programs and organi-
zations. However, surprisingly, this is not the case for household involvement in
programs focused on agriculture and the environment.
Table 11.7 Determinants of household involvement in programs and organizations between 1990 and 2000, all households, probit estimation
Household involved in
Household involved
agriculturally/environmentally
Household involved
Variable
in any organization
focused organization
in other organization
Education level of household head (cf. none)
Some primary or completed primary
ş0.0139
0.1204
0.0168
More than primary up to O-levels
0.0019
0.3571**
0.0058
Beyond O-levels
Variable droppeda
0.7286***
0.1397
Female household head
0.0856
0.1280
0.1378*
(sqrt) Number of men in household
ş0.0573ş0.0515
0.0026
(sqrt) Number of women in household
0.0652*
0.0916
0.0099
(ln) Age of household head
0.0408
0.0925
ş0.0236
Non-Christian household head
0.1068
0.0005
0.0950
Baganda
0.1100*
0.0136
0.1180
Banyankore and southwestern highland peoples
0.1388***
ş0.0231
0.1895***
Northern people (e.g., Acholi, Langi)
0.1538**
0.4183
0.1037
Iteso and Kumam
0.0676*
0.0208
0.0565
Eastern peoples (e.g., Basoga, Bagisu)
0.1636*
ş0.0061
0.1474
Eastern highland peoples
0.0307
ş0.1550
0.0136
Household head born in village
ş0.0019
ş0.0967
0.0428
Spouse born in village
0.0342*
0.0792
0.0453
Estimated acreage in 1990
ş0.0007
ş0.0060
0.0002
(sqrt) Number of bulls in 1990
0.0188
0.0296
ş0.0224
(sqrt) Number of cows/heifers in 1990
0.0057
0.0296
0.0027
Owned radio in 1990
0.09130.1040
0.0549
Owned bicycle in 1990
ş0.0299
0.0062
ş0.0013
Only secondary source of income resource dependent, 1990 (cf. income not resource dependent)
0.1184
ş0.0599
0.1867*
Only primary source of income resource dependent, 1990
0.1246**
ş0.0383
0.1390***
Both primary and secondary source of income resource dependent, 1990
0.2268***
0.01030.2474***
Number of observations
425
445
445
Mean of dependent variable
83.0
29.9
78.8
Mean predicted probability of program or organization
85.8
27.4
80.9
Pseudo-R 2
0.1211
0.1847
0.0916
Note: Reported coefficients represent the effect of a unit change in explanatory variable on probability of a program or organization being present at the mean of the data. Coefficients are adjusted
for sampling weights and stratification and are robust to heteroskedasticity. Intercept is not reported.
aVariable dropped: predicts success perfectly.
*, **, *** mean coefficient statistically significant at 10 percent, 5 percent, and 1 percent levels, respectively.
298
PAMELA JAGGER AND JOHN PENDER
Explanators of Household Adoption of Sustainable Land Management
Technologies: Do Programs and Organizations Matter?
Whether or not the presence of an organization in a community and/or a house-
hold's level of involvement in an organization contributes at least in part to the adop-
tion of new technologies has important implications for the future role that
organizations will have in providing an enabling environment for sustainable land
management in Uganda. In our final set of regressions, we use the adoption of
selected land management technologies in 2000 as our dependent variables. We
focus on five technologies that have been adopted by at least 10 percent of the
households in our sample: use of inorganic fertilizer, use of animal manure as fer-
tilizer, incorporation of crop residues, mulching, and pesticides.
Our explanatory variables include those factors that we hypothesize will directly
affect the adoption of land management technologies. We use the agro-ecological
potential of the LC1s in which the households are located as well as market access
and population density as described in the community-level regressions. We
hypothesize that the costs and returns associated with technology adoption will be
a function of agroclimatic factors as well as access to markets and population den-
sity (Pender, Scherr, and Durˇn 2001; Chapter 2). We also consider the population
growth rate in the community, hypothesizing that high rates of population growth
may prompt the adoption of land management technologies to compensate for
land use pressure. To provide information about household-level access to infra-
structure, we include average distance from all parcels of land the household owned
or operated to the nearest all-weather road and nearest market. We also consider
the average distance from the household to each parcel owned or operated by
the household. Travel time to plots as well as the distance bulky inputs such as ani-
mal manure need to be carried will influence whether households adopt different
technologies.
We include several household-level variables to describe human, social, and
physical capital. We include whether or not the household is female headed, the
age of the household head, the education level of the household head, and whether
or not the household head was born in the village as indicators of household-
level human and social capital. We are uncertain of the effect of gender of house-
hold head on technology adoption. Female-headed households are likely to have
significant constraints on their time, possibly making them unlikely to undertake
labor-intensive technologies such as manure collection. We also include informa-
tion on the household labor force. We hypothesize that larger households will be
more likely to adopt labor-intensive land management technologies. Asset access
is indicated by the estimated total area of land the household owned or operated in
2000 as well as the number of bulls and cattle the household owned in 2000 and
PROGRAMS AND ORGANIZATIONS IN UGANDA
299
whether or not the household owned at least one radio or one bicycle. Households
with greater wealth may be more likely to undertake land management technolo-
gies that offer medium- to long-run returns because of lower discount rates and less
binding cash constraints (Pender 1996; Holden, Shiferaw, and Wik 1998; Pender
and Kerr 1998). We expect households with low asset levels to undertake tech-
nologies, such as using animal manure as fertilizer, that are labor-intensive and may
offer short-run returns.
Access to both informal and formal credit may be important indictors of
whether or not households can obtain access to external inputs such as inorganic
fertilizer, improved seed, and pesticides. We hypothesize that access to credit will
have a positive effect on the adoption of technologies purchased with cash. Where
access to credit is poor, the adoption of technologies that do not require the purchase
of external inputs, such as use of manure or mulch, may be greater. We also con-
sider the effect of contact with an extension worker in 2000. We hypothesize that
contact with extension will be positively correlated with adoption of the various
land management technologies we consider. With respect to land tenure, we expect
that adoption of technologies such as tree planting that yield benefits over the
medium to long term will be associated with more secure forms of land tenure
such as freehold (Feder and Onchan 1987). Tenure security also may increase the
value of land as collateral for credit, thus potentially increasing the adoption of
technologies requiring cash inputs (Feder and Onchan 1987). As with the last set
of regressions, we consider the level of dependence of the household on natural
resourceşrelated primary and secondary income sources. We hypothesize that house-
holds are more likely to undertake various sustainable land management tech-
nologies when their livelihoods are more dependent on natural resources.
Finally, we include the presence of agriculture- or environment-related pro-
grams in the community, and the presence of a program or organization focused
on the indirect causes of land degradation in the LC1 as potential determinants
of the adoption of various technologies.13 We hypothesize that the presence of
an agriculture- or environment-related program increases the likelihood of the
household adopting various land management technologies. We also include house-
hold involvement in agriculture- or environment-focused organizations and
group together those that are focused on the indirect causes of land degradation in
our regressions. Similarly we expect that households involved in agriculture- or
environment-related organizations are more likely to adopt sustainable land man-
agement technologies. However, household-level involvement in other types of
organizations may also affect technology adoption.
Note that we do not include variables related to community-level infrastruc-
ture and poverty in 1990 from our first set of regressions. We also omit variables
300
PAMELA JAGGER AND JOHN PENDER
pertaining to ethnicity and religion that were used in our second set of regressions.
The variables that have been excluded from our two-stage probit model but that
were included in our earlier models are instrumental variables used to help identify
the effects of programs and organizations using predicted values to control for
endogeneity of program placement and participation. Consider, for example,
ethnicity: we expect that stature in the community is likely to be directly related to
household-level involvement in programs and organizations. As we have already
pointed out, organizations may seek out community leaders to work with, or leaders
themselves may organize groups within the community. However, we do not ex-
pect social capital to directly cause the adoption of land management technologies,
controlling for household participation in programs and organizations. Regression
results are presented in Table 11.8.14
Our findings with respect to the presence of agriculture- or environment-
focused programs and organizations in a community provide limited evidence that
they are directly affecting household adoption of land management technologies.15
We found a strong positive association between the adoption of pesticides and the
presence of an agriculture- or environment-focused program or organization in a
community. One possible explanation for this is that the knowledge spillover
effects of programs and organizations may be greater for purchased inputs, yielding
higher short-term benefits than for labor-intensive on-farm organic alternatives such
as mulching and manuring. When we consider the effects of direct household in-
volvement in programs and organizations, we find significant results for two of the
five technologies we consider. Household involvement in agricultureşenvironment
organizations is associated with a higher likelihood of adopting inorganic fertilizer
(a purchased input) and manuring (a labor-intensive organic technology). Thus,
more direct involvement in programs and organizations may be required to pro-
mote the adoption of organic land management practices.16
We find a positive association between household involvement in other types
of organizations and the adoption of pesticides and crop residues. Household adop-
tion of pesticide use may be facilitated by involvement in credit and community
serviceşoriented programs and organizations. Such organizations enable poorer
households to purchase inputs such as pesticides.
In general, with the exception of organizations focused on agriculture and
environment, we do not have strong results linking involvement in programs and
organizations to the adoption of land management technologies. However, commu-
nity survey respondents perceived strong positive effects of several types of orga-
nizations on crop production, land quality, and livestock production. Additional
research is needed to consider the effect of involvement in programs and organiza-
tions on crop productivity, livestock productivity, and other livelihood strategies.17
Table 11.8 Determinants of investment in selected land management practices, probit estimation, 2000
Inorganic fertilizer
Pesticides
Crop residues
Mulching
Animal manure
Presence of agriculturally/environmentally focused program or organization in LC1
0.0013şşş
0.1942***
ş0.0042
ş0.0186
ş0.0633
Presence of program or organization focused on indirect causes of land degradation in LC1
ş0.0056+++
ş0.0282++
0.0954**
ş0.0335
ş0.0181
Household involvement in agriculturally/environmentally focused organization
0.0326**
0.0908+++
0.02730.0862
ş0.0982**+++
Household involvement in organization focused on indirect causes of land degradation
0.0029
0.1314***
0.0695*
0.0742
0.0175
Agricultural potential (cf. unimodal)
Bimodal low
ş0.0144
ş0.1848***şş
ş0.1160**şş
0.3478**++
0.0347
Bimodal medium
ş0.0051
ş0.0055
ş0.1152***şşş
ş0.1334**şşş
ş0.2011***şşş
Bimodal high
ş0.0593***şş
ş0.1693*şş
ş0.2918***şşş
0.0952
ş0.1311*şş
Southwestern highlands
ş0.0203***şşş
ş0.0973ş0.1264***şşş
0.2027
ş0.0631
Eastern highlands
0.1093+++
0.1680
ş0.1132**şşş
0.0149
0.3269*+
Market access (low/high)
ş0.0011
ş0.0749
ş0.2256***şşş
ş0.1566**şşş
0.0856
Population density (low/high)
0.0161+++
0.0945*+++
0.0703*
0.0603
0.0814
Altitude (meters above sea level)
0.0001**+++
0.0001
0.0001
0.0001
ş0.0001
Population growth rate (percent)
ş0.0008
0.0035
ş0.0013
ş0.0033
ş0.0092ş
(sqrt) Average distance from all parcels to all-weather road (kilometers)
ş0.0050
ş0.0329
0.0065
ş0.0108
ş0.0206
(sqrt) Average distance from all parcels to market (kilometers)
0.0079
0.0656**++
0.0272*+
ş0.0136
0.0247
(sqrt) Average distance from all parcels to residence (kilometers)
0.0056
ş0.0277
0.0198
0.0029
0.0253
Education level of household head (cf. none)
Some primary or completed primary
0.0042
ş0.3003***şşş
0.0266
ş0.0347
ş0.2702***şşş
More than primary up to O-levels
0.0414
ş0.1617**şşş
0.0694
ş0.0058
ş0.0943
Beyond O-levels
0.0915
ş0.1422şşş
0.3168**++
0.0819
ş0.0374
Female household head
0.1686***++
ş0.0806
ş0.0391
ş0.0881
0.0878
(ln) Age of household head
ş0.0169
ş0.1498şş
0.0378
0.0604
ş0.2690***şş
Household head born in village
0.0000
0.1071**++
0.0120
ş0.0541
ş0.0997**şş
(continued )
Table 11.8 (continued)
Inorganic fertilizer
Pesticides
Crop residues
Mulching
Animal manure
(sqrt) Number of men in household
0.0132+
0.0431
0.1336***+++
ş0.0027
0.1259***+++
(sqrt) Number of women in household
0.0188**++
ş0.0247
ş0.0742**şş
ş0.0486
0.0351
Estimated acreage in 2000
ş0.0018**ş
0.0025
0.0007
0.0009**
ş0.0059**
(sqrt) Number of bulls in 2000
0.0139*++
0.0179
ş0.0126
0.0898
ş0.0179
(sqrt) Number of cows/heifers in 2000
ş0.0022
ş0.0351
0.0083
ş0.0266++
0.0343+
Owned radio in 2000
0.00830.0169
ş0.0062
0.0529
0.0764*
Owned bicycle in 2000
ş0.0100
0.0272
ş0.0178
0.0920**++
ş0.0337
Formal credit available in village in 2000
ş0.0027
0.1738
ş0.0872
ş0.1522
ş0.2258**şş
Informal credit available in village in 2000
ş0.0137
0.1362
ş0.0115
ş0.1049
ş0.2848***şşş
Contact with extension in 2000
0.0692***+++
0.1373**+++
ş0.04930.0884**+++
0.1263**++
Tenure status of primary parcel (cf. freehold)
Leasehold
ş0.0142ş
ş0.1574
0.0721
0.1734
ş0.0079
Mailo
ş0.0007
0.0946
0.1992***++
0.2037**++
0.1058+
Customary
ş0.0324**şş
0.0006
0.0514
ş0.0041
ş0.0313
Only secondary source of income resource dependent, 1990 (cf. income not resource dependent)
ş0.0138
ş0.1245ş
0.0724
0.0499
0.0288
Only primary source of income resource dependent, 1990
ş0.0065
ş0.0707
0.0722
0.0994+
0.0486
Both primary and secondary source of income resource dependent, 1990
ş0.0314***şş
ş0.1265*
ş0.0332
0.0622
0.0162
Number of observations
445
445
445
445
445
Mean of dependent variable
10.0
23.8
17.6
20.4
23.0
Mean predicted probability of adoption
1.317.5
11.5
11.4
14.2
Pseudo-R2
0.4434
0.2357
0.2492
0.3009
0.2975
Note: Reported coefficients represent the effect of a unit change in explanatory variable on probability of a program or organization being present at the mean of the data. Coefficients are adjusted
for sampling weights and stratification and are robust to heteroskedasticity. Intercept is not reported.
*, **, *** mean coefficient statistically significant at 10 percent, 5 percent, and 1 percent levels, respectively; +,++,+++ and ş, ş ş, ş ş ş denote level of positive or negative significance when predicted
probabilities of programs and organizations are used in regressions.
PROGRAMS AND ORGANIZATIONS IN UGANDA
303
With respect to the other determinants of adoption of various land manage-
ment technologies, we had somewhat mixed results among our five regressions. In
general, we found that households with higher numbers of male members were more
likely to adopt organic technologies such as manuring and crop residues. Female-
headed households and households with more women were more likely to adopt
inorganic fertilizer. Households with more cattle, bulls, and bicycles were more
likely to adopt some technologies (inorganic fertilizer, manuring, and mulching),
which supports our hypothesis that wealthier households will be more likely to
invest in land management technologies characterized by medium- to long-term
returns, such as manuring and mulching. We also find that households with exten-
sion contact are more likely to adopt inorganic fertilizer, manuring, mulching, and
pesticides. Education of household head and age of household head have varying
effects on technology adoption. Households with older heads were less likely to use
animal manure. Access to both formal and informal credit was negatively associated
with adoption of animal manure in 2000. Households with resource-dependent
primary and secondary income sources were less likely to use inorganic fertilizer
and pesticides.
Better market access is associated with less use of some organic practices such
as incorporating crop residues and mulching, possibly because of higher labor oppor-
tunity costs or higher demand for such organic materials in places of better access.
Higher population density is associated with greater likelihood of using crop
residues and pesticides, and smaller land area owned is also associated with more
fertilizer and manure use. These findings support the Boserupian hypothesis of
population-induced intensification (Boserup 1965).18
Conclusions and Policy Implications
Government devolution of infrastructure and services is taking place in Uganda.
Of particular relevance to the Plan for the Modernization of Agriculture is the role
that NGOs and CBOs will play in fulfilling roles traditionally filled by govern-
ment programs. Our analysis of programs and organizations functioning at the
community level indicates that during the 1990s government programs were better
distributed throughout Uganda than NGOs and CBOs and that, in general, gov-
ernment programs focused on poorer communities. As devolution takes place, it is
worth considering how these roles will be fulfilled by NGOs and CBOs. Providing
incentives for NGOs and CBOs to locate in less-favored areas may ensure that
these communities do not experience negative effects as a result of devolution. This
is particularly important to the delivery of land management technologies to small-
holders as the Government of Uganda moves toward demand-driven fee-for-service
304
PAMELA JAGGER AND JOHN PENDER
extension. The ability of communities or individual households to identify exten-
sion needs and request services will be influenced by access to information on tech-
nologies and options available to smallholders.
With respect to household-level involvement in programs and organizations,
we found relatively high levels of involvement in credit and community serviceş
oriented NGOs and CBOs. Fewer households were involved in organizations
focused on agriculture and the environment. We found that female-headed house-
holds and households with high numbers of women were more likely to be in-
volved in organizations. Strong female involvement in organizations is encouraging
news, and this may have implications for the adoption of land management tech-
nologies. If women are able to influence household-level decisionmaking regarding
the adoption of land management technologies, then higher proportions of women
involved in organizations may have positive implications for technology adoption.
Recall that female-headed households and households with higher numbers of
women were more likely to use inorganic fertilizer. However, it may be the case
that women prioritize education, health, and/or basic needs ahead of land manage-
ment. Our data indicate that high proportions of women are involved in commu-
nity serviceşfocused organizations that generally do not deal with land management
issues. Further investigation into household-level decisionmaking regarding tech-
nology adoption is required.
With respect to social capital and household involvement in organizations, we
found that households where the head belonged to a dominant ethnic group were
in some cases more likely to be involved in organizations (for example, Acholi and
Langi in the north and Banyankore and other dominant groups in the southwestern
highlands). Also, having the spouse born in the village increased the likelihood of
involvement in organizations focusing on the indirect cause of land degradation.
These findings indicate the importance of social capital in organizational involve-
ment and suggest that households with weak social capital may be excluded from
participation. With respect to assets, we found that households with smaller land-
holdings were more likely to be involved in infrastructure- or credit-focused pro-
grams and organizations and more likely to use inorganic fertilizer and manure,
indicating that they are farming more intensively. Households facing tighter land
constraints may be participating in organizations as a way of learning about or
becoming involved in both farm and off-farm opportunities.
The results of our econometric analysis of the determinants of adoption of
land management technologies indicate that the presence of an agriculture- or
environment-focused program or organization at the community level had a nega-
tive effect on the adoption of animal manuring and a positive affect on the adoption
PROGRAMS AND ORGANIZATIONS IN UGANDA
305
of pesticides. This suggests that spillover effects of programs and organizations may
be greater for technologies that have short-term benefits and that require some
degree of coordination to be most effective. For example, technologies such as pest
management are most effective when a group of households with contiguous crop-
ping fields use them (Knox, Meinzen-Dick, and Hazell 2002). Household-level
involvement in an agriculture- or environment-focused organization had a positive
effect on the adoption of inorganic fertilizer and manuring. Adoption of labor-
intensive land management technologies such as manuring that yield longer-term
benefits apparently do not spill over to nonparticipants in local programs and orga-
nizations. Thus, direct involvement of households in programs and organizations
that promote such technologies may be necessary to ensure technology diffusion
throughout communities.
This information may be taken as an indicator of the effectiveness or influence
of agriculture- and environment-focused organizations in Uganda and should be
considered in the broader context of the government devolution of services to
NGOs and CBOs. Further analysis of additional technologies is required to deter-
mine whether or not agriculture- and environment-related programs are positively
affecting land management in Uganda. One possible explanation for our weak
results regarding the effect of these programs and organizations on the adop-
tion of land management technologies is that smallholders may be receiving training
on land management but not actually adopting the technologies. If this is the case,
there is a need to evaluate the role and effectiveness of these organizations. There is
evidence of limited profitability of many land management technologies in Uganda.
Analysis of the productivity effects of land management technologies including the
use of inorganic fertilizer, manuring, improved fallows, and others indicates limited
benefits to adopting these technologies in the short run (Nkonya et al. 2004). This
emphasizes the importance of identifying profitable technologies or applying tech-
nologies to more profitable crops.
Notes
1. Growth rates can be compared with real average annual rates of growth of 4 percent for
agriculture and 8 percent for manufacturing in the late 1960s and early 1970s (Belshaw, Lawrence,
and Hubbard 1999).
2. The original sampling frame excluded most of northern Uganda. Community-, village-,
household-, and plot-level surveys have since been conducted in this region.
3. Because of security threats in the western part of the country during the time of the sur-
vey, some LC1s drawn in the random sample were dropped.
4. As with the community data, we encountered some households that reportedly had no
involvement in organizations (20 percent).
306
PAMELA JAGGER AND JOHN PENDER
5. In our sample of 107 LC1s, approximately 21 percent of communities did not report hav-
ing any programs or organizations between 1990 and 1999. This finding might be a result of mis-
communication during the administration of the questionnaire.
6. We use indicators of general welfare, access to infrastructure and services, and so on in
1990 as a benchmark. By examining the programs and organizations present in communities between
1990 and 1999, we are able to determine how factors in 1990 have contributed to the presence of
programs and organizations.
7. We have estimated the proportion of households in the community with each of the welfare,
wealth, and education indicators by adding or subtracting 10 percent for minor increases or decreases
since 1990, and 25 percent for major increases or decreases since 1990 from 1999 proportions.
8. Regressions were checked for multicollinearity using variance inflation factor (VIF). The
maximum VIF of any of our explanatory variables was 3.63, indicating that multicollinearity is not
a serious problem in our models (Mukherjee, White, and Wuyts 1998). We take the natural log or
square root of our explanatory variables when the variable is more normally distributed in this alter-
native functional form. Doing so generally improved the specification of our model (Mukherjee,
White, and Wuyts 1998).
9. Social capital refers to features of social organization such as networks, norms, and social
trust that facilitate coordination and cooperation for mutual benefit (Putnam 1995). In our model,
religion and ethnicity of the household head are proxy indicators of social capital, whereas our indi-
cators of physical and human capital are direct indicators.
10. Land owned or operated by the household in 1990 was estimated by calculating the total
area of land acquired before 1990.
11. Our regressions were based on all households in our survey (not only those in communities
reporting the presence of programs and organizations) because we found that households reported
involvement in a wider range of organizations at the household level than was indicated in the com-
munity survey. We ran a second set of regressions including only those households with a program
or organization present in their LC1 (in keeping with our conceptual framework as presented in
Figure 11.1) and found similar results.
12. These regressions were also checked for multicollinearity using variance inflation factor
(VIF). The maximum VIF of any of our explanatory variables was 8.83, indicating that multi-
collinearity is not a major problem in our models (Mukherjee, White, and Wuyts 1998).
13. To control for endogenous program and organization presence and participation, regres-
sions were run with both actual and predicted probabilities of program or organization presence/
involvement. The robustness of the results to use of predicted probabilities is reported in the results.
14. Regressions using actual and predicted values were checked for multicollinearity using
variance inflation factor (VIF). The maximum VIF of any of our explanatory variables was 8.05,
indicating that multicollinearity is not a major problem in our models.
15. We also considered a model that examined type of program or organization (i.e., govern-
ment program, NGO, or CBO) rather than main focus of program. Of the five technologies con-
sidered, only NGO presence at the community level was found to positively influence the adoption
of using animal manure on fields and was only weakly significant (P < 0.10).
16. We considered an alternate model specification that excluded variables indicating house-
hold involvement in various types of programs and organizations. The specification yielded similar
results to those presented in Table 11.8, although the presence of an agriculture or environment
program or organization at the community level was no longer significant for the regression exam-
ining explanators of household-level animal manure technology adoption. Because of the additional
PROGRAMS AND ORGANIZATIONS IN UGANDA
307
information gained from including household level involvement in various types of organizations
and the significance of these variables in several of our models, we have included both community
presence of and household involvement in programs and organizations of various types.
17. Nkonya et al. investigate some of these impacts in Chapter 7 in this volume.
18. We considered the differential impact of programs and organizations by running a series
of probit models for the lowland and highland subsamples. The presence of an agriculture- or
environment-focused program or organization in the community was more likely to affect the
adoption of pesticide use in lowland areas. In highland areas, the use of inorganic fertilizers and
pesticides was negatively associated with the presence of other types of programs and organizations
in the community. Household involvement in agriculture- or environment-focused programs and
organizations was associated with adoption of pesticides in lowland areas and animal manuring in
highland areas. Household involvement in other types of programs and organizations was positively
associated with the adoption of pesticides and crop residues in lowland areas.
C h a p t e r 1 2
Zero Tillage or Reduced Tillage:
The Key to Intensification of the
CropşLivestock System in Ethiopia
Jens B. Aune, Rahel Asrat, Dereje Asefa Teklehaimanot,
and Balesh Tulema Bune
Numerous methods are available for increasing crop and livestock production
in the Ethiopian highlands. Both national and international research insti-
tutes have developed technologies that are technically appropriate for these
conditions. Examples of such technologies are the broad-bed maker for vertisols
and cow traction (Zerbini, Woldu, and Shapiro 1999) and use of a single ox to pull
the plow (Ouwerkerk 1990). However, farmers' adoption of these technologies
has been very limited, and farming is still characterized in most areas by low input
use and limited use of improved technologies. Fertilizer application has increased
in recent years because improved crop production packages have been introduced
through the Ethiopian extension service. Fertilizer has been easy to introduce be-
cause it does not require fundamental changes in the farming system. These pack-
ages have been accompanied by supply of credit. However, introducing these
packages to farmers has not been without problems, particularly in dryland areas
where crop failures are common. Farmers are often forced to sell animals to repay
their debt. Despite these problems, it must be recognized that fertilizers do have an
important role to play if farming in Ethiopia is to progress.
We believe that increased emphasis should be given to integrated approaches
for agricultural development. There is a need to develop technologies and manage-
ment schemes that can simultaneously enhance production, preserve the natural
resource base, and reduce poverty. Different technological options have different
310
JENS B. AUNE ET AL.
effects. A pure fertilizer-based approach cannot address the problems of the poorer
households and solve the problem of soil erosion, and a focus only on indigenous
knowledge and low input use cannot generate sufficient growth. The cropşlivestock
system in Ethiopia is highly complex, with strong interlinkages between the crop
and livestock components. These interlinkages are related to manure production,
traction power, fodder production, and income generation. This makes it impos-
sible to change one component of the system without affecting the others. More
fundamental changes toward more productive cropşlivestock systems therefore
require an integrated and holistic approach. This chapter discusses the problems
of the current cropşlivestock system and suggests an alternative pathway for the
cropşlivestock system to enhance productivity and safeguard the environment.
Composition of the Livestock System in Ethiopia and
Productivity Effects
The livestock production system in Ethiopia has low productivity. A survey in
Tigray showed that average daily milk production in 8 woredas (administrative
unit) per cow was 1.2 liters, and the average calving interval 27 months (Berhane
1996). Average productivity per animal slaughtered in Ethiopia is estimated to
be 110 kilograms of meat and 213 kilograms of milk, and annual per caput con-
sumption of milk and meat is estimated at 16 and 10 kilograms, respectively (Sut-
tie 2000). In Kenya, by contrast, per caput milk production is 85 kilograms per
year. This classifies Ethiopia as having the lowest per capita consumption of meat
and milk, even among neighboring countries, although it has Africa's largest national
herd (Bebe, Udo, and Thorpe 2002). We believe that one of the fundamental
causes for the low productivity of the livestock system is the composition of the
livestock herd. Studies of the livestock composition in different parts of Ethiopia
show that there are often more oxen than cows (Aune et al. 2001). The composi-
tion of the livestock is a reflection of the production objectives of the livestock sys-
tem (Ketelaars 1991), and for Ethiopia the dominance of oxen in the livestock
system indicates that the primary output from the livestock system is traction
power. The trend across different regions of Ethiopia is that farmers tend to retain
oxen instead of cows when reducing the number of livestock (Aune et al. 2001).
A survey in the Amhara region showed that the number of households owning
oxen declined by 19 percent from 1991 to 1999, whereas the number of house-
holds owning cows declined by 35 percent during the same period (Jabbar and
Ayele 2002). This shows an "oxenification" of the livestock system in Ethiopia.
Cows are mainly used for reproduction purposes and to get some milk production
in part of the year.
ZERO TILLAGE OR REDUCED TILLAGE
311
Several studies indicate that the composition of the herd in Ethiopia negatively
affects the productivity of the cropşlivestock system. A large survey in Tigray showed
that the return to investment in livestock was 16 percent on average, whereas for
cows it was 36 percent (Pender, Gebremedhin, and Haile 2002). Results from a
cropşlivestock model based on data from northern Gonder indicate that replacing
oxen with milk-producing goats increases the profitability of the cropşlivestock
system (Ayele and Aune 2001).
This dominance of oxen in the current livestock system makes it difficult to
introduce improved fodder management schemes because of lack of economic
returns from oxen. A change in the composition of the livestock population will not
occur unless the tillage system is modified because without oxen the land cannot be
cultivated. If zero tillage or reduced tillage were introduced, farmers would have
much less need to keep oxen for traction purposes. Replacing oxen with animals
for meat and milk production may increase the overall productivity of the system.
Alternatives to Ox Tillage
Ox plowing in Ethiopia dates back to before 1000 B.C. The reasons for its wide-
spread use in Ethiopia are cereal cultivation and particularly the cultivation of teff,
which requires up to six passes with the maresha (the Ethiopian plow) and absence
of the tse tse fly (causing tripanosomiasis) in the highland areas (Aune et al. 2001).
However, this ox-plowing system that was appropriate in the past may not be the
ideal system in the current situation characterized by smaller farm size and shrink-
ing fodder resources as a result of rangeland degradation. A survey in the Amhara
region confirms that farmers think that fodder resources are becoming increasingly
scarce (Benin, Ehui, and Pender 2002; Chapter 6). Ox rental and sharecropping have
also become more costly and more favorable to the ox owner. In northern Ethiopia
increased use of half share of crop production to landowner and half share to
tenant/ox owner has increased over the previous arrangement characterized by two-
thirds to landowner and one-third to tenant/ox owner (Benin et al. 2005). Particu-
larly female-headed households are in a weak position because it is culturally un-
acceptable for female farmers to plow with oxen in the Ethiopian highlands. Zero
tillage is therefore particularly appealing for female-headed households.
Despite these constraints with the ox-plowing system, it remains the domi-
nant tillage system. The alternative tillage systems that are being tested are reduced
tillage and zero tillage. Reduced tillage is characterized by one pass with the mare-
sha rather than the three to six passes in the conventional system. Zero tillage is
without any plowing, and mulch application, herbicides, or manual weeding is used
to control weeds. Studies by Sasakawa Global 2000 (an NGO), the Combating
312
JENS B. AUNE ET AL.
Table 12.1 Effect of tillage system on maize yields, 1999 and 2000
1999
2000
Tillage system
(213)
(210)
Average
Conventional
4,944
4,387
4,670
Reduced
5,706
4,876
5,290
Level of significance
P < 0.05
P < 0.05
P < 0.05
Note: Number of participating farmers in parentheses.
Nutrient Depletion (CND) project, and a survey in Tigray (Pender, Gebremedhin,
and Haile 2002; Chapter 5) illustrate that crop productivity can be increased by
developing alternatives to the ox-plowing system. Promising results have so far
been achieved with both maize and teff. However, the primary reason for introduc-
ing zero tillage or reduced tillage is not increased crop productivity but rather the
possibility of replacing oxen with meat- or milk-producing animals.
Results from reduced tillage demonstration plots of Sasakawa Global 2000 in
farmers' fields in 1999 and 2000, using herbicides to control weeds, show that yields
are higher under reduced than under conventional tillage (Table 12.1). Average
maize yield for the two years, based on 423 demonstration plots in the Oromia and
Amhara regions, was 620 kilograms/hectare (Table 12.1) higher under reduced than
under conventional tillage (Asrat 2002). Labor demand per hectare was 78 days
lower under reduced tillage because of the savings on plowing and weeding. Cash
expenditures are 550 birr/hectare higher under reduced tillage because of herbicide
costs. However, if farmers would have to pay the labor cost for weeding and ox
rental, cash expenditures would be 235 birr/hectare higher under conventional
tillage. These estimates are based on the average wage rate in the area and labor
demands in the two cultivation methods according to farmers' assessments. Herbi-
cides were given freely to farmers in 1999 and 2000, and only 10 percent of the
farmers continued to use reduced tillage when they had to pay for the inputs in
2001. The reasons given for this discontinuation were the high price of herbicides
and the low price of maize. Other reasons are that farmers in these areas normally
have access to a pair of oxen and low opportunity cost of labor. The value of the
additional yield under reduced tillage is estimated at 248 birr/hectare based on a
maize price of 0.4 birr/kilogram. Hence, it is not economically attractive for farmers
to use reduced tillage if the saved labor has a low opportunity cost. At a maize price
of 1 birr/kilogram, as in 1998ş99 (Asrat 2002), the increased yield could pay for
the herbicide costs. This underscores that an important factor demotivating the
farmers to use reduced tillage is the low maize price. It will become even more
attractive for farmers to turn to reduced tillage if they replace the oxen by animals
ZERO TILLAGE OR REDUCED TILLAGE
313
for meat and milk production. Results from a survey in Tigray showed that re-
duced tillage is associated with 57 percent higher crop productivity than conven-
tional tillage, controlling for labor and other input use, confirming that benefits
from reduced tillage are likely (Pender, Gebremedhin, and Haile 2002; see also
Chapter 5).
Experiments in the CND project in Gare Arere close to Ginchi in the central
highlands show that zero tillage is also possible in teff (unpublished results). In this
crop, up to six passes with the maresha are practiced. Results from 2001 showed
that the average yield on a vertisol was 1,486 kg/hectare under zero tillage, com-
pared to 1,424 under conventional tillage. Corresponding figures for a nitisol were
561 and 470 kg/hectare. No herbicides were used in these experiments, and weed-
ing was done manually. The weed infestation did not differ significantly between
the tillage methods. This indicates that annual application of herbicides might not
be needed under some conditions or every year, and this can reduce the cost and
risks of practicing zero tillage considerably.
Experiments across 10 years in Kulumsa, Ethiopia, also showed that zero
tillage or reduced tillage is feasible in wheat (Taa, Tanner, and Bennie 2004).
Wheat yield in zero tillage and reduced tillage were respectively 94 and 96 percent
of wheat yield in conventional tillage.
Another benefit for farmers without oxen is that they can retain the entire pro-
duction. Currently, they may have to pay about 50 percent of the yield for plow-
ing, and the ox owner will, in addition, take the straw. This leaves farmers without
oxen with very limited benefits. Moreover, they are in a weak bargaining position,
without alternatives to ox plowing. Experience has shown that where alternatives to
ox plowing exist, the cost of ox rental is lower (Aune et al. 2001). Zero tillage or
reduced tillage offers such alternatives.
Oxen receive the best quality fodder before and during the plowing season.
In Tigray, 68 percent of crop residues are fed to oxen (UNECA 1997). Hence,
considerable scope for increasing livestock production exists if the scarce fodder
resources could be used for milk and meat production rather than for traction pur-
poses. It has been shown in Kenya that development of an intensive milk produc-
tion system is feasible, even among smallholder farmers, with considerable increases
in farmers' income (Bebe, Udo, and Thorpe 2002).
Zero tillage or reduced tillage will, in addition, contribute to reducing envi-
ronmental problems, both locally and globally. Zero tillage can be as efficient as
other soil and water conservation methods in controlling erosion, as shown in
Nigeria (Lal 1984). Erosion rates in Ethiopia are currently alarmingly high in
many areas because of the hilly nature of the terrain, and measures are necessary to
halt the degradation of Ethiopian soil resources. Agricultural practices that mimic
314
JENS B. AUNE ET AL.
"mother nature" are the best practices from an environmental point of view. Con-
tinuous soil cover and an undisturbed surface layer with a high degree of recycling
of plant nutrients characterize such production systems. The zero tillage system is
an example of such a production system, as the soil surface remains undisturbed.
Zero tillage or reduced tillage will also have a positive environmental effect globally
by sequestering carbon. Zero tillage sequesters carbon because there is a lower
decomposition rate of soil organic matter under zero tillage (Young 1997) and be-
cause zero tillage is associated with more recycling of organic matter. Higher carbon
content of the soil is also associated with higher crop productivity in the tropics
(Aune and Lal 1996). Increased humus content of the soil improves the water-
holding capacity of the soil and improves soil surface characteristics (Pieri 1989).
Fodder Availability
A change in the composition of the livestock population should be combined with
improved access to fodder of good quality and improved veterinary services. Im-
proved breeds may in addition improve productivity. Several options are available
for increasing the quality of fodder in Ethiopia. These include improved pasture
management, growing of fodder crops and trees, and upgrading straw quality. A
well-documented method for quality improvement of straw is treatment with urea
(Suttie 2000). This method, widely used in China, is practiced in Ethiopia to only
a limited extent. An economic assessment of the urea treatment technology in
Ethiopia, using a cropşlivestock model, has shown that each birr invested in urea
treatment of straw yields a return of 5 birr when straw is fed to milk-producing
goats (Ayele and Aune 2001). This is a particularly interesting option for Ethiopia,
as straw is one of the major fodder resources in the highland areas ( Jabbar and
Ayele 2002). The importance of straw will probably increase in the future, as crop-
land is expanding at the expense of pastureland. The limited use of urea-treated
straw in Ethiopia could be related to the composition of the livestock population
because feeding urea-treated straw to oxen is expected to give very limited returns.
Studies from India show that the adoption of urea treatment of straw depends on
such factors as animal response, the price ratio between milk and urea, labor costs,
access to water, availability of straw, and access and price of other fodder resources
(Singh et al. 1993). This indicates that urea treatment of straw is most likely to
develop in the vicinity of major markets.
Another low-cost method to increase straw quality without compromising
grain yield is to harvest the grain at physiological maturity (30 to 40 percent grain
moisture content) instead of at 10 to 13 percent, as normally is the case. Early
maize harvest was shown to be associated with higher crude protein content and
ZERO TILLAGE OR REDUCED TILLAGE
315
digestibility of straw in a study from southern Ethiopia (Tolera and Sundst°l 1999).
Hay harvesting, widely practiced in Europe in former times, is another low-cost
method for producing quality fodder.
Common and private grazing lands have been substantially reduced in the
Amhara and Oromia regions, mainly because the area under cultivation has increased
(Jabbar and Ayele 2002). Moreover, farmers are of the opinion that the produc-
tivity of the pastures has declined.
Better management of common grazing land can greatly contribute to increas-
ing the quantity and quality of fodder. Establishment of area enclosures is a man-
agement practice that has proven successful in Ethiopia and particularly in Tigray.
An area enclosure can be defined as an area that, for a given time period, is pro-
tected from grazing and human activities to allow regeneration of the vegetation. A
study in Tigray has shown considerable benefits from area enclosures (Asefa 2001).
Estimates based on counting bundles of grass from three different area enclosures
showed that 3,200 kilograms of high-quality grass can be harvested per hectare
from an area enclosure. A cow of 250 kilograms will need about 2,200 kilograms
of dry matter per year. The grass can also be sold at the local market. The value of
grass harvested from an area enclosure is about 1,850 birr/hectare. Surprisingly,
this is equal to the average value of crop production in Tigray (Pender et al. 2002;
Chapter 5). The costs of establishing and surveillance of the area enclosures are
moderate. Demarcation costs of the area enclosures are about 186 birr/hectare of
land. Each household spends about 5 birr/year for guarding the land. Establishing
stone terraces within the area enclosures is estimated at 1,018 birr/hectare, assum-
ing a wage rate of 7 birr/day, 800 meter long terraces per hectare, and one man
building on average 5.5 m of terrace per day (Asefa 2001). Additional benefits of
the area enclosures are increased biodiversity, less soil erosion, more continuous
water discharge from the land, and increased honey production as a result of in-
creased vegetation cover and more flowers. A survey in three villages has shown that
73 percent of the farmers in the area are in favor of establishing new area enclosures
on their farms, whereas the other 27 percent objected. Those who responded neg-
atively particularly mentioned reduced grazing land when new area enclosures
would be established. Establishment of area enclosures will increase the pressure
on adjacent grazing land. This may increase degradation of this area, but experience
from Ethiopia (Asefa et al. 2003) and Tanzania (Sianga 1995) has shown that graz-
ing land normally has a high degree of resilience, implying that the vegetation will
soon recover if the grazing pressure is removed. More long-term negative effects are
therefore not expected. Establishment of area enclosures has been found to be most
beneficial in areas with intermediate population pressure (Gebremedhin, Pender,
and Tesfay 2004; Chapter 10).
316
JENS B. AUNE ET AL.
The area enclosures can alternatively be used for tree plantations, albeit at the
expense of grass production. The value of grass production in an area dominated
by trees was calculated at about 700 birr per hectare. Wood production from an
area enclosure is estimated at about 250 m3/hectare. A cubic meter of wood is sold
for about 50 birr, which is equivalent to a value of about 12,400 birr 10 years after
the establishment of the area enclosure. A study in the Central Ethiopian highland
confirms that households can increase their income substantially by planting euca-
lyptus on land not suitable for crop production (Holden and Shiferaw 2002). Grass
production will be reduced as the tree canopy develops.
Policy Implications
Crop and livestock production are closely integrated in Ethiopia; hence, changes
in one component directly affect the other components of the system. We believe
that adoption of the zero tillage or reduced tillage system could trigger a change
in the cropşlivestock system in Ethiopia. Development of zero tillage or reduced
tillage is most likely to take place in areas with good market access. Evidence of this
is that improved forage production in Holetta area in central Ethiopia was more
widespread by farmers with dairy crossbred cows (Gebremedhin, Ahmed, and Ehui
2003). It will be impossible for most farmers to provide good quality fodder both
for dairy cows and for oxen used for plowing. Development of dairy production
is therefore incompatible with the traditional ox-plowing system. The traditional
subsistence agricultural system including use of ox plowing is likely to prevail in
areas with limited market access.
Currently the number of oxen is increasing relative to that of cows, and in many
regions the number of oxen exceeds that of cows. This composition of the livestock
system cannot pay for improved management of fodder resources. Hence, in areas
with good markets for milk and meat production, there is an option to change the
composition of the livestock accordingly. Development of zero tillage or reduced
tillage without accompanying technologies does not suffice. Intensification of crop
production will also be of benefit to livestock production. Increased straw yield as
a result of crop intensification can be used as a basis for improving livestock pro-
duction. In order to intensify crop and livestock production, there is a need to
develop more site-specific fertilizer recommendations, identify crop varieties and live-
stock breeds that can profit from increased use of inputs, better veterinary services,
appropriate residue management and hay cutting, and improved management of
grazing land. However, such fundamental changes in the Ethiopian agricultural
production system can take place only when backed by favorable economic policies
ZERO TILLAGE OR REDUCED TILLAGE
317
and an effective extension service. This implies a more market-oriented approach of
the farming systems in the Ethiopian highlands.
The policies that can trigger such a change in the agricultural system are favor-
able price policies for outputs and inputs and strengthening local institutions,
particularly in the field of management of natural resources and purchase and sale
of agricultural produce. Furthermore, emphasis should be given to the develop-
ment of an adequate infrastructure, development of local credit institutions, and
strengthening research and extension programs. It is particularly important that
the government ensure a favorable relationship between grain prices and prices
of inputs. This can partly be achieved by regulating import of grain and by encour-
aging and facilitating donors and NGOs to purchase locally produced grains in
disaster situations. Such developments may be encouraged through use of cross-
compliance, meaning that access to vital inputs such as credit for fertilizer can be
made contingent on installing erosion control measures on eroded land, as pro-
posed by Shiferaw and Holden (2000). Even though results of a household model
have suggested favorable returns from such an approach, we believe higher returns
can be expected if access to credit for crop and livestock production is made con-
tingent on practice of zero tillage or reduced tillage and change in livestock produc-
tion objective toward milk and meat. Such a policy measure should be explored, as
that might also strongly reduce soil erosion and lead to increases in both crop and
livestock production. Zero tillage might also be a more lasting solution to soil erosion
control because the maintenance requirements for erosion control measures, such
as terraces and stone bunds, are considerable. This approach will also contribute to
sequestering soil carbon.
The economic factors that can change the cropşlivestock system toward the
use of zero tillage or reduced tillage are higher prices of cereals, meat, and milk
products and higher opportunity cost for labor. These prices are normally higher in
areas with good infrastructure or in the vicinity of urban centers. Prices of agricul-
tural inputs will also be lower in such areas, and access to credit more easily avail-
able. Hence, it will be easiest to introduce zero tillage or reduced tillage in areas with
good access to markets, and in an early phase of development of a new cropşlivestock
system, emphasis should be given to such areas. Zero tillage is now rapidly expand-
ing in Latin America, where it is used on more than 14 million hectares (Derpch
1998).
The research and extension system should particularly focus on the development
of an appropriate zero tillage or reduced tillage system and on upgrading the quality
of straw. These can mutually support each other, thus contributing to the develop-
ment of more sustainable crop production systems in the highlands of Ethiopia.
318
JENS B. AUNE ET AL.
The suggestions above for policy changes are very much in line with the five
Is that IFPRI has identified as factors that promote agricultural growth (Hazell
1999): innovations, infrastructure, inputs, institutions, and incentives. The UN
Task Force on Hunger also emphasized improved soil fertility management and
diversification of agricultural production with high-value products as key compo-
nents to increased agricultural productivity for food-insecure farmers (Sanchez
et al. 2005).
There is now a possibility through the Clean Development Mechanism under
the Kyoto agreement for transfer of funds from OECD countries to developing
countries as payment for carbon credits. Governments and community organi-
zations can finance environmental rehabilitation activities and poverty reduction
programs through agreements with industries in the North that need to buy quotas
for CO emissions. Such arrangements may, in the future, increase farmers' inter-
2
ests in establishment of area enclosures, if parts of the payment for the carbon
credits are transferred to the rural communities. It might be possible, therefore,
that carbon sequestration projects could finance land rehabilitation in Ethiopia.
This is an option to explore in the future. The World Bank launched in 2002 the
Community Carbon Fund and the Biocarbon Fund to facilitate the establishment
of carbon sequestration projects. The objectives of these funds are to promote
small-scale projects that can sequester carbon and at the same time promote sus-
tainable development.
There is an increase in number of oxen to number of cows in Ethiopia, and
this development pathway is opposite to agricultural intensification. We have found
evidence that an alternative pathway may give increased food production while
safeguarding the environment. Such a pathway is characterized by zero tillage or
reduced tillage, milk and meat production, improved management of pastures
and stover, and improved soil fertility. Such a development can be favored by
appropriate price policies, access to credit, and a focus on these technologies in the
Ethiopian research and extension system.
C h a p t e r 1 3
Land Management Options in
Western Kenya and Eastern Uganda
Robert Delve and Joshua Ramisch
In the recent past, the image of agricultural and environmental crises in Sub-
Saharan Africa (SSA) has become increasingly common. Soil erosion and soil
fertility loss are considered to be negatively affecting the productive capacity of
the agricultural systems (Giller et al. 1997; Sanchez et al. 1997; Smaling, Nandwa,
and Janssen 1997). These problems have been ascribed to many different causes:
social (e.g., marginalization of the poor and women), political (e.g., structural adjust-
ment programs), economic (e.g., poor availability and/or high prices of inputs,
limited market opportunities), biological (e.g., increasing population and reducing
land sizes), and physical (e.g., climatic change).
Many authors also have expressed concern over the increasing land degrada-
tion in the highlands of East Africa (e.g., Getahun 1991; Farley 1995; Hilhorst
and Muchena 2000). Increases in agricultural production in the last decades have
been achieved through intensifying agricultural practices, such as increasing the
frequency of cultivation at the expense of natural fallows and through expanding
the cultivated areas, especially into fragile environments such as wetlands and steep
hillslopes, with negative consequences, including soil degradation from soil erosion
and loss of soil fertility.
Blaming smallholder farmers for this degradation is overly simplistic in the
least. Tropical smallholder agricultural production systems are, in fact, markedly
dynamic and resilient, and many examples exist of adaptations in production prac-
tices to cope with and adjust to changes (Brookfield and Padoch 1995; Farley
1995; Goldman 1995). Smallholder farmers use a wide range of agro-ecological
320
ROBERT DELVE AND JOSHUA RAMISCH
management techniques, resource management practices, and production strategies
specific to their ecological and social environment to minimize risk and to cope
with changes and shocks. These techniques can include agricultural intensifica-
tion, expanded market orientation, intensification of cropşlivestock enterprises, or
increased capital and labor investment. However, the natural resource base repre-
sents an important capital to small-scale farmers, which will be (over)exploited
where production constraints are too high, purchased inputs or labor are scarce or
absent, or environmental conditions are too erratically variable for secure invest-
ment. For example, if the returns to investments are too low (even negative, as
when staple commodity prices plummet during bumper harvests), periodically or
repeatedly mining the soil's nutrient capital resource to support minimal levels of
production can appear to smallholders as good economics.
Within this context, this chapter uses evidence from research and extension
efforts in eastern Uganda and western Kenya to investigate land management, land
use changes, and the policy environment within which smallholders have to oper-
ate and to assess their influences on smallholder farmers' production strategies. It
complements the discussion in Chapter 12 by Aune et al., which focused on land
management options being tested in the Ethiopian highlands.
Kenya and Uganda
Uganda is one of the low-income economies in SSA and is among the poorest
countries in the world (DANIDA 1996). Kenya is better off and has a higher gross
national income (GNI) (Atlas method) of US$340 than Uganda (US$280), but in
recent years, the GNI for Kenya has been decreasing at alarming rates (World Bank
2002b). Data for 1997, 2000, and 2001 show changes in GDP of 2.1, ş0.2, and
1.1 percent for Kenya and a negative growth forecast for 2002. In contrast, for the
same years, Uganda had GDP growth of 4.7, 3.5, and 4.6 percent, with projected
growth of over 5 percent for 2002 (World Bank 2002b). In Kenya, agricultural
productivity showed negative growth between 1990 and 1994, and throughout the
1990s growth in agricultural output was substantially lower than the population
growth rate of 3.4 percent. In both countries, poverty is most pronounced in rural
areas. The features of rural poverty are multidimensional and include food shortage,
malnutrition of children, frequent illness with high rates of HIV/AIDS, and wide-
spread illiteracy. The distribution of poverty is uneven, with areas in the east and
north of both countries being the poorest. In Uganda the proportion of the popu-
lation living below the poverty line has been declining in recent years, but house-
holds engaged in crop farming remain the largest group of the poverty-stricken
LAND MANAGEMENT IN WESTERN KENYA AND EASTERN UGANDA
321
population, accounting for about 80 percent of the households below the poverty
line (Appleton 1998).
Agriculture is the primary source of income for most Ugandans and Kenyans,
accounting for around 40ş50 percent of GDP, up to 90 percent of exports, and
employing approximately 80 percent of the labor force in both countries in 1996
(World Bank 2002b). On average, rural households derive nearly three-quarters
of their income from crop farming. Smallholders dominate the agricultural sector
with over 90 percent of crop production being produced on farms averaging less
than 2 hectares. However, smallholders in Uganda have difficulties obtaining credit
for investment and to improve farming techniques. Hence, improving credit access
and farmer extension are key recent interventions for boosting agricultural devel-
opment in Uganda (FAO 1998).
Both sides of the border have similar agro-ecosystems and cropping systems,
with eastern Uganda through to western Kenya representing a gradient with chang-
ing soil types, from the lowland ferralsols to highland nitisols in Uganda to humic
nitisols in western Kenya, with increasing agricultural production and increasing
population densities from west to east. This has resulted in a range of land use sys-
tems that respond to this gradient.
Eastern Uganda
The eastern Lake Victoria crescent, the southern-eastern Lake Kyoga basin, and
Jinja-Mbale Farmlands agro-ecological zones of Uganda comprise Tororo, Busia,
Bugiri, Pallisa, Kumi, Soroti, and Mbale Districts, with a population density aver-
aging 129ş456 persons per square kilometer (Wortmann and Eledu 1999). They
are poorly endowed with natural resources: the soils are sandy, with low soil organic
matter levels, highly susceptible to leaching, and consequently low in base satura-
tion and rather acidic. Agriculture in this region shows productivity decline, as the
rapidly growing population overexploits its land resources, resulting in recurrent
food shortages and occasional famines. The most serious problems faced by small-
holder farmers are related to the low land productivity that results in household
food deficiencies and to low selling prices for crop products in good seasons (i.e.,
seasons of bumper harvests).
Western Kenya
The densely populated Western Kenyan districts of Siaya, Vihiga, Kakamega, and
Busia share a similar agro-ecology to the Ugandan districts across their common
border. Population densities average around 400 people per square kilometer but
exceed 1,200 in Vihiga district. Political and economic marginalization of the region
322
ROBERT DELVE AND JOSHUA RAMISCH
has led to widespread rural poverty, resulting in massive outmigration of (especially
male) labor on a seasonal or permanent basis. (See Chapter 8 for more information
on economic conditions and farming systems in western Kenya). The soils of the
region include nitisols and ferralsols that are much more P-deficient than those
in Uganda.
Soil Fertility Status
In the 1950s and 1960s soil surveys revealed that about half the land surface in
Uganda was rated as medium productive, that is, soils giving good yields under good
management (Harrop 1970; Foster 1976, 1981). However, the export of nutrients
through runoff and soil erosion and as components of harvested crop products is
increasing for most of the farming systems, contributing to the negative nutrient
balances reported for Sub-Saharan Africa countries (Smaling, Nandwa, and Janssen
1997) and for the farming systems of eastern and central Uganda (Bekunda and
Woomer 1996; Wortmann and Kaizzi 1998; Kaizzi et al. 2002).
It is not possible to accurately assess the economic cost of this nutrient loss,
but from work in Ethiopia a conservative estimate of the annual costs of soil nutri-
ent depletion alone is $100 million (B÷jo and Cassells 1995). There is less in-
formation for the highlands of Uganda and Kenya, but from soil nutrient losses
reported elsewhere, the magnitude of the problem is comparable (Stoorvogel and
Smaling 1990; Braun et al. 1997).
A recent survey across Uganda showed that between 1960 and 2000, soil
organic matter (SOM) content did not decline significantly, and there were no
significant decreases in soil N levels. In contrast, levels of P, K, and Ca and soil pH
had declined significantly over the 40 years (Ssali 2003). This is a slightly unexpected
result, as typically SOM contents decline under cultivation with inappropriate
management, and as a result, the C:N ratio widens, indicating lower SOM quality
and lower nutrient-supplying capacity (Tiessen, Samprio, and Salcedo 2001).
However SOM is never fully exhausted under overcultivation; instead, it is reduced
to a lower equilibrium steady state (Buyanovsky and Wagner 1998; Belay, Claasens,
and Wehner 2002). To reach that steady state may take many years: starting from
virgin land, 10 years of cultivation may lead to a reduction of between 30 and 60
percent in the original SOM content. The level at which the steady state is attained
and its trend depend on the measures taken during the cultivation phase and the
effectiveness of fallow periods. It is likely that these soils already had reached a low
equilibrium level after many years of cultivation before the 1960s.
In traditional tropical farming systems, SOM lost from the topsoil under cul-
tivation was restored during extended fallows. The length of the fallow period would
LAND MANAGEMENT IN WESTERN KENYA AND EASTERN UGANDA
323
depend on the degree of land degradation and fallow management. However, in
most tropical areas, poor land management and increasing pressure on the land
rarely allow fallows to restore soil productivity. There is evidence that the rate of
SOM loss and hence land degradation during the cultivation phase can be reduced
through various management practices, including erosion prevention and minimum
tillage (Machado and Silva 2001; Nandwa 2001; Roose and Barthes 2001), strate-
gic use of organic and mineral inputs (Bationo and Buerkert 2001; Katyal, Rao,
and Reddy 2001; Nandwa 2001; Belay, Claasens, and Wehner 2002), and other
improved systems that exploit the benefits of fallows, biological nitrogen fixation
(BNF), rotations, intercropping, and agroforestry (Katyal, Rao, and Reddy 2001;
Nandwa 2001; Palm et al. 2001).
Replenishing soil N, P, and K is essential for sustaining productivity and reha-
bilitating eroded and nutrient-depleted soils. Soil fertility replenishment will result
in positive benefits, such as increased vegetative soil cover and increased soil bio-
logical activity associated with enhanced crop production (Sanchez et al. 1997).
Replenishment of N can be achieved through the use of either inorganic or organic
fertilizers and/or BNF. Organic and inorganic fertilizers can mitigate the losses of
P and K, and biological options may also improve the efficiency with which crops
use these nutrients.
Land Management Technologies
National agricultural research institutions in Uganda and Kenya, in collaboration
with international agricultural research centers, have developed an array of man-
agement practices and technologies that might effectively address local production
problems. These include fertilizer use recommendations, use of legume cover crops,
and biomass transfer options (from within or outside the farm) that improve soil
fertility and provide fodder.
Fertilizer Recommendations and Limiting Nutrients
Soil fertility characterization studies through limiting nutrient trials have been
conducted over many years in the region. Studies in the 1960s indicated profitable
responses to applied N and P fertilizers for much of eastern Uganda for cotton,
maize, groundnuts, and finger millet (Foster 1976). A recent study in Tororo
(Uganda), using maize as a test crop, found large responses to N alone and higher
responses to N and P combined (Waata, Jama, and Delve 2002). There was
no response to K. These results, confirming those of previous trials (Foster 1976),
indicate that N is the main limiting nutrient, followed by P, and that K should be
addressed after the N and P problems have been solved.
324
ROBERT DELVE AND JOSHUA RAMISCH
In Kenya, the Fertilizer Use Recommendation Project (FURP 1995) conducted
multisite fertilizer experiments from 1985 to the early 1990s and formulated rec-
ommendations for different regions and crops. Unfortunately, these recommen-
dations are not detailed enough to assist smallholder farmers in optimizing their
fertilizer use. Even if such recommendations were available, the profitability of fer-
tilizer use is highly variable and dependent on agro-climatic and economic con-
ditions at the local and regional levels (Vlek 1990). Access to fertilizers remains
inconsistent and problematic: high unit costs, irregular supply, low cost of com-
modity crops, and the unpredictable fertilizer quality contribute to the low use
of fertilizers by most socioeconomic groups (Heisey and Mwangi 1995; Swinkels
et al. 1997).
Legume Cover Crops
Legume cover crops (LCC) have been evaluated as a technology for improved land
and resource management, appropriate to smallholder farmers with restricted access
to inorganic fertilizers. Crotalaria species (Crotalaria ochroleuca and Crotalaria gra-
hamiana) have proven very successful in western Kenya in improved fallow prac-
tices. Delve and Jama (2002) reported large increases in maize grain yield following
sole crop Mucuna pruriens and Canavalia ensiformis. In contrasting soils and in
contrasting agro-ecological zones of eastern Uganda, Kaizzi, Ssali, and Vlek (2002)
also reported similar increases in maize yield following Mucuna fallows. However,
where Mucuna was grown in relay with a maize crop, reduced maize yields as a result
of competition for resources between the two crops have been reported (Fischler
1997; Kaizzi, Ssali, and Vlek 2002; Kuule 2002).
At average accumulation rates, green manure or LCC could entirely substitute
for inorganic fertilizer N at the current average application rate in low-input agricul-
ture systems (Becker, Ladha, and Ali 1995). Kaizzi (2002) showed that, in eastern
Uganda, because approximately 43 percent of the plant N in Mucuna is derived
from BNF, that BNF could contribute to the N requirements at moderate levels
of output under favorable conditions (Giller et al. 1997). However, the N fixed by
LCCs during the fallow period may not be a net addition to the system if increases
in the yield of subsequent crops remove more N than was added by the legume.
The excess applications of N in the LCC biomass above crop demand will be sub-
ject to losses (such as leaching or denitrification) during decomposition, especially
during the early stages of crop growth, when N demand is not synchronized with
release from decomposing LCC residues.
In eastern Uganda, results show that incorporation of legume cover crops in
situ implies excess supply of N and K that is not matched by plant demand (Fig.
13.1). For example, incorporation of 100 percent of the above-ground biomass
LAND MANAGEMENT IN WESTERN KENYA AND EASTERN UGANDA
325
Figure 13.1 Macronutrient balance for maize, grain, and stover production
following incorporation of 50 or 100 percent of the above-ground
biomass of a one-season sole crop fallow of Mucuna and Canavalia
Nutrient balance (kg Ě ha 1)
160
N
120
P
K
80
40
0
40
100%
100%
50%
50%
Control FP
Canavalia
Mucuna
Canavalia
Mucuna
Source: Delve and Jama (2002).
after a single season of improved fallow planted with Canavalia leads to a positive
nutrient balance of more than 120 kg/ha of N and 30 kg/ha of K. An improved fal-
low using Mucuna also leads to positive nutrient balances of N and K if all of the
biomass is incorporated. This is confirmed in another study carried out within the
same agro-ecological zone, where dry matter and N loss by Mucuna was over 90
percent within 175 days (Kaizzi 2002). Management of the fallow rotation then
becomes critical to maximize utilization of the resources, prevent nutrient losses,
and provide enough nutrients, especially N, to maintain crop yields. This can be
achieved, for example, through the use of deep-rooting species that can recover
nitrate leached deeper into the soil profile.
Alternatively, Delve and Jama (2002) found that incorporation of either 50
percent or 100 percent of the LCC biomass produced in situ resulted in yields of
maize grain and stover that were not significantly different from each other. This
finding offers farmers alternative options for managing this technology, such as
producing the biomass in one place, where half could be incorporated and the other
half applied on an equivalent area for maize production. Alternatively, farmers
might want to use 50 percent for incorporation and the remaining 50 percent for
livestock feed, sale to other farmers, or to produce hay. Increasing the resource
326
ROBERT DELVE AND JOSHUA RAMISCH
management options, and therefore the production options of the farming enter-
prise, is critical where the land area for nonfood crop production is limited and where
cash is not readily available to buy inputs for crop and livestock production.
P Replenishment
Phosphorus availability is a major limiting factor for crop production on many
soils of western Kenya because of both a low P content in the soils and their high
P-fixing capacity (Mutuo 1999). Options available to farmers include the use of
locally available rock P, inorganic fertilizers, and organic sources, such as Tithonia
diversifolia, as P sources for crops (e.g., Buresh, Smithson, and Hellums 1997; Smith-
son et al. 2001; Mutuo et al. 1999). In addition to increasing P supply, farmers can
improve the nutrient use efficiency of phosphorus fertilizers by crops, such as com-
bining P fertilizers with organic residues.
Results of research on a P-fixing nitisol in western Kenya to study possibilities
of replenishing soil P through addition of P fertilizers show that large, single appli-
cations of 150 kilograms P per hectare resulted in low nutrient use efficiency of
applied fertilizers. More modest seasonal applications of 25 kilograms P per hectare
increased maize yield and gradually increased available soil P, whereas the smaller
rate of 10 kilograms P per hectare resulted in soil P depletion. These results show
potential promise for seasonal application of small amounts of P fertilizers, which
would be suitable for the small-scale farming systems of western Kenya (Nziguheba,
Merckx, and Palm 2002). In another study, annual application of 1.8 tons DM per
hectare of Tithonia applied to a P-deficient soil for three seasons at two sites
resulted in maize yields consistently comparable and sometimes better than the maize
yield following application of an equivalent amount of N in the form of mineral
fertilizers ( Jama et al. 2000).
Biomass Transfer with Tithonia diversifolia
A further option for land management to increase productivity is biomass transfer.
For example, Tithonia diversifolia, common in hedgerows and along roads in west-
ern Kenya and eastern Uganda, is able to accumulate P and K in higher concentra-
tions in its plant parts compared to other plant species and has shown good potential
as a nutrient source for soil amendment. In western Kenya, Tithonia leaves (a high-
quality resource) and maize stover (a low-quality resource) were applied alone or
in combination with triple-super-phosphate (TSP) at a rate of 15 kilograms P per
hectare. All treatments increased maize yields relative to the control, and yields
increased in proportion to the amount of Tithonia in the residueşfertilizer mix
where at least 36 percent of the total P applied in the mixture was supplied by
Tithonia (Nziguheba, Merckx, and Palm 2002). Although the collection of Tithonia
LAND MANAGEMENT IN WESTERN KENYA AND EASTERN UGANDA
327
is highly labor intensive (roughly four minutes work per kilogram fresh matter),
the economic returns were higher from the application of Tithonia alone than from
sole fertilizers. Profitability was higher if Tithonia was collected from existing niches
(to reduce labor costs) than when produced off site. Because the Tithonia gave
higher net economic returns than equivalent rates of P in inorganic forms, it would
appear that a high-quality organic input is as economically efficient (or more so)
than inorganic fertilizers as a means of increasing maize yield and of supplying P to
crops. The combination of Tithonia with fertilizers can be a beneficial use of scarce
resources, with the greatest benefits in terms of yields and net benefits obtained by
maximizing the proportion of Tithonia in the mixture.
One disadvantage of this management practice is that biomass transfer of
Tithonia represents redistribution of nutrients within the landscape. At farm level,
this practice is beneficial if the biomass originates from off-farm sources, but where
the biomass is produced on-farm, it will lead to nutrient mining in one area and
enrichment in another.
This technology is now being adapted on-farm. Because Tithonia decomposes
quickly, many farmers in western Kenya now consider it more like a fertilizer (i.e.,
immediate effect, with little residual) and therefore less attractive than "farmyard"
manure (compost of animal, household, and crop wastes), which "builds the soil
fertility" for the long term. Increasingly, Tithonia is being taken directly to compost
piles to "speed the rate of cooking" (i.e., decomposition) in the compost heap.
Soil Fertility Maintenance in CropşLivestock
Farming Systems
As discussed, maintenance of soil fertility is a key issue in agricultural intensifica-
tion in Africa. When a mixed farming system is considered, the constraints to soil
fertility replenishment become more severe because of competition between the
allocation of land for crop production and livestock feed production. Farmers there-
fore must make choices in terms of resource allocation on their farms. Should the
limited organic resource (available on-farm or purchased) be added directly to the
soil, for example, through biomass transfer from farm boundaries and contour
strips or additions of crop residues, or should the organic material be fed to live-
stock and then the manure added to the soil?
Intensification under the influence of increased pressure on the land restricts
availability of manure from pastoralists and forces arable farmers to keep their own
livestock for manure production, but many farmers do not possess suitable feed
resources. Low digestibility, low protein content, and hence low intake, limit the
utilization of many feed sources by ruminants. The option of treating the fodder
328
ROBERT DELVE AND JOSHUA RAMISCH
with, for example, urea or alternatively supplementation with protein-rich concen-
trates is not available to all farmers, and where concentrates are used, they are fed
mostly to lactating animals. The limited availability of high-quality feed resources will
also encourage supplementation of livestock feeds, and as a result, there is increas-
ing interest in the use of legumes as supplements to improve diet quality, provide
additional dietary nitrogen, and provide better-quality manure (Savadogo 2000).
Within extensive livestock systems there is no direct return of manure to food
cropping areas, as all manure is left on the grazing lands. However, manure deposited
where the animals are housed overnight can be more readily collected and used.
Animal production systems are inefficient converters of feed into animal products. A
large fraction of the nutrients ingested in the feed is not retained in animal products
but is excreted in feces and urine. This is particularly true of nitrogen, phosphorus,
and potassium. In many mixed farming systems of the tropics, these excreta, when
collected, represent the sole source of nutrients. The issue then is to capture these
excreted nutrients by returning the maximum amount of manure to the cropland
and through optimal management of the manure.
Closing the Nutrient Cycle
Integration and intensification that reduces the spatial separation of crop and live-
stock production systems offer the possibility of increased nutrient capture and
recycling, such as converting crop residues into animal products and manure. As a
result, a proportion of the nutrients that would otherwise be exported off farm, if
that part of the crop were sold, can be returned to the soil in the form of manure,
thus reducing nutrient losses. Losses in the crop-livestock-soil nitrogen cycle occur
through leaching and denitrification, but most N is lost through volatilization of
ammonia from feces and urine. The rapid loss of N from excreted urine means that
it should preferably be applied to crop land immediately; unfortunately, very few
farmers own facilities to collect and efficiently utilize this N, and hence, it is lost
from the farming system. As more livestock are confined on-farm and are increas-
ingly housed within limited- or zero-grazing units, manure collection should become
more feasible (Ayantunde 1998). Manure management then becomes of paramount
importance in these systems to optimize its use as a source of nutrients. However,
in many areas, manure availability is insufficient to replace removed or lost nutrients,
and inorganic fertilizers will be needed to maintain soil fertility.
Cycling of biomass through animals into manure that is used to fertilize the
soil provides an important link between livestock and soil productivity in many
farming systems of SSA. Many crop residues are characterized by high carbon and
lignin contents, decompose slowly when added to the soil, and can immobilize avail-
able soil N during decomposition. Feeding of such residues to livestock can increase
LAND MANAGEMENT IN WESTERN KENYA AND EASTERN UGANDA
329
the rate of nutrient turnover through reduction in the immobilization of soil N
and hence increasing its availability (Delve et al. 2001). Much of the feed offered to
livestock is imported from off-farm sources, for example, roadside grasses and pur-
chased concentrates, which form net imports of nutrients into the farm. Night hous-
ing and zero-grazing systems are examples of how improved livestock management
practices can increase the amounts of manure and hence nutrients available to the
farming system, provided the manure can be collected and utilized efficiently.
Economics of Land Management
Technologies for soil fertility replenishment often increase labor requirements and
require more careful management (KantÚ 2001), and options such as LCC or bio-
mass transfer may withdraw land from agricultural production for varying periods
of time, all of which represent economic costs to the smallholder farmer. Combi-
nations of these technologies with inorganic fertilizers also increase the required
capital investments. The returns to investment in these technologies vary enor-
mously and are very sensitive to variations in the farm-gate prices of crop products.
For example, although LCC have given significant yield increases in the fol-
lowing maize crop, often these increases do not compensate for the loss of the one
season of maize production or are insufficient to warrant the additional manage-
ment and labor costs. As a result, technologies such as LCC will be appropriate
only under specific conditions. In areas of high population density and conse-
quently a high demand for cropping land every season, such as Vihiga in western
Kenya, adoption of LCC is unlikely, even if the associated yield increases would
compensate for the loss of maize production during the fallow. Alternatively, where
population density is lower and natural fallowing still exists, such as the southern
and eastern Lake Kyoga basin of eastern Uganda, the potentials for increased yields
following improved fallows have been demonstrated and may be sufficient to
promote adoption. The advantages of LCC are best utilized where land is out of
production because of low fertility or high pest or disease pressures or where it
would be left idle in a natural fallow system. In addition, the significant increases in
maize stover production provide additional options for farmers, as stover can be
used in livestock feed or bedding, soil erosion control, compost making, or mulching
in perennial crops.
Agro-ecology also will influence the acceptability of alternative technologies.
Positive economic benefits were recorded for most N replenishment strategies on
highly productive soils in high-potential agro-ecological zones of eastern Uganda,
but only Mucuna relay was profitable on low-productive soils (Kaizzi, Ssali, and
Vlek 2002). In low-potential agro-ecological zones, none of the fertilizer-based
330
ROBERT DELVE AND JOSHUA RAMISCH
strategies were economically viable at the current fertilizer and commodity prices
on the less-productive soils, nor were the current farmers' practices. For the
more-productive soils in low-potential zones, farmers' current practice is as profit-
able as alternative cropping strategies, but at lower production levels. Thus, there
is no incentive for farmers on poor soils to adopt the alternative strategies under
current conditions, even though current practice is itself not sustainable.
Opportunities and Constraints for
Land Management Technologies
Improving soil fertility management options also means improving the access of
farmers to new options by increasing their access to information from multiple
sources. This greater access to a wider range of species and products gives farmers
more flexibility in selecting management options and in decisionmaking as well
as more opportunities to diversify their livelihoods or to pursue market-oriented
activities. These technologies and the underlying knowledge have not been dissem-
inated adequately to farmers and, therefore, still have had little effect at the farm
level. Consequently, agricultural productivity is still declining in most of the small-
holder farming systems. Although many studies have identified the need for im-
proved dissemination of knowledge (e.g., Semalulu, Akwang, and Nakileza 1999),
it is increasingly recognized that the best approach is active participation by farmers,
local administrators, and the communities in general (Defoer 2000).
However, an assumption in developing new technologies is that providing
farmers with "better information" leads them to make "better choices." It is also
implicit that farmers' current choices are suboptimal. Nevertheless, the current strate-
gies often appear optimal to land managers, given their current knowledge and
resources. Hence, to be successful, interventions should increase soil productivity
and potentially be profitable but also address the production objectives of the house-
holds and respond to the farmers' own understanding of the risks and opportu-
nities of different options. Alternative technologies must address farmers' priorities
of food security without creating additional risks and must also acknowledge con-
straints on the availability of land, labor, and inputs such as fertilizers and seed.
Because most resource-poor farmers need to produce a food crop every season,
they are understandably reluctant to invest present resources for only the possibility
of future increased production. As a research farmer in Emuhaya, Kenya, com-
mented, "It's better to have even one gorogoro [tin] of maize [from a depleted field
planted with maize] than to be guaranteed no maize at all this season by planting a
cover crop we can't eat."
LAND MANAGEMENT IN WESTERN KENYA AND EASTERN UGANDA
331
Farmers also often cite the increased labor requirements for incorporating LCC
or collecting biomass as major constraints. In western Kenya schoolteachers have
been found to use the "free" labor of children to harvest Tithonia to apply to school
plots. Without access to this labor, it is unlikely that most farms could manage
to apply Tithonia at the recommended rate, because each hectare demands up to
370 days of labor, compared to 1ş7 days per hectare to apply an equivalent amount
of nutrients in the form of manure or inorganic fertilizer (Mango 2002). Finally,
new technologies must contend with problems of supply: the irregular availability
and quality of seeds for LCC species is often mentioned by farmers, and in com-
munities where the use of Tithonia in biomass transfer systems has become popular,
its availability also becomes problematic.
In general, replenishing soil fertility remains problematic without understand-
ing farmers' problems. Addressing these problems requires research at the farm level,
including natural and man-made heterogeneity at plot and subplot levels (Braun
et al., 1997; KantÚ 2001). By working through progressively reduced scales, from
region to district and then to farm, and through focusing on successively finer detail,
understanding of production conditions and constraints can be increased (Carter
et al. 1994). Similarly, gender and other intrahousehold differences play a role in
resource control, resource use, and decisionmaking that will not necessarily become
apparent if the only consultations are with the "household head." Technologies are
not neutral in their impacts, and some individuals or groups will benefit more than
others. The use of Tithonia on kales in western Kenya, for example, has led to
increased productivity, but at the same time it has been observed that although
women continue to grow kale for home consumption, men are beginning to com-
mercialize plots of kale to increase their own personal incomes.
C h a p t e r 1 4
Policies for Poverty Reduction,
Sustainable Land Management,
and Food Security: A Bioeconomic
Model with Market Imperfections
Stein Holden, Bekele Shiferaw, and John Pender
Ethiopia is one of the poorest countries in the world, and its population of
more than 70 million people lives mostly in the highlands. The food security
of these people is threatened by land degradation and droughts that cause
declining and highly variable land productivity. Changes in the global climate may
also have caused an increase in the incidence of drought that has occurred recently
in areas that were not affected by the earlier droughts. Along with a history of social
conflict and unrest in the country, poor governance and misplaced government
policies have contributed to the vicious spiral of poverty, land degradation, and
food insecurity. There is a strong need for peace, better governance, and improved
policies that can help break the Malthusian development path and put commu-
nities onto more sustainable development pathways where poverty is reduced and
food security is improved. Especially, there is an urgent need for pro-poor alterna-
tive development strategies that address land degradation and food insecurity in
less-favored areas where drought risk is higher and/or market access is poorer.
Market imperfections tend to be severe in rain-fed tropical agriculture because
of the basic material and behavioral conditions, including spatial dispersion, sea-
sonality, covariate risk, poor infrastructure, and moral hazard (Binswanger and
Rosenzweig 1986) as well as because of policy distortions and social unrest. Policy
reforms aiming at improving the functioning of markets may therefore be one
important element in a new policy for sustainable development. Still, there is no
334
STEIN HOLDEN, BEKELE SHIFERAW, AND JOHN PENDER
guarantee that piecemeal improvements of some markets will lead to economic
growth and more sustainable land use. It is even possible that improved access to
some markets can lead to more land degradation. This is also consistent with the
theory of second best (Lipsey and Lancaster 1956).1 Both the mixture and sequenc-
ing of policies may matter for the outcomes.
Policymakers and technology development institutions have for a long period
of time neglected less-favored areas. The International Food Policy Research
Institute (IFPRI) has challenged the conventional wisdom that public investments
in developing countries should emphasize investment in favored areas because
of diminishing returns to investments in these areas and high concentration of
poverty and natural resource degradation problems in less-favored areas (Fan and
Hazell 2000; Pender and Hazell 2000; Hazell et al. 2002). Based on a comparative
advantage argument, Pender, Place, and Ehui (1999) argue that certain types of
agricultural and nonagricultural activities can give high returns and contribute sig-
nificantly to poverty reduction and improved natural resource management in less-
favored areas. More research is, however, necessary to investigate how big this
potential is.
Stimulation of crop production through provision of credit for adoption of
fertilizer has not been very successful in less-favored areas of Ethiopia, however
(e.g., see Chapters 5 and 9). This has led to increased interest in alternative activi-
ties, including development of livestock production, tree crops, forestry, small-scale
irrigation, and nonfarm activities.
We have in this chapter developed a bioeconomic model for a less-favored,
severely degraded, densely populated area with fairly good market access in the
Ethiopian highlands. The study area was chosen because of the unusual availability
of biophysical empirical data on land degradation and the effect of alternative con-
servation technologies from the research carried out by the Soil Conservation
Research Project, beginning in the early 1980s. Combined with our own house-
hold panel data from three survey rounds in 1994, 1998, and 2000, including very
detailed farm plot-level data, we had a very good basis for developing bioeconomic
models for the area. We use the models to assess the effects of alternative policies to
reduce poverty, increase food security, and promote more sustainable land use in
the study area. Specifically, we assess the (1) effect of improved access to off-farm
income and credit for fertilizer, (2) effect of access to food-for-work (FFW), and
(3) effect of promoting planting of eucalyptus on land unsuitable for crop produc-
tion on household welfare, agricultural production, conservation investments, and
soil erosion.
In the second part of the chapter we give a brief description of the case study
area. The structure of the bioeconomic model is briefly described in the next part,
A BIOECONOMIC MODEL WITH MARKET IMPERFECTIONS
335
and the results of the model simulations are presented and discussed in the fourth
part, followed by the conclusions.
Description of the Case Study Area and Data
Andit Tid is located approximately 60 kilometers east of Debre Berhan, along the
main road between Addis Ababa and the Tigray Region, in East Shewa in the Cen-
tral Ethiopian Highlands. This implies that the market access is fairly good. The
area is classified as belonging to the low-potential cerealşlivestock zone and is
severely degraded. It is a high-altitude area (> 3,000 meters above sea level). The
land is located in two altitude zones: dega zone (< 3,200 meters above sea level) and
wurch zone (> 3,200 meters above sea level). The average rainfall is 1,336 millimeters
per year distributed over two growing seasons, the meher season from June to No-
vember and the belg season from January to May. Droughts have not been common
in the area until very lately when the belg rains have failed in two consecutive years
(1999 and 2000). Hailstorms and frost have, however, commonly damaged crops.
Yohannes (1989) estimated 75 percent of the land to be on steep slopes (>25
percent slope). Soil erosion rates in the area are very high, and a large share of the
land has shallow soils, causing reduction of soil depth to affect crop rooting depth
and thus yields (Shiferaw and Holden 2001). Holden and Shiferaw (2000) estimated
21 percent of the land to be shallow (<30 centimeters soil depth) and 48 percent to
be of medium depth (30ş60 centimeters).
Various forms of conservation technologies are common in the area. They have
partly been introduced through external FFW programs. Some of the exogenously
introduced conservation structures have later been removed by the farm households.
Shiferaw and Holden (1998) found that human population pressure (land scarcity)
increased the probability that conservation structures were partly or fully removed.
The reasons for this were thought to be that the conservation structures did not con-
tribute to increased yields in the short run, they occupied some land and therefore
reduced the effective planting area, and they collected fertile soils that could be used
to increase short-run production by dismantling the structures and spreading out the
soil collected there. The structures could also harbor rats that may damage the crops.
The main crop in the area is barley, followed by wheat, horse bean, and field pea.
Lentils and linseeds are also commonly grown. Most of the crop production takes
place in the dega zone, but barley is also grown in the wurch zone in the belg season.
Cattle and sheep are the dominant types of livestock, but goats, equines, and
chickens are also common. The animal population density is very high in the area:
Yohannes (1989) estimated it to be 1.48 TLU (tropical livestock units) per hectare
against 0.36 as the average for the Ethiopian highlands. We found this density to
336
STEIN HOLDEN, BEKELE SHIFERAW, AND JOHN PENDER
have increased to 2.03 TLU per hectare in 1998, but it declined to 1.71 by the end
of 1999 as a result of the drought (Holden and Shiferaw 2000).
The human population density was estimated to be 145.5 persons per square
kilometer in 1986 against the average of 61 persons per square kilometer for the
Ethiopian highlands (Yohannes 1989). The population density was 230 persons per
square kilometer of cultivable land. The population growth rate was estimated to be
3.0 percent per year, indicating high and increasing population pressure in the area.
Production of crops and livestock are well integrated in the area. Oxen are the
dominant source of traction power. Hand cultivation is used only on very steep
slopes inaccessible by oxen. Animal manure is used for fuel or as fertilizer on crops.
Sale of animals is an important source of cash income. Crop residues are used as
animal fodder. Fodder is otherwise obtained from fallow land and grazing land,
but only a small share of this (5 percent) is from communal land. Fodder shortage
is an important constraint, and purchase of fodder and use of a cut-and-carry sys-
tem are the main strategies to overcome this problem besides limiting the number
of animals kept (Holden and Shiferaw 2000).
The land resources are fairly evenly distributed in the area because of land
reform and frequent land redistributions in Ethiopia, where land was allocated to
households based on household size. Livestock wealth is therefore a better indicator
of household wealth and wealth differentiation than land ownership. Particularly,
ox ownership signifies the farming capacity of households because the rental mar-
ket for oxen for plowing is highly imperfect (Holden and Shiferaw 2000; Holden,
Shiferaw, and Pender 2001). It also leads to the typical pattern in which households
without oxen rent out land to households with two oxen or more, whereas house-
holds with one ox exchange oxen among themselves. Land renting typically takes
place in the form of share tenancy, where the share to the owner varies between
0.5 and 0.25, depending on land quality. Households may have access to credit
in kind for purchase of fertilizers but are reluctant to take this kind of credit even
though it appears profitable to do so. Risk and high aversion to this type of risk
cause households to be reluctant to buy fertilizer on credit.
Households have limited access to off-farm income sources; crop production
is highly subsistence oriented, but the trend during the last 20 years has been from
households being net sellers of food grains to now being net buyers. The recent
droughts have even made the area dependent on food aid (Holden and Shiferaw
2000).
The development trend in the study area appears to be similar to that in other
parts of the less-favored Ethiopian highlands, although it was less severe in the past
than in South Wollo, for example (which has lower elevation and lower and more
erratic rainfall than our study area) (Ege and Aspen 2003). Ege and Aspen find that
A BIOECONOMIC MODEL WITH MARKET IMPERFECTIONS
337
households with oxen are generally poor, and even if they manage to sharecrop in
land, this does not lead to wealth accumulation. Ege (2003a) finds that ox owners
are usually poor and likely to grow poorer. Ege (2003b) finds that ox owners can be
able to obtain extra land through sharecropping, but the costs of keeping oxen and
the costs of renting land are so high that these "rich" households remain poor by
any normal standard. Aspen (2003) also finds that informal sources of credit exist
among close relatives and friends and semiprofessional money lenders, but he finds
no evidence of money lending leading to accumulation of wealth by richer farmers.
Devereux and Sharp (2003) have also found that the incidence and severity of
poverty are increasing over time in Wollo, indicating a deepening livelihood crisis
in this part of Ethiopia. Various studies in Wollo confirm the similarity in terms
of limited off-farm employment opportunities and low income-generating poten-
tial (Holt and Dessalegn 1999; Devereux 2000; RESAL Ethiopia 2000; Yared et al.
2000). According to Devereux and Sharp (2003), there are some improvements in
off-farm opportunities as a result of greater freedom of trade and population move-
ment, improved roads, and new construction work on government offices, schools,
and clinics. However, they find that the supply of labor far exceeds the demand.
The Bioeconomic Model
This model is an extension of the model developed by Holden and Shiferaw (2004)
that was used to analyze the effects of land degradation, drought, and price risk and
the suitability of the standard fertilizer-credit extension approach in the study area.
The main expansion of the model presented here is that it looks at alternatives to the
traditional fertilizer-credit development strategy in the form of off-farm income,
FFW, and tree planting. Whereas the previous models were run for a simulation
period of 5 years, these new models were run for a 10-year period. A detailed tech-
nical description of the model can be found in Holden, Shiferaw, and Pender (2005).
Other published papers based on the model include Holden, Shiferaw, and Pender
(2004) and Holden, Barrett, and Hagos (2006). Holden et al. (2003) provide a
more detailed analysis of policies and poverty effects of investments in on-farm tree
planting.
A simple conceptual representation of the model is presented in Figure 14.1.
Households are maximizing their welfare (measured as utility of certainty equiva-
lent full income) subject to many constraints. The model is a dynamic, nonlinear
optimization model. For example, land degradation in the form of soil erosion and
soil nutrient depletion is endogenous in the model, as it is affected by household
production and investment decisions. Furthermore, soil erosion affects soil depth
that affects yields and output in succeeding years, which affects income and welfare
338
STEIN HOLDEN, BEKELE SHIFERAW, AND JOHN PENDER
Figure 14.1 Main components of bioeconomic household group model
in future years.2 Weather risk affects production as well as prices, and this may
again affect production decisions. Households make production decisions based
on expectations about prices and output and the risk involved. Imperfections in
markets3 affect production decisions and cause nonseparability of production deci-
sions from consumption decisions. Households in the study area were divided into
groups based on ox ownership because oxen are used for land cultivation and rep-
resent a very important wealth indicator.4 Population growth affects both the labor
force and household welfare as more people have to share the outcome of a con-
stant land area that also is affected by land degradation. This leads to a Malthusian
development path when technology, prices, and other exogenous factors are con-
stant. This poverty-environment trap can be broken only through availability of
new technologies, improved access to markets, and better investment opportunities.
Results and Discussion
Effect of Improved Access to Off-Farm Income
Ten-year models were developed to explore the effect of better access to off-farm
employment on household welfare, agricultural production, conservation incentives,
A BIOECONOMIC MODEL WITH MARKET IMPERFECTIONS
339
and soil erosion. The results are presented in a set of graphs in Figure 14.2. The risk
of drought in these models was low (10 percent), and so was the level of risk aver-
sion. Higher risk and risk aversion caused infeasibilities when the time horizon was
expanded much beyond five years.5 Because of population growth, the land con-
straint, and land degradation, income per capita would fall by 8 percent over a five-
year period when there is access to credit and by 16 percent when there is no access
to credit. We did not manage to get the bioeconomic model to solve for a period of
10 years when access to both wage employment and credit are restricted at very low
levels. This is indicative of the precarious situation faced by households in the study
area. The income per capita would be lower and decline much faster than for the
scenario with access to credit, given in Figure 14.2. This illustrates the severity of
the combined effects of land degradation, increasing population pressure, stagnant
technology, and drought risk in the study area. Households are becoming increas-
ingly dependent on better market access for off-farm employment, selling of cropş
livestock products, or assistance from the outside in case of adverse conditions.
We see furthermore that the hypothetical case of unconstrained access to wage
employment at the going wage rates in Andit Tid would have substantially im-
proved household income in the area. The fact that households have low levels of
off-farm income (Table 14.1) demonstrates that there are insufficient local employ-
ment opportunities and entry barriers6 in relation to getting wage employment in
distant areas. Otherwise, households in the study area would have worked much
more outside the farm given their small farms and the risks of agricultural produc-
tion. Provision of better employment opportunities for unskilled labor (at low wages)
may substantially improve household income.
We now look at how different market access conditions affect the agricultural
production over time. Households without access to off-farm wage employment
cultivate more of their land because they have a lower opportunity cost for family
labor. Unconstrained access to credit but not to off-farm employment creates
more incentives for land cultivation than both having access to credit and off-farm
employment. Agricultural production is continued on a larger area for a longer
period of time when households have access to credit only. The effect on livestock
capital of households under the different market access conditions is such that
households with access to credit only build up and hold more livestock than house-
holds with access to off-farm employment (with or without credit constraint).
There is a downward trend in livestock capital over the 10-year period, however,
and this may partly be explained by a decline in fodder production.
Households with unconstrained access to credit (but not to off-farm employ-
ment) remain net sellers of crops in years with good rains for most of the 10-year
time period. The surplus declines over time, however, and turns into a net deficit in
340
STEIN HOLDEN, BEKELE SHIFERAW, AND JOHN PENDER
Figure 14.2 Effects of improved access to credit, off-farm employment, and both
credit and off-farm employment
Income per capita
Net sale of crops, good rains
Ethiopian birr
Ethiopian birr
700
1500
650
1000
600
500
550
500
0
450
500
400
1000
350
300
1500
1 2 3 4 5 6 7 8 9 10
1 2 3 4 5 6 7 8 9 10
Year
Year
Credit only Off-farm only Credit and off-farm
Total erosion
Net sale of crops, drought
Erosion, tons per farm
Ethiopian birr
120
0
110
500
100
90
1000
80
1500
70
60
2000
1 2 3 4 5 6 7 8 9 10
1 2 3 4 5 6 7 8 9 10
Year
Year
Proportion of land conserved
Total cultivated area
Proportion
Hectares
0.9
3
0.8
0.7
2.5
0.6
0.5
2
0.4
0.3
1.5
0.2
0.1
0
1
1 2 3 4 5 6 7 8 9 10
1 2 3 4 5 6 7 8 9 10
Year
Year
A BIOECONOMIC MODEL WITH MARKET IMPERFECTIONS
341
Figure 14.2 (continued)
Livestock value
Farm labor
Ethiopian birr
Man-days/year
4500
550
4000
500
3500
450
3000
400
2500
350
2000
300
1 2 3 4 5 6 7 8 9 10
1 2 3 4 5 6 7 8 9 10
Year
Year
Credit only Off-farm only Credit and off-farm
Off-farm labor
Credit
Man-days/year
Ethiopian birr
600
500
500
400
400
300
300
200
200
100
100
0
1 2 3 4 5 6 7 8 9 10
1 2 3 4 5 6 7 8 9 10
Year
Year
the last year. Households with access to off-farm income gradually become deficit
producers of food crops even in years with good rainfall, and the deficit grows to
more than 1,000 kilograms of grain per household by the 10th year. Unconstrained
access to off-farm income also reduces the demand for credit for purchase of farm
inputs over time.
Households with unconstrained access to both credit and off-farm wage em-
ployment also gradually become deficit producers of food crops. They produce
more food grain in the initial years than households with unconstrained access to
off-farm wage employment only, but they have a more rapid decline in food grain
production and have after 10 years a deficit as large as those with unconstrained
342
STEIN HOLDEN, BEKELE SHIFERAW, AND JOHN PENDER
Table 14.1 Average income by source and household group in Andit Tid, 1999
Number of oxen in household
Income source
0
1
2 or more
Wage income
152
15
85
Remittance income
38
38
37
Common property resource income
44
25
35
Business income
80
60
44
Food aid
463
586
547
Farm incomea
458
402
509
Total income
1,236
1,125
1,244
Note: Values in Ethiopian birr.
aCash income only. It does not include the value of crops or livestock products that were pro-
duced and consumed by the household during the year.The year 1999 was a drought year,
causing total failure of crop production during the belg season.
access to off-farm income only. Better access to off-farm income therefore reduces
incentives to produce crops and produce a surplus or be self-sufficient in food grains.
The pattern is very similar in drought years (net sale with drought), but then all
households are deficit producers. The deficit increases from about 400 to above
1,000 kilograms of grains for households with unconstrained access to credit over the
10-year period, whereas it increases from 600 to above 1,500 kilograms for house-
holds with access to off-farm wage employment (with or without access to credit).
Households with unconstrained access to credit put much more labor into
farming than households with unconstrained access to off-farm income. Access to
credit does not help much for the incentives to work on the farm when there
is unconstrained access to off-farm wage employment, showing the higher relative
returns to family labor off-farm. The demand for off-farm employment increases
steadily with the growth in the family labor force and the fall in agricultural pro-
ductivity and thus labor input into agriculture.
Households with unconstrained access to credit had more incentives to con-
serve their land and conserved proportionally much more of it than households with
unconstrained access to off-farm wage employment. Households with unconstrained
access to credit and off-farm wage employment conserved even a smaller share of
their land than households with unconstrained access to off-farm wage employment
but not credit.
The consequences of this for land degradation on the typical farm was that
even though households with off-farm employment cultivate small land areas (have
less intensive agricultural production), their activity causes more erosion than that of
households with access to credit because they conserve a much smaller proportion
A BIOECONOMIC MODEL WITH MARKET IMPERFECTIONS
343
of their farmland. It appears, therefore, that provision of better off-farm employment
opportunities does not necessarily provide win-win benefits, as the natural resource
base may degrade as a result of neglect.
Effect of Introducing FFW Programs
Food-for-work (FFW) programs have been widely used to target food insecure
people and to promote development in various parts of Ethiopia. FFW was also
used to establish conservation structures in Andit Tid in the early 1980s. This was
done through a top-down approach that did not involve local people in planning
or organization. The farm households themselves therefore had no say with respect
to choice of conservation technology or how it was fit into the landscape on their
farms. This caused many to reject the technologies, and many were found to have
partly or fully removed these technologies on their farms (Shiferaw and Holden
1998). This may also have been caused by choice of inappropriate or nonprofitable
conservation technologies (Shiferaw and Holden 2001).
The effect of new FFW programs in Andit Tid aimed at providing food secu-
rity through provision of seasonal employment at a low wage rate (in food) was
assessed using the model. The effect of three alternative scenarios was evaluated
(1) when FFW employment is provided outside agriculture and (2) when FFW
employment is provided for conservation investment on-farm. In both these cases
we assume that access to off-farm employment is constrained and that conser-
vation investment does not reduce initial yields. The third case (3) is like case (2)
but with unconstrained access to off-farm employment and with conservation
investment reducing initial yields (both these changes reduce incentives for farm
production and conservation investment). In cases (2) and (3) we assume that the
investment is taking place on-farm. In all cases, the "wage rate" is defined as 3 kilo-
grams of wheat per day of work, the standard rate mostly used in FFW programs in
Ethiopia.
One of the criticisms of FFW programs is that they undermine farmers' incen-
tives to produce their own food and to take care of their own farms, partly because
FFW activities compete with farming activities of households. Arguments against
this are that if FFW is provided outside the main agricultural season, such compe-
tition may be reduced, thereby enhancing the synergies with agricultural production.
In Andit Tid there are two growing seasons. It is most relevant to provide FFW
after the short rains, that is, in the period March to May.7 However, FFW may
compete with households' own conservation activities in this period, as these are
typically carried out in the slack season.
In our first simulation, case (1), presented in Figure 14.3, we look at the effects
of provision of FFW when FFW is not used for conservation on-farm, when
344
STEIN HOLDEN, BEKELE SHIFERAW, AND JOHN PENDER
Figure 14.3 Effect of introducing food-for-work (FFW) when FFW is not used for
conservation, because of constrained access to the labor market
or for land conservation, and FFW does not reduce initial yields
Income per capita
Net food surplus/deficit in normal year
Ethiopian birr
Ethiopian birr
950
500
900
850
0
800
500
750
700
1,000
650
600
1,500
1 2 3 4 5 6 7 8 9 10
1 2 3 4 5 6 7 8 9 10
Year
Year
Without FFW With FFW
Total soil erosion
Deficit in drought year
Tons/farm and year
Ethiopian birr
120
800
1,000
110
1,200
100
1,400
90
1,600
1,800
80
2,000
70
2,200
1 2 3 4 5 6 7 8 9 10
1 2 3 4 5 6 7 8 9 10
Year
Year
Conservation labor
Proportion of land conserved
Man-days/year
Share of farm size
60
0.8
0.7
50
40
0.6
0.5
30
0.4
20
0.3
10
0.2
0
0.1
1 2 3 4 5 6 7 8 9 10
1 2 3 4 5 6 7 8 9 10
Year
Year
A BIOECONOMIC MODEL WITH MARKET IMPERFECTIONS
345
Figure 14.3 (continued)
Farm labor use
Cultivated area
Man-days/year
Hectares/farm
460
2.5
450
440
2.4
430
420
2.3
410
400
2.2
390
380
2.1
1 2 3 4 5 6 7 8 9 10
1 2 3 4 5 6 7 8 9 10
Year
Year
Without FFW With FFW
Total bad year loss
Total leisure time
Share of poverty line income
Man-days/year
1.2
350
1.1
300
1.0
250
0.9
200
0.8
150
0.7
100
0.6
50
1 2 3 4 5 6 7 8 9 10
1 2 3 4 5 6 7 8 9 10
Year
Year
households have constrained access to the labor market, and conservation tech-
nologies do not reduce initial yields. We see from Figure 14.3 (containing 10 graphs)
that FFW increases income per capita compared to the baseline condition with-
out access to FFW. We also see that own food production is reduced in normal as
well as in drought years for households with access to FFW (excluding the food
obtained through the FFW activity). We see that farm labor use, including conser-
vation labor use, is reduced when opportunities for off-farm employment through
FFW are provided. This causes a smaller proportion of the farm to be conserved
and total soil erosion to be larger compared to cases where such employment
opportunities do not exist. Total leisure time is reduced, indicating that FFW has
substituted not only for farm labor but also for leisure time. This indicates clear
costs of providing FFW for poverty reduction and food security, as it reduces incen-
tives for own food production and conservation and increases the dependency on
assistance from outside.
346
STEIN HOLDEN, BEKELE SHIFERAW, AND JOHN PENDER
Figure 14.4 Effect of food-for-work (FFW) when FFW is used for land
conservation, because of constrained access to the labor market,
or for conservation, and FFW does not reduce initial yields
Net food surplus/deficit in normal year
Income per capita
Ethiopian birr
Ethiopian birr
1,000
800
800
700
600
400
600
200
500
0
400
200
300
400
1 2 3 4 5 6 7 8 9 10
1 2 3 4 5 6 7 8 9 10
Year
Year
Without FFW With FFW
Food deficit in drought year
Total soil erosion
Ethiopian birr
Tons/farm and year
400
110
500
100
600
700
90
800
900
80
1,000
1,100
70
1,200
1,300
60
1,400
1 2 3 4 5 6 7 8 9 10
1 2 3 4 5 6 7 8 9 10
Year
Year
Conservation labor
Proportion of land conserved
Man-days/year
Share of farm size
110
1.1
100
1.0
90
0.9
80
0.8
70
0.7
60
50
0.6
40
0.5
30
0.4
20
0.3
10
0.2
1 2 3 4 5 6 7 8 9 10
1 2 3 4 5 6 7 8 9 10
Year
Year
A BIOECONOMIC MODEL WITH MARKET IMPERFECTIONS
347
Figure 14.4 (continued)
Farm labor use
Cultivated area
Man-days/year
Hectares/farm
480
2.7
2.6
460
2.5
440
2.4
2.3
420
2.2
2.1
400
2.0
1.9
380
1.8
1.7
360
1.6
1 2 3 4 5 6 7 8 9 10
1 2 3 4 5 6 7 8 9 10
Year
Year
Without FFW With FFW
Total bad year loss
Total leisure time
Share of poverty line income
Man-days/year
1.4
300
1.3
250
1.2
1.1
200
1.0
150
0.9
0.8
100
0.7
50
1 2 3 4 5 6 7 8 9 10
1 2 3 4 5 6 7 8 9 10
Year
Year
In our second simulation, case (2), we look at the effects of FFW when it is
used for conservation on-farm, when farmers have constrained access to the labor
market, and conservation does not reduce initial yields. The results are presented
in Figure 14.4.
We see from Figure 14.4 that household income per capita is increased when
opportunities for on-farm employment are available through local FFW inter-
ventions. We also see that, as expected, conservation-linked FFW stimulates land
conservation, and this leads to less soil erosion. The effect on household surplus
food production is small (i.e., the food surplus is relatively lower with FFW than
without it).
In the third simulation, case (3), we have altered two of the initial assumptions
and look at the effect of FFW when FFW is used for conservation, when house-
holds have unconstrained access to the labor market (better nonfarm employment
348
STEIN HOLDEN, BEKELE SHIFERAW, AND JOHN PENDER
opportunities), and conservation technologies reduce initial yields (lower incentives
to conserve land). The results of the model simulations are included in Figure 14.6.
Household income per capita is increased for households with access to FFW in
this case also, but less so than when access to the labor market was constrained. This
implies that the payment from FFW (3 kilograms of wheat per day) is higher than
that in the labor market. We also see that FFW substitutes for other off-farm work
in this case. On the other hand, FFW stimulates own food production and reduces
food deficits in normal as well as drought years, and particularly so toward the end
of the 10-year period for which the models have been run. This is largely because
FFW is used for land conservation, and this makes farm production more sustain-
able. Without FFW, households do not invest in conservation in this case because
conservation reduces initial yields and because they have alternative off-farm employ-
ment opportunities.
We see that the effects of FFW on food production and conservation of land
can be highly different depending on how and for what activities FFW is used, the
wage rate, the level of access to off-farm cash employment, and the effect of con-
servation technologies on short-term yields. When FFW competes with labor used
for conservation, FFW may reduce incentives to conserve land where such incen-
tives exist without intervention. On the other hand, FFW may be used to stimulate
conservation when there are insufficient incentives to conserve land. This illustrates
that care has to be taken when such programs are designed to avoid unwanted dis-
incentive effects and to achieve the social, economic, and/or environmental objec-
tives of the programs. Good knowledge about the local farming systems, about the
local market characteristics and prices, and about the distribution of resources and
welfare are needed to avoid design failures. Those who have designed such programs
in the past may not have had such knowledge, and this may also explain the mixed
experiences with such programs (Barrett, Holden, and Clay 2004).
Effect of Stimulating Tree Planting
Planting of trees, especially eucalyptus, may be a promising option for farm house-
holds in marginal areas of Ethiopia where rainfall is adequate (Jagger and Pender
2003). In the past, most tree planting took place on government land and commu-
nity woodlots. However, some tree planting also took place on privately controlled
land. Jagger and Pender (2003) suggest that tree planting is most likely to be profit-
able in areas with low population density, low agricultural potential, good market
access, market outlet for tree products, access to long-term credit, and secure access
to the benefits from the investments. Holden and Yohannes (2002) found that
resource poverty in land, livestock, and basic education may undermine planting
A BIOECONOMIC MODEL WITH MARKET IMPERFECTIONS
349
of perennials in southern Ethiopia, whereas Gebremedhin and Swinton (2003a)
found that tenure insecurity may undermine tree planting in the Tigray Region.
If farm households adopt short planning horizons because of poverty and tenure
insecurity, they may not adopt tree planting, as it may take 8ş15 years before they
can harvest the benefits of their investments. It may, under such conditions, be
socially optimal to intervene to stimulate private tree planting because the benefits
from intervention may be higher than the costs.
Interventions may take alternative forms depending on local circumstances,
and various approaches should be tested. Direct regulation is one alternative, as has
been recently done in Tigray, where planting of eucalyptus on land suitable for
crop production was prohibited in 1997 (Jagger and Pender 2003). More recently,
the regional government allowed private planting of eucalyptus on community
wasteland and steep hillsides. In the Amhara Region distribution of state-owned
communal lands on long-term lease contracts for private tree planting has started.
Our case study area has high population density, no access to long-term credit,
and farmers may not feel secure that they will be getting the benefits from their
tree-planting efforts (Holden and Shiferaw 2000). The land redistribution in 1997
may have undermined the feeling of tenure security and reduced the incentives to
plant trees. Poverty, credit constraints, and lack of access to tree seedlings may be
other reasons for underinvestment in tree planting compared to what would be
socially optimal. Our survey showed that farm households in the area are not will-
ing to plant trees on land suitable for crop production but are positive toward tree
planting on land unsuitable for cropping. The potential of this option to improve
household welfare is, therefore, what we explore with our bioeconomic model. We
also want to explore the indirect effects on agricultural production and incentives
for conservation, considering the income effect and possible competition between
alternative uses of family time for agricultural production, including conservation,
tree production, nonfarm employment, and leisure. We do not here explore alter-
native ways of promoting tree planting but rather assume that the constraints to tree
planting have been removed and that a stable tree rotation has been established,
given that it is profitable. We therefore try to assess the potential contribution of
trees to household income and the influence such production may have on other
production and conservation activities.
The model allows tree planting only on steep slopes and shallow soils unsuit-
able for crop production. Almost all land in densely populated Andit Tid has been
distributed to individual households. The average area of steep lands with shallow
soils is 0.45 hectare per household. The average area planted with trees on the farms
was only 0.09 hectare per household. If trees are relatively more profitable, it should
350
STEIN HOLDEN, BEKELE SHIFERAW, AND JOHN PENDER
therefore be possible in principle to increase the area planted with trees from 3.3
percent to 18.2 percent of the average farm size without using land that is suitable
for crop production.
The high elevation in Andit Tid causes the time from planting to harvesting of
eucalyptus to be as long as 12 years. The average price of harvested trees was 12 birr
in 1998. This is substantially below the lowest price of 17 birr used by Jagger and
Pender in their study in Tigray, suggesting higher scarcity of trees in Tigray com-
pared to North Shewa, even though Andit Tid is located along the main road
between Addis Ababa and the Tigray Region. We also assume away marketing
constraints in our analysis and assume that farm households may sell all the trees
they produce at the 1998 price. However, we included a small transportation cost
for trees of 0.5 birr per tree. We used a planting density of 5,000 trees/hectare and
a survival rate of 60 percent. We have not included additional ecological benefits
and costs of eucalyptus planting in the model because these are highly uncertain
and complex, and it is not clear whether the net effects are positive or negative
( Jagger and Pender 2003).
Figure 14.5 illustrates the potential effects of planting of a stable rotation of
eucalyptus trees on land unsuitable for crop production in Andit Tid. We have in
this case assumed that households have unconstrained access to off-farm employ-
ment and that conservation investment reduces initial yields. We see that planting
of eucalyptus on land unsuitable for crop production can increase household
income substantially. This is in line with what has also been found in other studies
(Okumu et al. 2002; Jagger and Pender 2003). We see that although land for crop
production is not used for tree planting, food deficits are increased after tree plant-
ing has been stimulated. This is primarily because of higher demand for food
when income is higher but to some extent also because of less food production.
Planting of trees had little effect on incentives for conservation of land used for crop
production and therefore also had little effect on total soil erosion on farms. Grow-
ing of trees reduced the demand for off-farm employment, indicating that the rel-
ative return to family labor in on-farm tree plantations was higher than the return
to available cash employment for unskilled labor off-farm.
It appears that stimulation of on-farm trees may be a promising policy option
for degraded drought-prone areas in the Ethiopian highlands provided that market
outlets can be identified or developed. Interventions may be necessary to promote
this through stimulation of seedling production, mobilization of labor, and identi-
fication of suitable areas.
Finally, we looked at the combined effects of planting of eucalyptus and FFW
employment to promote land conservation, in the case with unconstrained access
A BIOECONOMIC MODEL WITH MARKET IMPERFECTIONS
351
Figure 14.5 Effect of planting of eucalyptus when off-farm employment is
unconstrained and conservation investment reduces initial yields
(continued)
352
STEIN HOLDEN, BEKELE SHIFERAW, AND JOHN PENDER
Figure 14.5 (continued)
to off-farm employment, and when conservation investment reduces initial yields.
The results are presented in Figure 14.6.
The influence of FFW on income is small compared to the planting of trees
(when access to off-farm income is unconstrained). However, FFW stimulates land
conservation and reduces soil erosion even when tree planting on shallow soils
and steep slopes is included as an alternative livelihood strategy. The combination
of tree planting and FFW for conservation therefore appears to produce superior
outcomes, and substantial increases in household income are achieved while the
erodible cropped lands are also conserved. We have, however, not taken into account
the external costs of stimulating tree planting and using FFW. That has to be done
to make a social cost-benefit analysis of the alternative policies.
We refer to Holden et al. (2003) for a more comprehensive analysis of the poten-
tial of tree planting for poverty reduction in less-favored areas of the Amhara Region.
A BIOECONOMIC MODEL WITH MARKET IMPERFECTIONS
353
Figure 14.6 Impact of tree planting and food-for-work for land conservation
when off-farm employment is unconstrained and conservation
investment reduces initial yields
(continued)
354
STEIN HOLDEN, BEKELE SHIFERAW, AND JOHN PENDER
Figure 14.6 (continued)
Soil erosion
Cultivated area
Tons/farm and year
Hectares/farm
130
2.8
120
2.6
110
2.4
100
2.2
90
2.0
80
1.8
70
1.6
60
1.4
1 2 3 4 5 6 7 8 9 10
1 2 3 4 5 6 7 8 9 10
Year
Year
Base scenario
With FFW
With trees
With FFW and trees
Farm labor use
Demand for off-farm labor
Man-days/year
Man-days/year
440
600
420
500
400
380
400
360
300
340
320
200
300
100
1 2 3 4 5 6 7 8 9 10
1 2 3 4 5 6 7 8 9 10
Year
Year
Conclusions
We have developed bioeconomic models for a severely degraded area with high
population density and fairly good market access in the Ethiopian highlands
(building on the model by Holden and Shiferaw 2004).
The simulations indicate that there are limited off-farm employment opportu-
nities in the local economy and entry barriers against wage employment in other
areas. Better (unlimited) access to off-farm income at the low seasonal wage rates
that are typical in the study area had a considerable positive effect on household
income but also increased the need to import basic food grains to the area. We find
that better access to off-farm income reduces farm households' incentives to invest
in conservation and that this leads to more overall soil erosion and more rapid
land degradation. Conservation investments require only labor inputs and are not
limited by financial constraints. This is the case even though total agricultural pro-
duction (crop and livestock production) and farm input use are reduced when
A BIOECONOMIC MODEL WITH MARKET IMPERFECTIONS
355
access to off-farm employment is improved. There is therefore a need to comple-
ment a policy focusing on the development of the non-farm sector with a policy
that ensures conservation of the natural resource base.
We find that FFW programs may be used to improve household food security
and to promote more sustainable land management. There is a danger that such
programs may undermine private incentives for food production and land conser-
vation. By linking FFW to conservation investments, negative side effects may be
minimized. However, local participation and commitment are important to ensure
lasting effects of the investments.
Stimulation of planting of trees is a promising policy alternative. If land
unsuitable for crop production is planted with trees and market outlets for the trees
can be found, this can provide substantial increases in household incomes. This
may not have large effects on incentives to conserve cropland.
FFW may be used to stimulate tree planting as well as cropland conservation.
Policies combining promotion of tree planting and conservation through FFW may
have the potential to achieve win-win benefits in terms of poverty reduction and
more sustainable land use. Careful design and implementation are required to maxi-
mize such benefits.
Notes
This work is part of the IFPRI/ILRI project "Policies for Sustainable Land Management in the
East African Highlands." ILRI and IFPRI have provided funds and logistical support for the work.
The Norwegian Ministry of Foreign Affairs has provided funds for this research in the Amhara
Region in Ethiopia. We also draw on earlier work funded by The Research Council of Norway. The
first author claims senior authorship.
1. Starting from a point with many market imperfections and removing one of them does not
guarantee that the new solution is closer to the social optimum.
2. Shiferaw and Holden (2001) provide a production function analysis based on experimen-
tal data that is used as basic input for the bioeconomic model. Households may decide to conserve
their land by introducing conservation structures (graded soil or stone bunds). Only labor is needed
as an input for this. The conservation technologies maintain yields better in the long run by reduc-
ing erosion and maintaining soil depth.
3. These market imperfections include limited access to off-farm employment, price bands
for outputs and labor, a constrained rental market for land through share tenancy, ox rental market
through exchange with labor only, and constrained access to formal credit in kind (for fertilizer) or
to informal credit at a high interest rate. There is also no insurance market.
4. The model results presented are for the household group with two oxen (a pair of oxen is
required for cultivation). This group cultivates 70 percent of the land in the case study area.
5. The households were operating close to their minimum subsistence level. Continued land
degradation, population growth, stagnant technology, drought, and poor market access contribute
to the infeasibilities.
356
STEIN HOLDEN, BEKELE SHIFERAW, AND JOHN PENDER
6. Entry barriers are defined to include lack of information, uncertainty, risk aversion, and
costs of obtaining information and moving to areas where wage employment could be obtained.
7. This is to minimize the crowding-out effects of FFW. In this period opportunity cost of
family labor is at its lowest.
C h a p t e r 1 5
Sustainable Land Management and
Technology Adoption in Eastern Uganda
Johannes Woelcke,* Thomas Berger, and Soojin Park
Under the regimes of Idi Amin (1971ş79) and Milton Obote (1980ş85),
Uganda's economy plunged into a prolonged crisis with negative real growth
rates of GDP (Baffoe 2000). In 1987, under Yoweri Musevini, the Ugandan
government introduced an economic recovery program in cooperation with the
IMF and the World Bank, aiming at market liberalization, privatization, and de-
centralization. Although these reforms have had positive effects on the Ugandan
economy (the GDP real growth has averaged 6 percent per annum), productivity
in the agricultural sector has either stagnated or declined (APSEC 2000). Land
degradation is generally seen as a major factor contributing to declining agricultural
productivity as well as to poverty and food insecurity. Recent studies in eastern and
central Uganda have revealed high negative nutrient balances for most cropping
systems (Wortmann and Kaizzi 1998).
To address the issue of sustainable intensification of agriculture, the Ugandan
government has published a Plan for Modernization of Agriculture (PMA) as part of
the Poverty Eradication Action Plan with the vision of "poverty eradication
through a profitable, competitive, sustainable and dynamic agricultural and agro-
industrial sector" (Government of the Republic of Uganda 2000). The priority
areas for action are improving access to rural finance, improving access to markets,
increasing research and technology development, promoting sustainable natural
*The views included in this chapter are those of the author and do not necessarily represent those of
the World Bank.
358
JOHANNES WOELCKE, THOMAS BERGER, AND SOOJIN PARK
resource utilization, and providing opportunities for management and educational
training in agriculture. This chapter analyzes the constraints that eastern Ugandan
farm households face in the adoption of new technologies. It employs a bio-
economic model to test which policy instruments may induce farm households to
adopt ecologically sustainable farming practices.1 Some policy conclusions are drawn
on how to implement specific policy programs so as to overcome the household-
level obstacles.
The causes of land degradation, including very low use of inorganic and organic
fertilizers, declining fallow periods, deforestation, and crop production on steep
slopes with limited investments in terraces or other conservation measures, are rel-
atively well known, but the core of the land degradation problem is of an economic
nature. Poor rural households in Uganda have to cope with stagnant or declining
land productivity and farm incomes. Financial constraints and imperfect market
conditions compel many farm households to adopt livelihood strategies that con-
tribute to nutrient depletion. Ecologically sustainable intensification of agriculture
is not pursued. Additionally, labor and land constraints limit the households' ability
to invest in land improvements. It is therefore a difficult but important task to design
agricultural policies that make these technologies affordable and adoptable, espe-
cially to poor farmers.
In their review of empirical studies, Feder, Just, and Zilberman (1985) analyzed
the determinants that influence the adoption of technologies in general, including
farm size, land tenure, risk, and farmers' age and level of education. However, what
specific constraints the farm households face to the adoption of ecologically sus-
tainable farming practices, what the optimal levels of adoption of these practices
are, and what their effects on household income and natural resource conditions
are remain unclear. This study was carried out to improve the understanding of key
economic factors affecting land management decisions at the farm household level in
the context of soil nutrient depletion, resource constraints, and fertilizer application.
The empirical research objectives were to
Ě assess, from the farm households' point of view, the feasibility of land manage-
ment practices leading to nonnegative nutrient balances,
Ě identify the most binding factors affecting land use practices and adoption of
new technologies (e.g., labor shortages, capital constraints, imperfect capital
markets, distorted input and output prices, transaction and information costs),
Ě investigate the main reasons for the contrast between the current level of agri-
cultural development and development opportunities in the study region, and
LAND MANAGEMENT AND TECHNOLOGY IN EASTERN UGANDA
359
Ě explore the potential effects of policy and institutional interventions mentioned
as priority areas in the PMA (e.g., development of local credit markets and pro-
motion of improved technologies) on economic and ecological indicators.
Problem Setting in the Study Region
The agricultural market environment in Iganga District, as in most parts of eastern
Uganda, is highly distorted. A market study by the International Fertilizer Devel-
opment Center (IFDC 1999) reported inefficiency in procurement, high trans-
portation costs, and absence of competitive pressure leading to unreasonably high
input prices, especially for fertilizers. Since the initiation of market liberalization in
Uganda, the government policy has been to leave the import of fertilizers entirely
to the private sector. The fertilizer market, however, is still in a very early stage of
development. There are only four fertilizer importers and wholesalers and surpris-
ingly few business relationships with Kenyan traders, the potential suppliers of
imported fertilizers for Uganda.
Fertilizer prices could be substantially reduced by improving the market envi-
ronment and marketing chain. The "Soil Fertility Initiative Concept Paper" (FAO
1999) reports that by the end of 1998, the average price of fertilizer in Mombassa
(Kenya) was US$250 per ton, freight to Kampala (Uganda) was about US$100 per
ton, to which US$50 was added for clearance at the border, transloading, storage,
and import charges. Therefore, the total CIF price in Kampala was about US$400,
which is very high compared to prices in Kenya and other neighboring countries.
It is estimated that fertilizer CIF prices in Kampala would fall by a quarter if the
import quantities increased to a level that would justify imports by shiploads and/or
trainloads. Most fertilizer is delivered to dealers in 50-kilogram bags. The fertilizers
are repacked into smaller units of 5 kilograms and 1 kilogram, leading to a 100 per-
cent price increase. According to the FAO (1999), exploiting economies of scale in
transportation and avoiding the costs of repacking fertilizers would result in a fer-
tilizer price amounting to 37.5 percent of the current price. A further reduction in
input prices could be attained through market regulation policies aimed at fostering
competition on the fertilizer market.
The marketing chain in Iganga District involves middlemen in villages, local
buyers in trading centers and in Iganga town, and traders from Kenya and Mbale,
Busia, and Kampala. The prices offered to the farmers for their produce by mid-
dlemen depend on the prices set by local buyers in towns or in trading centers,
which in turn are determined by the prices offered by foreign buyers. A study
carried out by Vredeseilanden-Coopibo-Uganda (1998) indicated a 60 percent
price markup from farm gate to retail in Iganga District. Survey data from Woelcke
360
JOHANNES WOELCKE, THOMAS BERGER, AND SOOJIN PARK
(2003) revealed even higher price differences among farmers, wholesalers, and
retailers. In 2001, the average price markup of maize between farmer and whole-
saler was 62 percent, and between farmer and retailer 212 percent. Farmers often
face information asymmetries when selling their produce at the farm gate because
they are often unaware of the prices offered at higher levels of the market chain.
These examples are indicative of the influence that reduced transaction costs could
have on farm-gate prices in the study region.
The model scenarios, to be presented in the next section, focus on how and to
what extent the market environment in eastern Uganda could be improved so as to
provide sufficient incentives to simultaneously reach the policy goals of growth and
sustainability. The main question put to the model is: Is it realistic to expect farm
households to attain these goals without direct market intervention in output price
policies (e.g., taxes, subsidies, fixed prices), input policies (e.g., subsidies, input deliv-
ery systems), and marketing policies (e.g., monopoly parastatals, trader licensing)?
The identification of research objectives and the discussion of the specific prob-
lem setting in the study region led to the selection of the following policy scenarios:
Ě Binding constraints and feasibility of nonnegative nutrient balances under
current market conditions.
Ě Economic and ecological effects of promoted technologies under market
improvements such as decreasing fertilizer prices, increasing agricultural
output prices, introduction of credit, or improvement of price relations
and promotion of labor exchange.
Integrated Approach to Bioeconomic Modeling
Sampling Procedure
The International Food Policy Research Institute (IFPRI) identified the predominant
development domains in Uganda. Three factors were used for the stratification:
agricultural potential, market access, and population density.2 Development do-
mains can be used to identify potential profitable pathways of development, based
on the comparative advantages that exist in a particular region.3 For our study,
we selected two villages in Iganga District, characterized by a program-induced devel-
opment pathway with relatively high market access, high agricultural potential,
and high population density. The district is located in the Lake Victoria Basin in
eastern Uganda, about 120 kilometers northeast from Uganda's capital Kampala.
LAND MANAGEMENT AND TECHNOLOGY IN EASTERN UGANDA
361
Table 15.1 Selected output prices and input prices for Iganga District, 2001
Output prices (at farm gate) (USh/kg)
Input prices (Iganga market) (USh/kg)
Maize
200
Urea
800
Beans
300
TSP (triple-super-phosphate)
800
Sweet potatoes
120
NPK fertilizer
850
Millet
250
Rock phosphate
100
Sorghum
200
CAN (calcium-ammonium-nitrate)
660
Coffee
400
Ambush (insecticide) (USh/liter)
12,000
Cassava
100
Round-Up (herbicide) (USh/liter)
12,500
Bananas
100
Ripcord (insecticide) (USh/liter)
11,000
Source: Authors' survey.
Note: USh, Uganda shilling. Average exchange rate in 2001: US$1 = USh 1,788.
The traditional food crops are maize, bananas, sweet potatoes, cassava, beans, mil-
let, and sorghum, and the traditional cash crops are coffee and cotton (Table 15.1
indicates output and input prices for Iganga District in 2001). The primary goal of
the low-input and -output farm production is home consumption for the majority
of farm households (Esilaba et al. 2001). Obviously, these low-intensity production
systems are at variance with the development opportunities that exist in eastern
Uganda. Another important characteristic of the region is the presence of
numerous nongovernmental organizations (NGOs) and International Agricultural
Research Centers (IARC), which focus on fostering agricultural and rural develop-
ment. The International Center for Tropical Agriculture (CIAT) and Africa 2000
Network (A2N) are promoting different technologies aimed at sustainable inten-
sification of agricultural production based on a participatory research approach in
selected communities of the study region.
A listing of households in both villages indicated that approximately 7 per-
cent of the households conducted agricultural technology trials in cooperation
with the CIAT and A2N.4 For the first round of the household survey, stratified
random sampling was performed in order to capture the correct proportion of farm
households participating in trials within the sampled population. Principal compo-
nent analysis and subsequent cluster analysis were used to identify the following
four representative household types: subsistence farm households (30 percent of
all households), semisubsistence farm households (52 percent), trial farm households
(7 percent), and commercial farm households (10 percent).5
Table 15.2 provides information about the characteristics of these household
groups. Trial farm households were among the first to adopt a mosaic virusşresistant
cassava variety, and this is seen as an indicator of their general innovativeness. These
farmers form the only household group that conducted farm trials in cooperation
362
JOHANNES WOELCKE, THOMAS BERGER, AND SOOJIN PARK
with CIAT and A2N. They applied the highest amounts of inorganic fertilizers
and other agrochemicals and are the only group of farmers who participated in a
significant number of different types of training. Furthermore, farmers in this group
adopted the highest number of technologies within the last 10 years. Only the
household heads and spouses of the commercial farm households had more years
of schooling than those of trial farm households. Commercial farm households
achieved the highest mean values for the following variables: value of residence
and other structures of the household, value of agricultural equipment per person
involved in farming, total value of agricultural production, value of agricultural
production per acre cultivated land, years of schooling of household head and wife,
value of radios, intensity of land use, and quantity of total agricultural production
sold. These values indicate a relative abundance of human and physical assets as
well as a relatively high degree of market orientation, although the low participa-
tion in different types of training reveals a lack of regular contact with programs,
organizations, and extension services between 1990 and 2000.
That this group of farmers adopted the mosaic-resistant cassava variety later
than others can be explained by the facts that (1) cassava is not important as a cash
crop, and therefore not of major interest to commercial farmers, and (2) wealthier
households are excluded from the communication process of the average farm house-
hold (Miiro, Esilaba, and Soniia 2002). Subsistence and semisubsistence farm
households attain relatively low mean values for the following variables: years of
schooling of the household head and spouse, value of household assets, quantity
of total agricultural production sold (especially low value for the subsistence farm
household), value of agricultural production (total and per acre of cultivated land),
and number of inorganic fertilizers and other agrochemicals applied. These values
reveal a shortage of human and physical assets, low productivity, and low degrees of
innovativeness and market orientation. Furthermore, subsistence farmers were con-
fronted with long distances to the nearest output markets and were late in adopting
new technologies. Moreover, the highest value of labor-land ratio is reported for
this group indicating a relative abundance of unskilled labor and relative scarcity of
land. The number of different types of training undergone within the last 10 years
is insignificant for both of these groups.
Out of each group, the households closest to the cluster centers were selected for
the second round of the household survey. The main objective of the second round
was to collect biophysical data at plot level, detailed inputşoutput coefficients,
estimates of farm income, and information on household preferences, decision
rules, and goals. Additionally, CIAT provided farm trial data from four seasons in
2000 and 2001, together with soil data for the estimation of yield responses to fer-
tilizer application.
Table 15.2 Characteristics of the identified household groups
Subsistence farm
Semisubsistence
Trial farm
Commercial farm
households
farm households
households
households
Characteristic
(30%)
(53%)
(7%)
(10%)
Education
Years of schooling head
5.5
4.4
7.7
12.4
Years of schooling wife
3.3
4.3
5.6
8.1
Number of different types of
0.3
0.7
4.2
1.0
training participated in
since 1990
Household assets
Value of residence and
1,267
837
1,951
7,601
other farm structures
(103 USh)a
Value of radios (103 USh)
16
22
43
74
Value of agricultural
4,358
5,261
5,778
9,739
equipment per person
involved in farming (USh)
Agricultural production
Total value of agricultural
455
833
1,066
1,635
production (103 USh)
Value of agricultural
182
182
207
224
production per acre
cultivated land (103 USh)
Quantity of total production
23
52
35
64
sold (%)
Perceived walking time to
142
45
81
64
output market (minutes)
Intensity of land useb
0.9
1.2
1.1
1.4
Labor-land ratioc
260
131
159
165
Innovativeness
Time of adoption (improved
+4.6
+0.7
ş2
+5.8
cassava variety)
compared to opinion
leader (years)d
Time of adoption (improved
66
41
33
73
cassava variety)
compared to personal
agricultural information
network (%)e
Number of technologies
5
5
8
6
adopted within the past
10 years
Number of trial types
0
0
7
0
conducted
Source: Woelcke (2003).
aUSh, Ugandan shilling.
bIntensity of land use:The ratio of the land area cultivated in the past 12 months to the total land size.
cLabor-land ratio:The ratio between labor use on farm (person-days) and cultivated land size.
dOpinion leader: An individual who leads in influencing others' opinions about innovation (Rogers 1995).
ePersonal agricultural information network:The network of people with whom farmers discuss agriculture related
issues. In the case of subsistence farm households, 66 percent of the farmers who are in the personal network of this
household type adopted the improved cassava variety before this type itself decided to adopt the new technology.
364
JOHANNES WOELCKE, THOMAS BERGER, AND SOOJIN PARK
Modeling Approach
Bioeconomic models combine socioeconomic factors influencing farmers' objec-
tives and constraints with biophysical factors affecting production possibilities
and the effects of land management practices (Oriade and Dillon 1997).6 The bio-
economic modeling approach chosen for this study helps to identify the optimal
level of technology adoption and its effect on household welfare and natural resource
conditions for heterogeneous household agents (normative analysis). The model
consists of three major components: a mathematical programming model at the
farm household level, to reflect the decisionmaking processes under different con-
straints; artificial neural networks (ANN)7 as a yield estimator; and nutrient bal-
ances as sustainability indicators.8 The household's decisionmaking problem is based
on a lexicographic utility concept; that is, the household first satisfies the con-
sumption needs of its members before the household income is maximized. House-
hold income includes both on-farm and off-farm activities.9 The mixed-integer
linear programming models developed for each of the four representative house-
hold types consist of 507 variables and 201 constraints. The main activities cap-
tured are crop production, livestock production, consumption and selling of agri-
cultural products, permanent off-farm employment, hiring in/out temporary labor,
labor exchange,10 labor transfer, hiring a tractor, investment activities (e.g., treadle
pump for irrigation), credit application, and technology options based on CIAT
farm trials. The main resources and constraints considered are total land area, crop
rotation, labor, nutrient requirements of household members, consumption prefer-
ences, capital constraints (including credit limits), and nutrient balances as a sustain-
ability indicator. The results of the yield estimator and computations of nutrient
balances are incorporated into the comparative static programming model.
Policy Scenarios and Results
Scenarios on Binding Constraints and Feasibility of Nonnegative Nutrient
Balances under Current Market Conditions
In the following we discuss whether, under current conditions, the private goals of
farm households, that is, the satisfaction of basic food needs and the maximization
of incomes, and the social goal of conserving soil fertility, measured by nonnegative
nutrient balances, can be reached simultaneously. Additionally, we explore whether
the relaxation of technical constraints (through introduction of new technologies
promoted by CIAT) and capital constraints (through provision of credit) can harmo-
nize private and social goals. For this purpose the bioeconomic model is used to run
different scenarios for all household types (scenarios 1ş6 are defined in Table 15.3).11
LAND MANAGEMENT AND TECHNOLOGY IN EASTERN UGANDA
365
Table 15.3 Feasibility of private and social goals under current market constraints
Subsistence farm
Semisubsistence
Trial farm
Commercial farm
Scenario
household
farm household
household
household
Current constraints
Income (103 USh)
1,299
1,490
2,395
4,800
N balance (kilograms/hectare)
ş28
ş52
ş43
ş77
P balance (kilograms/hectare)
ş8
ş12
ş11
ş15
K balance (kilograms/hectare)
ş39
ş62
ş47
ş71
+ Sustainability constraint
Income (103 USh)
Not feasible
Not feasible
Not feasible
Not feasible
N balance (kilograms/hectare)
P balance (kilograms/hectare)
K balance (kilograms/hectare)
+ New technologies
Income (103 USh)
1,310
1,524
2,452
5,204
N balance (kilograms/hectare)
ş29
ş66
ş60
ş96
P balance (kilograms/hectare)
ş6
+24
+21
+58
K balance (kilograms/hectare)
ş40
ş83
ş69
ş100
+Sustainability constraint
+new technologies
Income (103 USh)
Not feasible
Not feasible
Not feasible
Not feasible
N balance (kilograms/hectare)
P balance (kilograms/hectare)
K balance (kilograms/hectare)
+Sustainability constraint
+new technologies
+credit
Income (103 USh)
Not feasible
Not feasible
Not feasible
3,373
N balance (kilograms/hectare)
0
P balance (kilograms/hectare)
+47
K balance (kilograms/hectare)
0
+New technologies
+credit
Income (103 USh)
1,356
1,633
2,575
5,223
N balance (kilograms/hectare)
ş39
ş79
ş69
ş104
P balance (kilograms/hectare)
+12
+59
+35
+56
K balance (kilograms/hectare)
ş51
ş94
ş81
ş106
Source: Woelcke (2003).
Note:The new technology options are available only for maize. For more details refer to Woelcke (2003).
The model's objective function value, the household income, is used as an
indicator for household welfare, and the nutrient balances are used as an indicator
for ecological sustainability. The scenario results reveal difficulties in achieving the
goal of nonnegative nutrient balances under current market conditions, especially
for the subsistence, semisubsistence, and trial farm household types. For all house-
hold types, current land management practices lead to high negative nutrient
balances under present constraints (scenario 1).
366
JOHANNES WOELCKE, THOMAS BERGER, AND SOOJIN PARK
Because of higher yields and consequent higher nutrient losses from fields as a
result of produce and stover removal, the nutrient balances for commercial farm
households are more negative than those for other farm household types. For no
household type did the introduction of the sustainability constraint of nonnegative
nutrient balances lead to feasible model solutions (scenario 2). Sensitivity analyses
indicate that consumption preferences and consumption needs, articulated during
household interviews, would have to be adjusted significantly to halt nutrient
depletion.12 In most cases, neither the relaxation of technical constraints nor the
relaxation of capital constraints contributes to reaching the goal of ecological sus-
tainability (scenarios 3ş6). The reason for this model result is the nonprofitability
of the promoted technologies under existing market conditions. Yield increases are
not sufficient to contribute to positive net benefits of technology adoption. The
simultaneous introduction of new technologies and credit enables only the com-
mercial farm household to attain nonnegative nutrient balances (scenario 5). A
comparison of the household income levels of the commercial farm household in
scenarios 5 and 6 reveals trade-offs between economic and ecological goals. The
household income in scenario 5, where the household is forced into nonnegative
nutrient balances, is much lower than that in scenario 6, where the sustainability
constraint is relaxed again.
Effects of Promoted Technologies under Market Improvements
Because the social goal of nonnegative nutrient balances could not be reached in
most of the above scenarios, and direct market interventions are not considered to
be appropriate policy instruments for Uganda, the subsequent model scenarios
deal with the potential of market improvements to simultaneously increase house-
hold welfare and nutrient balances. The results of these scenarios are presented only
for the semisubsistence farm household, the most frequent household type in the
study region. For the other three remaining household groups, the reader may con-
sult Woelcke (2003).
Effects of decreasing fertilizer prices. This group of scenarios focuses on the
economic and ecological influences of a stepwise decrease of fertilizer prices. Sensitiv-
ity analyses were conducted to identify critical levels of fertilizer prices at which a
significant improvement of nutrient balances could be achieved. Results from these
sensitivity analyses were then compared to the potential decrease in fertilizer prices
through changes in the market environment. The changes in household income
and nutrient balances (nitrogen, phosphorus, and potassium) in response to step-
wise decreased fertilizer prices are illustrated for the semisubsistence farm house-
hold type in Figure 15.1. The table below the diagram indicates the percentage of
LAND MANAGEMENT AND TECHNOLOGY IN EASTERN UGANDA
367
Figure 15.1 Sensitivity analysis of fertilizer price for semisubsistence farm
households
Income (104 kg/ha)
200
150
100
Income
50
N
P
0
K
50
100
75
50
40
37.5
30
20
10
5
0
100
Percent of current price
Percentage of
100
75
50
40
37.5
30
20
10
5
0
current price
"Reduced costs"
(103 USh)
Maize+N1
505
392
279
234
222
189
143
72
118
151
Maize+NP1
833
606
380
290
267
200
109
3
12
26
Maize+NPK1
1154
841
528
403
372
288
153
20
0
0
Maize+N2
464
351
238
193
182
148
103
69
94
127
Maize+NP2
792
566
340
249
227
159
69
0
0
14
Maize+NPK2
1114
801
488
363
331
237
112
17
0
0
Area adopted
0
0
0
0
0
0
0
NP2 NPK1 NPK1
(ha)
0.08
0.76
0.76
NP2
NP2
0.13
0.96
NPK2
0.83
Source: Woelcke (2003).
Abbreviations: Maize+N1 = nitrogen fertilizer application on maize in season 1; Maize+NP1 =
nitrogen and phosphorus fertilizer application on maize in season 1; Maize+NPK1 = nitrogen,
phosphorus, and potassium fertilizer application in season 1. Maize+N2, Maize+NP2, and
Maize+NPK2 indicate the same fertilizer application in the second season.
368
JOHANNES WOELCKE, THOMAS BERGER, AND SOOJIN PARK
fertilizer price reduction (first row), the level of "reduced costs"13 of farming activ-
ities involving fertilizer application (second row), the type of fertilizer applied, and
the total area of application (third row). Even though fertilizer prices are reduced
substantially, the "reduced costs" for production activities involving fertilizer appli-
cation remain high, indicating that these activities are far from being included in
the farm plan. Sensitivity analyses show that fertilizer prices have to be cut down to
10 percent of the current price level before the semisubsistence farm household
profitably adopts one of the new technologies. Fertilizer prices have to decrease to
5 percent of the current price or less to achieve nonnegative nutrient balances.14
The balance for potassium would still be negative, but the high negative value of
ş63 kilograms/hectare in the baseline scenario could be reduced to ş8 kilograms/
hectare. Under this price scenario, NPK fertilizer could be adopted profitably on
1.59 hectares, and NP fertilizer on 0.13 hectare.
The overall effect of fertilizer price reduction on household income is very
modest, reaching a 5.5 percent increase when fertilizer prices are reduced to 5 per-
cent of the current price. Free availability of fertilizer would lead to further slight
increases of income and nutrient balances. Considering the extreme fertilizer price
reduction needed to induce farmers in eastern Uganda to switch to a more sustain-
able intensification of agricultural practices, policy options focusing only on input
market improvements would probably not be a promising strategy. However, even
direct fertilizer subsidies alone will probably not provide sufficient incentives for
the semisubsistence farm households to adopt improved practices.
Effects of increasing agricultural output prices. The next group of scenarios
focuses on the effect of stepwise increased agricultural product prices on household
welfare, ecological sustainability, and production structure. Figure 15.2 illustrates
the results for the semisubsistence household type as an example. The table below
the diagram indicates how the production structure changes in response to chang-
ing output prices. Sensitivity experiments reveal that higher agricultural product
prices alone do not lead to a profitable adoption of new fertilizer technologies.
In comparison to the baseline scenario, the household income would increase by
23 percent with an output price increase of 50 percent, and by 47 percent with
an output price increase of 100 percent. The production structure of the semi-
subsistence farm household type remains relatively stable because of a relatively low
degree of market orientation. A significant change of the production structure of
the semisubsistence farm household is observed when output prices are increased
by 70 percent. The area under improved maize would then increase from 0.21 to
0.37 hectare, whereas the area under intercropped coffee and bananas decreases. This
LAND MANAGEMENT AND TECHNOLOGY IN EASTERN UGANDA
369
Figure 15.2 Sensitivity analysis of output prices for semisubsistence farm
households
Income (104 kg/ha NPK)
200
200
150
100
Income
N
50
P
0
K
50
100
0
10
20
30
40
50
60
70
80
90
100
Output price increase
Percentage of
0
10
20
30
40
50
60
70
80
90
100
output price
increase
Production
structure (ha)
Maize
0.21
0.21
0.21
0.21
0.21
0.21
0.21
0.37
0.37
0.37
0.37
Maize/cassava
0.75
0.75
0.75
0.75
0.75
0.75
0.75
0.73
0.73
0.73
0.73
Sweet potato
0.33
0.33
0.33
0.33
0.33
0.33
0.33
0.33
0.33
0.33
0.33
Millet
0.21
0.21
0.21
0.21
0.21
0.21
0.21
0.21
0.21
0.21
0.21
Sorghum
0.11
0.11
0.11
0.11
0.11
0.11
0.11
0.11
0.11
0.11
0.11
Coffee/banana
0.25
0.25
0.25
0.25
0.25
0.25
0.25
0.2
0.2
0.2
0.2
Source: Woelcke (2003).
change in production structure is induced by changes of the relative competitive-
ness of production activities and leads to a slight deterioration of nutrient balances.
Introduction of credit, improvement of price relations, and promotion of labor
exchange. The sensitivity analyses discussed above indicate that neither a sole decrease
of fertilizer prices to a realistic degree nor a sole increase of agricultural output
prices will lead to the harmonization of private (household welfare) and social (eco-
logical) goals. In the following we examine whether combined price effects and
370
JOHANNES WOELCKE, THOMAS BERGER, AND SOOJIN PARK
additional policy interventions, such as the provision of credit or the promotion of
alternative forms of labor acquisition, could improve the current situation, which is
characterized by highly negative nutrient balances.
For this purpose, sensitivity experiments of both decreasing fertilizer prices
and increasing agricultural product prices are conducted to identify those price
relations that would potentially induce farmers to apply more fertilizers and
improve their nutrient balances. Again, we show only simulation results for the
semisubsistence farm household and refer the reader for the other household types
to Woelcke (2003). Results for the semisubsistence household are of special rele-
vance in Uganda, not only because of its frequency but also because of the govern-
ment's objective of commercializing farm production.
Figure 15.3 illustrates the potential effects that technology adoption and reduc-
tion of market distortions will have on household welfare and ecological sustain-
ability. The reduction of market distortions is represented in the model through
changes of input and output prices to the levels discussed above. Provision of credit
is included for assessing the influence of removing capital shortages on the adop-
tion of new technologies. Another constraint frequently quoted as a major obstacle
to the adoption of new technologies is the shortage of farm labor, especially during
peak periods of the vegetation cycle. Farm labor exchange, a traditional form of
labor acquisition in the study region, was included in the model to investigate
whether it would be an appropriate option to overcome the problem of labor
shortages. The table below the diagram defines the scenarios considered and indi-
cates the area on which specific technologies have been adopted. The first scenario
reflects the current socioeconomic conditions and includes the provision of new
technologies. The second scenario is identical to the first scenario except that it
assumes prices changes for fertilizers and outputs (fertilizer prices are reduced to
30 percent of the current prices, and output prices are increased by 10 percent of
current prices). Scenario 3 assumes the same input and output prices but does not
assume credit constraints. In scenario 4, credit constraints are introduced again,
but the extent of prices changes have been increased. Scenarios 5 and 6 are identi-
cal except that the latter assumes slightly higher output prices. Finally, scenario 7
introduces labor exchange.
The model results suggest that improved inputşoutput price relations in com-
bination with provision of credit and labor exchange can induce a simultaneous
significant improvement of household incomes and nutrient balances. In addition
to credit provision, input prices will have to be reduced to at least 30 percent of the
current price level, and output prices increased to 110 percent before the semisub-
sistence farm household type profitably adopts NP fertilizer on 0.21 hectare. NPK
fertilizer adoption becomes profitable when input prices are decreased to 25 per-
LAND MANAGEMENT AND TECHNOLOGY IN EASTERN UGANDA
371
Figure 15.3 "Combined effects" scenarios for the semisubsistence farm
household type
Income (104 kg/ha NPK)
200
150
100
Income
50
N
P
0
K
50
100
Scen1
Scen2
Scen3
Scen4
Scen5
Scen6
Scen7
Scenario 1
Scenario 2
Scenario 3
Scenario 4
Scenario 5
Scenario 6
Scenario 7
Characteristics Current
Trial
Trial
Trial
Trial
Trial
Trial
conditions
technology technology technology technology technology technology
trial
input price
input price
input price
input price
input price
input price
technology 30 percent
30 percent
25 percent
25 percent
25 percent
25 percent
of c.p.
of c.p.
of c.p.
of c.p.
of c.p.
of c.p.
Output
Output
Output
Output
Output
Output
price: +10
price: +10
price: +40
price: +40
price: +50
price: +50
percent
percent
percent
percent
percent
percent
credit
credit
credit
credit
labor
exchange
Area adopted
0
0
NP
0
NPK
NPK
NPK
(ha)
0.21
1.28
1.28
1.72
Source: Woelcke (2003).
Abbreviation: Percent of c.p. = percentage of current price.
cent of the current value, output prices are increased to 140 percent, and credit is
provided. The application of NPK fertilizer on 1.28 hectares significantly increases
nutrient balances (nitrogen ş2 kilograms/hectare, phosphorus +53 kilograms/
hectare, potassium: ş17 kilograms/hectare). Labor exchange seems to be an inter-
esting option to overcome technology adoption constraints, especially for the semi-
subsistence farm households. Although this household type is partly engaged in
off-farm activities, it still can offer enough labor for labor exchange, which enables
it to receive agricultural labor support in seasonal peaks. Scenario 7 in Figure 15.3
372
JOHANNES WOELCKE, THOMAS BERGER, AND SOOJIN PARK
illustrates that labor exchange in combination with credit provision, input price
decreases (25 percent of current price), and product price increases (to 150 per-
cent) lead to an adoption of NPK fertilizer on 1.72 hectares. This fertilizer applica-
tion would have increasing effects on household income (increase by 27 percent
in comparison to the baseline scenario) and the nutrient balances, of which only
the K balance would remain slightly negative (ş2 kilograms/hectare). Although
increases in output prices might be realistically achieved through price information
systems, an input price reduction to this extent is difficult to attain. In regard to the
discussion above on feasible changes of fertilizer prices, economies of scale in trans-
port, improvements in the marketing chain, and increased competition would have
to be attained simultaneously.
Summarizing the normative simulation experiments, we conclude that the
central reason for nutrient depletion at the household level is the nonprofitability
of ecologically sustainable farming practices under current socioeconomic and
agro-ecological conditions. Low economic incentives to adopt improved land man-
agement practices are caused by market imperfections reflected by high transaction
costs. In addition, insufficient access to credit markets reduces the ability to adopt
technology. Consequently, the necessary condition for technology adoption, posi-
tive net benefits, is not satisfied for inorganic and organic fertilizers, which could
contribute to more positive nutrient balances. Significant improvements of the
socioeconomic environment are essential for successful promotion of more inten-
sive and ecologically sustainable farming practices.
The scenario results reveal that a fertilizer price reduction to about 25 percent
of the current prices and an agricultural product price increase of about 50 per-
cent are simultaneously needed to achieve significant improvements of household
welfare and nutrient balances. Considering the high price mark-ups from farmers
to wholesalers to retailers, a producer price increase to this extent might be attain-
able if farm households would have access to relevant market information (see
above). A fertilizer price reduction to the extent indicated above might be more
difficult to achieve. Exploiting economies of scale in transport and removing mar-
keting inefficiencies might reduce the fertilizer price to 37 percent of current prices.
To contribute to further price reduction, increased competition on the input mar-
ket is needed (FAO 1999). It should be taken into account that improved effects of
promoted technologies on yields could reduce the extent of price changes needed
for reaching economic and ecological goals at the farm household level. However,
isolated improvements of price relations are not sufficient. Improved access to finan-
cial markets is simultaneously needed for promotion of sustainable land manage-
ment practices.
LAND MANAGEMENT AND TECHNOLOGY IN EASTERN UGANDA
373
Summary and Conclusions
This chapter presents the results of a bioeconomic simulation model that reflects
the objectives and constraints of farm households in the Iganga District of eastern
Uganda. In terms of the defined research objectives, the developed static bio-
economic model is an appropriate and straightforward model choice. The model
computes the optimal choice of farming activities and quantifies the financial con-
sequences for heterogeneous household agents in a changing socioeconomic envi-
ronment. It also includes a yield estimator and nutrient balances to simultaneously
assess the ecological influences of these farming practices. The developed model
provides useful insights for policy development because it identifies unprofitable
production activities and therefore eliminates these unlikely alternatives. The
simulation experiments show that under current constraints, the farm households
have no alternatives but to deplete their soils' nutrients. Even with the introduction
of new fertilizer technologies and the provision of credit, nonnegative nutrient
balances are not feasible for most households. Only very drastic changes in input
and output prices would induce the farm households to conserve their soil nutrient
stocks while simultaneously satisfying their consumption needs.
Several preliminary policy conclusions can be derived from the bioeconomic
model. First, the model results strongly encourage the completion of market reforms
in Uganda based on an improved regulatory and legal framework. The process of
market liberalization has removed some major distortions but has not been suffi-
cient to create a business environment fostering private sector activities and trade,
nor has it succeeded in linking small farms to high-value markets.15 As discussed,
there exists an enormous potential to significantly improve price relations for farmers
through reduction of transportation costs, increased marketing efficiency, and in-
creased competition on the fertilizer markets. Second, the model results emphasize
that the provision of credit alone does not necessarily lead to the adoption of sus-
tainable farming practices. However, improved credit access for small-scale farmers
is one essential reform pillar if provided in combination with other measures. There-
fore, more creative thinking and innovative approaches are needed to overcome
the household's capital constraints. Developing a legal and regulatory framework
governing microfinance and improving operating capacity of microfinance institu-
tions should be of high priority. Third, more agricultural research is needed for
new and better-targeted technologies that will provide farm households with the
opportunities to intensify their agricultural production without increasing nutrient
extraction. Several national research institutions are currently carrying out encourag-
ing field experiments, but significant efforts and new ways of funding are required
to revitalize the National Agricultural Research System in Uganda. Participatory
374
JOHANNES WOELCKE, THOMAS BERGER, AND SOOJIN PARK
research approaches, as conducted by CIAT and A2N in the study region, are cer-
tainly a promising tool to improve responsiveness to farmers' needs. Nonetheless, it
obviously involves a long-term learning process for both researchers and farmers to
make this approach more effective. To close the gaps among research, farmers, and
markets, an effective agricultural advisory service has to be implemented. Fourth,
access to agriculture-related market information is essential to overcome informa-
tion asymmetries and attain higher output prices for farm households. Promising
options to spread relevant information through modern information and communi-
cation technologies already exist (Bertolini et al. 2002). Miiro, Esilaba, and Soniia
(2002) confirmed the importance of social networks for the diffusion of informa-
tion in the study region.
It should be noted again that these policy conclusions depend on the model
specification. First, the bioeconomic model does not capture the effect of increased
production levels on local market prices. Second, it does not capture nutrient
dynamics in the soil and the feedback effects among nutrient depletion, soil nutri-
ent content, and crop yield. Capturing these links is essential for further research in
the field of sustainable land management. It is clear that high negative nutrient bal-
ances reduce crop yields in the long run, but it is less clear how the size of negative
nutrient balances is related to output levels. International and national researchers,
extension staff, and policy makers assume that the perceived decline of yield levels
in Uganda is mainly caused by nutrient depletion. To our knowledge, long-term
yield data are still lacking on which to confirm or reject this hypothesis. The ques-
tion of the critical rate at which nutrient depletion causes irreversible and not man-
ageable soil deterioration still remains. If the farm households operate with modest
levels of nutrient extraction below this critical rate, they may be able to invest
returns from agricultural production in physical, human, or social capital and
increase yield levels and household income in the long run.
Notes
1. In this chapter ecologically sustainable agriculture is referred to as the achievement of
nonnegative nutrient balances. This definition is related to the "strong" sustainability definition that
does not allow for substitution of different forms of capital and implies constant stocks of natural
resources (Hazell and Lutz 1998). The "weak" definition of sustainability, in contrast, permits sub-
stitution and thus more flexibility between growth and sustainability objectives. Nutrient imbalances
are just one chemical process beside other chemical, physical, and biological degradative processes
(e.g., acidification, crusting, soil biodiversity reduction). However, because of their comprehensive
role in evaluating the biophysical effects of land management and importance as a major determinant
of yield levels, nutrient balances are widely accepted as sustainability indicators (Lynam, Nandwa,
and Smaling 1998).
LAND MANAGEMENT AND TECHNOLOGY IN EASTERN UGANDA
375
2. For more details see Pender et al. (2001b).
3. Hence, identified development domains can deliver valuable information for the selection
of relevant policy scenarios.
4. A detailed description of the farm trials in the Iganga District is given in Esilaba et al.
(2001).
5. Stratified random sampling was used to select 107 households for the identification of
representative household types. Details of the statistical data analysis and the sampling strategy
can be found in Woelcke (2003).
6. For more details on the modeling approach see Woelcke (2003).
7. The concept of ANN is described in Bishop (1995) and Principe, Euliano, and Lefebvre
(2000). As far as the authors know, neural networks have not been used for yield estimation pur-
poses before. Park and Vlek (2002) examined the possibility of predicting soil property distribution
with ANN.
8. The appropriateness of nutrient balances as an indicator for soil productivity and sustain-
ability assessment has been intensely debated in the literature (Lynam, Nandwa, and Smaling
1998). However, for normative and comparative-static analyses as in this chapter, the indicator is
useful despite its well-known limitations.
9. Permanent off-farm activities were included as binary variables if the interview indicated
relevance of the question. These activities can be of essential economic importance (e.g., in the case
of the commercial farm household, permanent off-farm activities contribute about 60 percent to the
household income).
10. Labor exchange is a traditional form of labor acquisition, where men or women form
working groups, based on the idea of overcoming the labor constraints of its members. It is not
common among group members to pay for labor: occasionally labor is paid in kind.
11. Table 15.3 indicates the model results for the four farm household types on the predomi-
nant soil class. The model results for all identified soil classes in the region are presented in Woelcke
(2003).
12. For more details see Woelcke (2003).
13. The "reduced costs" indicate how far each activity is from entering the optimal model
solution. That is, they indicate by how much the objective function value of each activity would
have to be improved before the activity would be selected as part of the farm plan. The second row
in the table of Figure 15.1 provides a list of potential activities and the changes in their "reduced
costs" in response to changing fertilizer prices. As an example, Figure 15.1 indicates reduced costs of
69,000 Ush for the introduction of the production activity "Maize+NP2," assuming the current fer-
tilizer prices are reduced up to 20 percent of the current prices. This means that the costs of this
production activity have to be reduced by 69,000 Ush before it is profitable to be included in the
farm plan.
14. It should be emphasized that high positive nutrient balances also have negative impacts
on the environment (eutrophication). This effect is neglected in this study because of its low rele-
vance in the study region.
15. For more details see Woelcke (2003).
C h a p t e r 1 6
Strategies for Sustainable
Land Management in the
East African Highlands:
Conclusions and Implications
John Pender, Frank Place, and Simeon Ehui
The studies in this book sought to understand the factors affecting rural
households' choice of income strategies and land management practices and
the implications of these decisions and of policy- and program-relevant fac-
tors for agricultural production, household welfare, and land degradation. We noted
at the outset that the factors influencing these decisions and outcomes are many
and complex and that their effects may be very context-dependent in a region as
diverse as the East African highlands. The findings in the preceding chapters amply
support this hypothesis.
The material presented in Chapters 3ş15 of this book provides a rich and
diverse set of findings. It is impossible to summarize all of these findings in a
few sentences or provide a simple prescription to solve all of the problems of
rural people in the East African highlands based on these results. Because the prob-
lems are complex and situations are diverse, the solutions to the problems are also
likely to be complex and diverse. Still, in this chapter we seek to synthesize what
has been learned from these studies as briefly as possible, relate these findings to the
broader literature on determinants and effects of livelihoods and land manage-
ment, and draw implications for policy makers, development agencies, researchers,
and others seeking to address these problems in East Africa and elsewhere.
378
JOHN PENDER, FRANK PLACE, AND SIMEON EHUI
Synthesis of Research Findings
The qualitative findings of Chapters 3ş15 are summarized in Table 16.1. We orga-
nize the discussion according to the factors about which hypotheses were developed
in Chapter 2, including the effects of factors determining local comparative advan-
tages (agricultural potential, access to markets and infrastructure, and population
pressure), income strategies, land management practices, and other policy-relevant
factors (irrigation, agricultural technical assistance, credit, other programs and
organizations, land tenure institutions, education, and gender). We will discuss
the empirical relationships observed in these studies as "associations" rather than as
"effects" because causality is difficult to prove in any empirical study.1 In some
cases, the findings are based on results of bioeconomic modeling; such findings
are discussed as "predictions" rather than "conclusions," although these models are
based on empirical data collected in the study locations.
Agricultural Potential
Agricultural potential is clearly important in influencing rural households' choice
of livelihood strategies in the East African highlands. In more humid areas having
bimodal rainfall patterns and sufficiently good soils, production of perennial cash
crops such as coffee is common, as in the highlands of central Kenya (Chapter 8),
the Lake Victoria region and the eastern highlands of Uganda (Chapter 7), and much
of southwestern Ethiopia. Perennial food crops are also common in such areas,
but annual food crops (especially maize) are also important in many such areas.
Dairy production and woodlots are also more common in higher-rainfall areas
(Chapter 3), though these also depend on sufficient market access (Chapters 3,
8, and 14).
In less humid environments, cereals and livestock are more dominant in the
farming system, as in northern Ethiopia (Chapters 4ş6 and 9) and in parts of
southwestern and much of northern and eastern Uganda (Chapter 7). Differences
in rainfall, altitude, and other agro-ecological factors influence the choice of cereals
and livestock within the cerealşlivestock system. However, other factors besides
agricultural potential also influence the mixed cerealşlivestock system. For example,
maizeşlivestock production is the dominant farming system in western Kenya, even
though soil and climatic conditions are suitable for production of higher-value cash
crops in this region (Chapter 8). Lack of access to the large Nairobi market and to
market institutions (e.g., cooperatives) is one of the key differences between west-
ern Kenya and the much more prosperous region of central Kenya (Chapter 8).
Land management practices differ between areas of high and low agricultural
potential in complex ways. Several intensive practices are more common in higher-
potential areas (HPAs) where rainfall and soils are more favorable (Chapters 4 and
CONCLUSIONS AND IMPLICATIONS
379
9). This is probably because the productivity effects of soil fertility management
practices such as inorganic fertilizer and leguminous cover crops (LCC) are often
greater in HPAs (Chapters 9 and 13). However, this is not always the case. For
example, fertilizer use is less common on more fertile soils in Uganda (Chapter 11),
probably because it has less influence on productivity on such soils.
As expected, incomes and other welfare indicators are often better in areas
of higher agricultural potential (Chapters 3, 4, and 8). However, the risk of land
degradation can be greater in such areas as well, especially in steeply sloping high-
lands as in Uganda (Chapter 7).
Market Access
Because of its favorable market access as well as its high agricultural potential, cen-
tral Kenya stands out as a fairly anomalous success story in the East African high-
lands. Livelihoods of smallholders in this region are highly diversified, including
cash crops, dairy production, and high levels of nonfarm income (Chapter 8). These
different livelihoods complement each other, with cash and credit from cash crop
production helping to facilitate demand for and investments in other income
strategies such as dairy production and nonfarm activities, and vice versa. As a
result of production of higher-value commodities and greater liquidity, farmers
in central Kenya are able to adopt much higher levels of use of fertilizer and land
improvements than elsewhere and attain higher productivity and more perceived
improvement in soil conditions. This suggests that a virtuous circle of land improve-
ment and higher productivity and incomes is possible in areas with sufficiently
favorable agricultural potential and sufficient access to markets and market institu-
tions to promote high-value commodity production and nonfarm activities.
The effects of better access to markets on income strategies in Kenya are
demonstrated in Chapter 3 by Place et al., who showed that maize is less common
and cash crops are more common closer to urban areas. Similarly, Kruseman et al.
(Chapter 4) found that teff production (an important cash crop in northern Ethi-
opia) is more common, and sorghum and various livestock are less common, closer
to urban markets in Tigray. Place et al. (Chapter 3) also found that woodlots are
more common closer to urban areas in Kenya, consistent with the prediction by
Holden et al. (Chapter 14), based on their bioeconomic model, of large potential
income gains from increased tree-planting activities in northern Ethiopia close to
roads and markets. In these regions, better market access is associated with income-
enhancing strategies and, not surprisingly, with indicators of better welfare outcomes
(e.g., better housing quality) (Chapters 3 and 4).
However, there may be trade-offs between improved income and some natural
resource conditions resulting from better market access. In Kenya, better market
Table 16.1 Summary of qualitative findings of Chapters 3ş15
Value of crop
Characteristics of
Income
Labor
production
Income/cap
development domains
strategies/assets
intensity
Land management practices
per hectare
Land degradation
welfare
Higher agricultural potential
+ higher-value cash crops
Mixed impacts
+ in high-potential
+ erosion in high potential
+ (3,4,8)
(3,7,8)
In higher rainfall areas:
eastern highlands of
Highlands of Uganda (7)
+/ş cereals (4)
+ gully checks, drainage, compost (4), reduced
Uganda (7)
+ ox ownership (4)
tillage, contour plowing, manure, household
+ productivity impact of
ş improved livestock (6)
refuse (9)
fertilizer in higher-
+ dairy production (3)
ş terraces, manure, tree planting (4)
potential areas
+ woodlots (3)
On better soils:
(9, 13)
+ gully checks, drainage, soil bunds, tree
+ productivity impact of
planting (4)
leguminous cover
ş Fertilizer (4, 11), reduced tillage, crop
crops in HPAa (13)
residues (9, 11)
Higher market/road access
+ cash crops (3,4,8)
+ (5)
Closer to urban centers, towns:
+ (5)
ş tree cover (3)
+ (3,4,8)
ş subsistence food crops
ş in HPA (9)
+ fertilizer use (4,8), oxen power (5), land
ş in HPA (9) (road
+ erosion in highlands (7)
(3,4,8)
ş collective
investment (8), reduced tillage, contour
access)
ş perceived land degra-
ş oxen, cows, beehives (4)
woodlot
plowing (9)
dation in C. Kenya (8)
+ oxen, goats (5)
management
ş contour plowing (5), crop rotation, crop
ş tree survival in woodlots
+ dairy (8)
(10)
residues (9, 11), mulch (11), tree planting in
(10)
ş improved livestock (6)
community woodlots (10), guards and
+ woodlots (3, 14)
penalties in grazing land management (10)
Closer to roads:
+ fertilizer use (4,5), burning (5), crop rotation (9)
ş reduced tillage, contour plowing (9)
Higher population pressure
ş barley, maize (4)
+ (5)
+ fertilizer (4,5), oxen power (5), intercropping
ş (9) (in structural
ş tree cover (3)
+ (3, 4)
+ cattle density (3)
+ woodlot
(5), crop residues (9), improved seed in
model)
ş availability and quality of
ş oxen, sheep ownership
management
LPA (9)
grazing land (6)
per household (4)
at moderate
ş fallow (4), reduced tillage (9), contour
+ erosion in highlands (7)
ş cattle ownership (6)
population
plowing (9), fertilizer use in LPA (9),
+ improved livestock (6)
density (10)
ş improved fallow (13)
+ beehives (4)
more tree planting density in woodlots at
+ woodlots (3)
moderate population density (10)b
more hiring of guards to protect grazing
lands and
fewer violations of grazing restrictions at
moderate population level of community (10)
Irrigation
+ barley (4)
+ (5)
+ drainage, stone terraces, tree planting (4),
+ in LPA (9)
+ in HPA (9)
improved seed, reduced tillage (5), ox power
in LPA (9), seed in HPA (9), private pastures
(6), household refuse (9)
ş compost (4), fertilizer (9), improved seed in
LPA (9)
Government agricultural
ş goats (4)
+ fertilizer (9, 11), contour plowing in HPA (9),
+ in lowlands (7)
+ erosion in highlands (7)
extension
crop residues in LPA (9), manure and
+ in HPA (9)
ş tree survival in woodlots
mulch (11)
(10)
ş ox power (5)
ş community contribution to protection of
community woodlots and grazing areas (10)
NGO agricultural technical
+ fertilizer (11)
+ in highlands (7)
ş erosion in lowlands and
assistance
ş manure (11)
ş in lowlands (7)
highlands (7)
Cooperatives
+ maize, oxen ownership
+ in HPA, input
+ irrigation canals (4), seeds (5)
+ (5)
+ (4,5)
(4)
coop. (9)
ş burning (5)
Input coops:
ş barley (4)
ş in LPA, mktg.
Input cooperatives:
+ in HPA (9)
coop. (9)
+ reduced tillage (9), improved seed in HPA (9),
ş in LPA (9)
ox power in HPA (9)
ş crop rotation in LPA manure, household
refuse (9)
Marketing cooperatives:
+ crop rotation in LPA (9)
ş reduced tillage (9)
(continued )
Table 16.1 (continued)
Value of crop
Characteristics of
Income
Labor
production
Income/cap
development domains
strategies/assets
intensity
Land management practices
per hectare
Land degradation
welfare
Local organizations
+ household contributions to protect restricted
(in general)
grazing lands (10)
Food-for-work (FFW)
+ soil and water conservation (SWC) invest-
ş if FFW not used to
ş erosion if FFW promotes
+ (14)
ment if FFW used to promote SWC (14)
promote SWC on
SWC, + erosion if not
ş SWC if FFW not used to promote SWC (14)
farm (14)
(14)
Credit
+ Maize prod. (4)
+ in LPA (9)
+ drainage ditches, tree planting (4), fertilizer
+ in LPA (9)
Limited effect of credit only
Limited effect
+ Dairy, cash crops in
ş in HPA (9)
(5,8), fertilizer in HPA (9), improved seeds
Limited effect of credit
(14, 15)
of credit
C. Kenya (8)
Limited effect
(5), stall feeding (6), reduced tillage (9),
only (14, 15)
only
ş Cattle ownership
of credit only
crop residues in HPA (9)
(14, 15)
(ACSI credit) (9)
(14)
ş improved seed in LPA (9), manure (11)
+ Oxen ownership,
Limited effect of credit only on SWC investment
improved livestock
(14) and fertilizer use (15)
(other NGO credit) (9)
+ in LPA (9)
Income strategies (cf.
Cash crops
+ (5)
+ improved seeds, reduced tillage (5)
+ (7,9)
+ in central
food crops)
ş burning (5)
Kenya (8)
Livestock
ş (5)
ş ox power, burning (5)
+ (7)
+ due to dairy
in C. Kenya
(8)
Nonfarm/off farm
ş (5,14)
+ fertilizer, improved seeds, reduced tillage (5)
+ (7)
+ erosion (14)
+ (14)
ş manure/compost, ox power (5), SWC
ş (14)
investment (14)
Food aid/other asst.
ş (5)
ş manure/compost, burning, intercropping,
+ (5)
ox power (5)
Forestry/woodlots
ş (7)
+ tree cover (3)
+ (3, 14)
Household endowments
Land/farm size
+ reduced tillage (5), contour plowing and
ş (7)
improved seed in LPA (9), fertilizer in HPA
ş in LPA (9)
(9), mulch (11)
ş fertilizer (5,11), manure (11)
Labor
+ (5)
+ reduced tillage, crop residues (9), improved
+ erosion (7)
ş (5)
seed in HPA, crop rotation in HPA (9),
manure (11), fertilizer (11)
ş manure, household refuse (9)
Education
+ (5)
+ improved seed in HPA (9), crop residues (11)
+ availability of grazing land
+ (5)
ş reduced tillage (9), crop rotation and crop
(6)
residues in HPA (9), manure (11)
+ erosion (7)
Gender: female head
ş (5)
+ reduced tillage (5,9), fertilizer (11)
ş (5)
ş (5)
ş in LPA (9)
ş manure/compost (5), ox power (5), contour
ş in HPA (9)
plowing (5), crop residue incorporation (9)
Livestock: oxen
+ (5)
+ ox power (5), manure/compost (5), contour
+ in HPA (9)
ş in HPA (9)
plowing (5), reduced tillage (9), fertilizer in
HPA (9), crop residues in LPA (9)
ş reduced tillage (5), crop rotation in LPA (9),
household refuse (9)
Livestock: other
ş (5)
+ crop rotation, manure, household refuse (9)
+ (5,7)
+ (5, 12)
ş ox power, burning, intercropping (5), reduced
tillage (9), fertilizer in HPA (9), crop residues
in LPA (9)
Land tenure/rights
ş Land redistribution
+ household ownership of
+ crop residue incorporation in HPA (9), use of
+ (9) (in structural
ş quality of grazing land (6)
up to two oxen (6)
stall feeding, crop residues as a feed source
model)
ş ownership of more than
(6)
two oxen (6)
ş ox power, contour plowing, crop rotation and
+ ownership of other
crop residue incorporation in LPA (9);
livestock, improved
fertilizer use in HPA (9)
breeds (6)
(continued )
Table 16.1 (continued)
Value of crop
Characteristics of
Income
Labor
production
Income/cap
development domains
strategies/assets
intensity
Land management practices
per hectare
Land degradation
welfare
ş Tenure security
+ manure use (9), ox power in LPA (9)
+ (9)
ş fertilizer and crop residue incorporation in
HPA (9)
ş Mode of land acquisition
+ on owner-
ş manure (9), improved seeds in HPA (9); ox
ş ownerşoperated plots
(owner-operated versus
operated in
power, contour plowing and seeds in LPA on
in LPA (9)
other)
HPA (9)
owner-operated plots (9)
+ purchased versus
inherited plots (7)
ş Land rights system
+ crop residue incorporation and mulching on
ş erosion on mailo versus
mailo versus freehold plots (11)
freehold plots (7)
ş fertilizer use on customary versus freehold
plots (11)
ş Village level management
+ grazing land availability
of grazing lands
and quality (6)
Land management
ş Investments
+association of
+ association of stone terraces with fertilizer
+ impact of stone
stone
use (5,9) and contour plowing (5,9)
terraces in LPA (5,9)
terraces with
ş association of stone terraces with household
+ impact of live fences
labor use in
refuse (9)
and drainage ditches
LPA (9),
+ association of fences with manure (5,9),
in HPA (9)
fences with
contour plowing (9), household refuse (9),
labor use
ox power in HPA (9), seed use in LPA (9)
(5,9)
ş association of live fences with reduced tillage
(9), crop residue incorporation in LPA (9)
ş Fertilizer
+ (5)
+ in HPA (9, 13)
ş Agronomic practices
ş reduced labor
+ ox power in LPA (5,9),
+ reduced/zero tillage
+ reduced
requirement
seed use (5,9)
reduces erosion,
tillage by
of reduced
+ improved seed in
increases carbon
promoting
tillage (with
HPA (9)
sequestration, increases
higher-
herbicides)
+ reduced tillage (5)
soil moisture (12)
value live-
(12)
+ reduced burning (5)
+ grazing enclosures reduce
stock (12)
+ increased
ş crop residues in LPA
erosion, increase bio-
+ area enclo-
labor require-
(9)
diversity (12)
sures (12)
ment for
+ leguminous cover
+ leguminous cover crops
Limited
leguminous
crops and tithonia
improve nitrogen
income
cover crops
biomass transfer (13)
balance (13)
impacts of
and biomass
Limited productivity
+/ş biomass transfer
most soil
transfer (13)
impacts of most soil
improves nutrient balance
fertility
fertility practices in
in recipient areas,
practices in
eastern Uganda (15)
depletes source areas
eastern
(13)
Uganda
(13, 15)
Note: Chapter numbers in parentheses.
aHPA = higher-potential areas; LPA = lower-potential areas.
bU = U-shaped relationship (e.g., lower at moderate population density);
= inverted U-shaped relationship.
386
JOHN PENDER, FRANK PLACE, AND SIMEON EHUI
access is associated with less tree cover (Chapter 3), and in Tigray better market access
is associated with lower tree survival rates in community woodlots (Chapter 10).
These findings are consistent with others showing that road development is associ-
ated with many indicators of improved welfare, but also with deforestation, in
Uganda (Pender et al. 2004a), as in many other developing countries (e.g., Chomitz
and Gray 1996; Mertens and Lambin 1997; Nelson and Hellerstein 1997).
Market access also influences access to nonfarm opportunities. In the high-
lands of central and western Kenya, nonfarm income accounts for nearly 40 per-
cent of total household income (Chapter 8). The similar share of nonfarm income
in these two regions, despite large differences in total household income between
these regions, suggests that nonfarm activities do not hinder agricultural income
in the more prosperous central highlands. Households in central Uganda close to
Kampala earn a similar share of income from nonfarm activities (Ehui and Pender
2003), but nonfarm income generally accounts for a much smaller share of income
elsewhere in Uganda (Ehui and Pender 2003) and in the northern Ethiopian high-
lands (Pender 2004), where access to urban centers is much less. This is similar to
findings of other literature showing that nonfarm activities and off-farm income tend
to be higher in areas close to urban markets and roads in Africa (Haggblade, Hazell,
and Brown 1989; Reardon 1997; Barrett, Reardon, and Webb 2001).
As expected, market access and high-value crop production contribute to inten-
sification in use of fertilizer and many other inputs in central Kenya (Chapter 8).
Market access also contributes to use of fertilizer and other inputs in Tigray
(Chapters 4 and 5). However, better market access sometimes reduces adoption
of labor-intensive land management practices by increasing the opportunity costs of
labor (Chapters 5, 9, and 11).
Market access also influences collective land management decisions. Gebremed-
hin et al. (Chapter 10) found that communities with better access to markets con-
tribute less labor and plant fewer trees on community woodlots (and have lower
survival rates of the trees planted, as mentioned above), probably because of higher
opportunity costs of labor in such areas and/or because market access increases
people's ability to avoid sanctions for not participating in collective action (Bard-
han 1993). Communities with better market access are also less likely to establish
penalties for violations of grazing restrictions or to pay a guard to monitor their
restricted grazing areas (Chapter 10). Thus, better market access does not assure
better management of natural resources.
Population Pressure
Population pressure also affects households' income strategies. In Kenya, higher pop-
ulation density is associated with higher cattle density and more woodlots (Chap-
CONCLUSIONS AND IMPLICATIONS
387
ter 3). Livestock and tree-planting activities thus appear to be intensification re-
sponses to population pressure. However, although population pressure appears to
contribute to higher livestock density per hectare in Kenya, it is associated with
fewer large animals owned per household in northern Ethiopia (Chapters 4 and 6).
Adoption of improved livestock breeds (Chapter 6) and beekeeping (Chapter 4)
are also associated with population pressure in Ethiopia, suggesting that these are
intensification responses to declining availability of land for extensive livestock
production.
Population pressure contributes to more intensive land management practices,
as hypothesized by Boserup (1965) and many others. Higher population density
is associated with less use of fallow (Chapter 4), higher labor and oxen intensity
in crop production (Chapter 5), more use of fertilizer (Chapters 4, 5, and 11),
and with use of some labor intensive land management practices (Chapters 5, 9,
and 11). However, high population density in much of the East African highlands
likely limits the use of leguminous cover crops in improved fallows because land
scarcity limits farmers' ability to fallow land, even for only one season (Chapter 13).
This argument is supported by other research findings showing that larger farms
are more likely to adopt improved fallows in western Kenya (Place et al. 2002a,
2004) and Malawi (Gladwin et al. 2002). Population pressure also limits use of ter-
races by small farms, because these occupy scarce land (Chapter 14).
Moderate population pressure is associated with more effective collective action
to manage communal resources than low or high levels (Chapter 10). This may be
because the benefits of collective action to manage resources are too low relative to
the fixed cost of organizing it at low population density, whereas the variable costs
of achieving effective collective action and the incentives to violate collective agree-
ments become too high at high population density (Olson 1965; Ostrom 1990;
Sandler 1992; Pender 2001).
Population pressure indirectly affects agricultural production by leading to
smaller farm sizes. Pender et al. (Chapter 7) found that smaller farms achieve higher
crop yields in Uganda, as did Benin (Chapter 9) in lower-rainfall areas of the
Amhara region in northern Ethiopia. These findings are consistent with a large
body of literature showing an inverse relationship between farm size and agricul-
tural productivity in developing countries (e.g., Chayanov 1966; Sen 1975; Berry
and Cline 1979; Carter 1984; Barrett 1996; Heltberg 1998).
Population pressure is associated with better indicators of some aspects of wel-
fare but worsening of natural resource conditions in some parts of the East African
highlands. For example, housing quality (indicated by houses with metal roofs) is
better in more densely populated areas of Kenya and northern Ethiopia (Chapters
3 and 4). On the other hand, tree cover is lower in more densely populated areas of
388
JOHN PENDER, FRANK PLACE, AND SIMEON EHUI
Kenya (Chapter 3), there has been more decline in grazing land availability and
quality in communities where population growth has been more rapid in the Amhara
region of Ethiopia (Chapter 6), and soil erosion is higher in more densely popu-
lated areas of the highlands of Uganda (Chapter 7). These findings are consistent
with those of Pender et al. (2001a), who found that more rapid population growth
was associated with many worsening resource conditions in northern Ethiopia, and
Grepperud (1996), who found greater land degradation in more densely populated
areas of the Ethiopian highlands. They are not consistent with the more optimistic
"more-people, less-erosion" hypothesis that Tiffen, Mortimore, and Gichuki (1994)
found in the Machakos district of Kenya. However, access to urban markets and
technical assistance may have been more responsible than rural population growth
for improved land management in the Machakos district, consistent with the find-
ings of Chapter 8 of improved land management in central Kenya as a result of
these advantages.
Income Strategies
In central Kenya, cash crop production is associated with investments in land
improvement and with greater use of fertilizer and other inputs, resulting in higher
value of crop production, higher incomes, and perceived improvements in land
quality (Chapter 8). In Uganda, bananas, coffee, and horticultural crop production
are also associated with adoption of various intensive land management practices
and higher value of production (Chapter 7; Nkonya et al. 2004). These findings
are consistent with those of Pender et al. (2004a) and Pender et al. (2001a), who
found, based on community surveys in Uganda and Ethiopia, that perennial crops
were associated with more use of several resource conservation practices and more
improvement in several indicators of productivity, human welfare, and natural
resource conditions. Horticultural crops are associated with more use of improved
seeds in Tigray (Chapter 5), although no significant difference in the value of crop
production or income as a result of horticultural production was found there.
Thus, cash crop production contributes to intensification and improved outcomes
in many cases, but not everywhere.
Livestock production is associated with higher value of crop production and
incomes in much of the East African highlands. Dairy production is associated
with higher incomes and better housing quality in Kenya (Chapters 3 and 8). In
Uganda, livestock are associated with more use of manure in crop production
(Chapter 11), higher value of crop production (Chapter 7), and higher household
income (Nkonya et al. 2004). Livestock ownership (especially oxen and other cattle)
is also associated with intensification of crop production in northern Ethiopia (Chap-
ters 5 and 9) and with higher incomes in Tigray (Chapter 5).
CONCLUSIONS AND IMPLICATIONS
389
Tree planting also can contribute to higher incomes and welfare and improved
resource conditions in suitable areas of the East African highlands. In Kenya, Place
et al. (Chapter 3) find that woodlots are associated with better housing quality and
more tree cover. Holden et al. (Chapter 14) predict that eucalyptus tree planting
on degraded lands could substantially increase incomes in their study site in north-
ern Ethiopia, with limited effects on soil and water conservation or erosion of
croplands. These findings are consistent with those of several other studies of the
economic and ecological impacts of woodlots in Ethiopia (Okumu et al. 2002;
Gebremedhin, Pender, and Tesfay 2003; Getahun 2003; Jagger and Pender 2003).
Tree crops are also important sources of income, especially coffee and tea in suit-
able areas, but fruits and nuts also can be important. For example, macadamia trees
are an important source of income in central Kenya (Chapter 8).
Nonfarm activities and off-farm employment can have mixed impacts on agri-
cultural production, reducing labor intensity but increasing farmers' ability to pur-
chase inputs. For example, these activities are associated with less labor-intensive
crop production in Tigray but more use of improved seeds (Chapter 5). The net
effect on crop production is insignificant, but household involvement in nonfarm
activities and off-farm employment increase household incomes (Chapter 5). Holden
et al. (Chapter 14) predict that increased off-farm employment opportunities in
the northern Shewa zone of the Amhara region would substantially increase house-
hold incomes but would also reduce investment in soil and water conservation
(SWC) measures and crop production and increase soil erosion unless off-farm
employment is targeted to promote SWC investment, for example, through food
for work (FFW) programs. These findings indicate potential trade-offs between
promoting increased incomes, increased agricultural production, and reduced land
degradation via income diversification into nonfarm activities. Such trade-offs appear
to be dependent on the context and type of land degradation considered, however.
In Uganda, for example, nonfarm activities are associated with higher value of crop
production (Chapter 7) and less soil nutrient depletion (Nkonya et al. 2004).
Land Management Practices
Investments in stone terraces were found to have substantial positive influences on
crop production in lower-rainfall areas of the northern Ethiopian highlands (Chap-
ters 5 and 9) but not in higher-rainfall areas (Chapter 9). This suggests that the
short-term yield benefits of these investments are largely through conservation of
soil moisture. Pender and Gebremedhin (Chapter 5) estimate that the rate of return
of investments in stone terraces in Tigray averages close to 50 percent, similar to
the rate of return from such investments estimated by Gebremedhin, Swinton, and
Tilahun (1999) based on experiments conducted in Tigray. In earlier research,
390
JOHN PENDER, FRANK PLACE, AND SIMEON EHUI
Herweg (1993a,b) also noted greater yield effects of soil and water conservation
measures in lower-rainfall environments in the Ethiopian highlands. In higher-
rainfall areas of the Amhara region, Benin (Chapter 9) found that investments in
drainage ditches and live fences have significant positive effects on crop yields, sug-
gesting that management of excess water and livestock are of more concern for crop
production in higher-rainfall environments.
By increasing the availability of soil moisture, SWC investments can increase
the profitability and reduce the risks associated with use of inputs such as inorganic
fertilizer (Hengsdijk, Meijerink, and Mosugu 2005). Consistent with this, Pender
and Gebremedhin (Chapter 5) and Benin (Chapter 9) find greater use of inorganic
fertilizer on plots where stone terraces have been constructed. Some organic land
management practices such as manuring are more common on plots where fences
have been constructed (Chapters 5 and 9), possibly because such plots are where
livestock are kept. Exploiting such complementarities can substantially enhance
the profitability and sustainability of land management approaches.
Inorganic fertilizer can contribute to higher productivity, especially in more
favorable environments with sufficient rainfall and good access to markets. Use of
inorganic fertilizer is yielding high returns in the high-potential highlands of cen-
tral Kenya, especially on higher-value crops (Chapter 8). It is also contributing
to substantially higher yields in the higher-potential parts of the Amhara region
in Ethiopia, increasing average cereal yields by more than 50 percent (Chapter 9).
Improved seeds are having a similarly large effect in this favorable environment
(Chapter 9).
However, in less favorable environments, inorganic fertilizer use is much less
profitable and is risky. In drought-prone areas of the northern Ethiopian highlands,
inorganic fertilizer use is not profitable on average (Chapters 5 and 9). A recent
study by Kruseman (2004) confirms the low profitability and high risk of using
inorganic fertilizer in the drought-prone environment of eastern Tigray, predicting
with a bioeconomic model that fertilizer prices would have to be about 50 percent
lower to induce sufficient adoption of fertilizer to stem soil fertility decline. The
results of Holden et al. (Chapter 14) also imply relatively low returns to use of in-
organic fertilizer in their study community in North Shewa. Inorganic fertilizer is
also not very profitable in much of Uganda (Chapter 7; Pender et al. 2004c; Nkonya
et al. 2005b), in part because of low yield response and in part because of high fer-
tilizer prices relative to commodity prices (Chapter 15). Woelcke et al. (Chapter
15) predict using their bioeconomic model that fertilizer prices would have to fall
by more than 90 percent before substantial adoption would be profitable in maize
production in their study villages in eastern Uganda. Inorganic fertilizer will thus
CONCLUSIONS AND IMPLICATIONS
391
not likely be a panacea for soil fertility depletion and low productivity in much of
the East African highlands.
Organic approaches to soil fertility management also have context-dependent
effects. Manure and compost use are associated with higher crop yields in Tigray, as
are reduced tillage and reduced burning (Chapter 5). However, in the Amhara
region and in Uganda, organic practices have statistically insignificant or negative
associations with crop yields (Chapters 7 and 9). The apparently better response
of soils in Tigray to organic inputs may be because of the extremely low organic
matter content of soils in this region, where over 90 percent of the soils are very low
in organic carbon (Haile, Gebremedhin, and Belay 2003) and where soil moisture
is a severe constraint. In drier environments, the benefits of soil organic matter
often result more from its effects on soil moisture infiltration and retention than on
nitrogen availability (Giller et al. 1997). Where soil moisture and organic matter
are less constraining, application of organic materials may be less immediately
beneficial and can actually reduce yields in the near term if the carbon-to-nitrogen
ratio or lignin content of the organic matter is too high because such organic mate-
rials can immobilize available nitrogen (Giller et al. 1997; Chapter 13). The qual-
ity of manure and other organic materials can vary greatly as a result of differences
in animal type and feed sources, soil fertility, how the material is stored, and other
factors (Giller et al. 1997). Such variations may contribute to the low returns to
organic inputs in many cases.
Reduced tillage has more favorable effects on crop productivity in the Tigray
region (Chapter 5) than in the Amhara region (Chapter 9). As with application of
organic inputs, reduced tillage helps to conserve soil organic matter (Chapter 12;
Giller et al. 1997) and improve soil moisture retention, which are critical needs in
Tigray. Aune et al. (Chapter 12) report somewhat higher maize yields on demon-
stration plots using reduced tillage than on plots using normal tillage in higher-
potential areas of the Amhara and Oromiya regions of Ethiopia. Whether such
yield advantages exist under farmers' normal practices in higher-potential areas,
when herbicides are rarely used, is not clear, however. Nevertheless, even if farmers
are able to obtain similar yields with reduced tillage, its use may still be advanta-
geous by helping to reduce tillage costs and land degradation, providing an option
to oxen-poor households, and promoting more remunerative investment in other
kinds of livestock besides oxen (Chapter 12).
Transfer of high-quality biomass sources of nitrogen and phosphorus, such as
Tithonia diversifolia, a common shrub in western Kenya and eastern Uganda, has
shown promising effects in increasing maize yields (Chapter 13). However, using
nonleguminous plants such as Tithonia for biomass transfer only redistributes soil
392
JOHN PENDER, FRANK PLACE, AND SIMEON EHUI
nutrients within the landscape, increasing fertility in one place by decreasing it in
another, and is limited by the high labor costs involved (Chapter 13).
Planting leguminous cover crops, shrubs, or trees as part of an improved fallow
also shows significant potential to increase crop yields in parts of the East African
highlands (Chapter 13). However, such yield increases are often insufficient to
compensate for the loss of at least one season of production and the additional man-
agement and labor costs (Chapter 13). Thus, such improved fallow technologies
are less suited to areas of high population density, where land scarcity is extreme and
fallowing is uncommon (Chapter 13), as in much of the East African highlands,
except in spatial niches such as field boundaries or by farmers who have relatively
large farms (Place et al. 2004). These technologies are also more suited to areas of
higher agricultural potential because the productivity of these leguminous crops is
higher in areas of higher agricultural potential (Place et al. 2004; Chapter 13).
The results in this subsection highlight the context dependence of the effects
of land management technologies. Inorganic fertilizer is most profitable in areas
of high agricultural potential and market access, and vegetative practices such as
improved fallows also appear better suited to areas of high agricultural potential
but intermediate population density. By contrast, some soil and water conservation
investments, organic inputs, and reduced tillage appear to be more profitable in
lower-rainfall areas where their effects on soil moisture retention appear to be more
beneficial.
Effects of Other Factors
The studies in this book also shed light on the effects of several policy-relevant fac-
tors, including irrigation, technical assistance, and credit programs, presence of and
participation in various types of organizations, education, gender, and land tenure
issues. We consider the findings related to these issues in this subsection.
Irrigation
Not surprisingly, irrigation is associated with increased intensity of crop production
in northern Ethiopia (Chapters 4, 5, and 9). Despite this, Pender and Gebremed-
hin (Chapter 5) find insignificant effects of irrigation on the value of crop produc-
tion and household income in Tigray, controlling for use of inputs, land quality,
household characteristics, and other factors. These findings are consistent with those
of Amacher et al. (2006), who also studied effects of irrigation dams in Tigray. That
study and others also found that access to irrigation dams contributes to increased
incidence of diseases such as malaria and schistosomiasis (Tedros et al. 1999;
Amacher et al. 2006). Such costs should be borne in mind in efforts to promote
CONCLUSIONS AND IMPLICATIONS
393
irrigation or other water-harvesting methods (especially at lower elevations). Never-
theless, where irrigation is profitable, households may be willing to pay for mos-
quito nets and other preventive measures (Lampietti et al. 1999).
Part of the reason for low returns to irrigation in Tigray is that farmers' tradi-
tional methods of irrigation use water inefficiently and obtain significantly lower
yields than is possible (Mintesinot et al. 2004). Irrigation dams in Tigray are also
beset by problems of sedimentation because of inadequate conservation of the catch-
ment areas, salinity buildup from seepage and lack of adequate drainage, and bio-
logical contamination of the reservoirs (Mintesinot and Mitiku 2003). In addition,
several institutional and market problems also appear to be limiting the beneficial
economic effect of irrigation investments, including lack of skilled manpower to
ensure proper design of the dams (Egziabher 2003); lower actual than nominal
irrigation capacity of the dams (Hagos, Pender, and Gebreselassie 1999); separation
of organizational responsibilities for constructing the dams, conserving the catch-
ment, and maintaining the irrigation structures (Hagos, Pender, and Gebreselassie
1999); lack of farmer experience with irrigation or with production and marketing
of higher-value perishable crops (Hagos, Pender, and Gebreselassie 1999); lack of
development of marketing facilities and institutions for such crops (Hagos, Pender,
and Gebreselassie 1999); lack of clarity about water rights and their relationship to
land access rights (Tesfay et al. 2000); and lack of a comprehensive irrigation policy
addressing issues of water rights, cost recovery, and other issues (Tesfay et al. 2000).
Benin (Chapter 9) found positive effects of irrigation on crop production
in drought-prone areas of the Amhara region but not in high-potential areas. As
in Tigray, the positive effects of irrigation on crop yields appear to be related to
increased intensity in use of inputs (especially draft power). The effects of irrigation
on crop production may be year specific as well as location specific: there was a major
drought affecting the survey year in Amhara but not in Tigray, which may account
for larger effects of irrigation in drought-prone areas of Amhara than in Tigray.
Irrigation is also associated with more intensive livestock production, includ-
ing greater use of improved breeds, animal health services, and private pastures
(Chapter 6). These associations may result from indirect influences. For example,
irrigation may increase farmers' income and ability to finance purchase of improved
breeds and to provide feed and health care for improved animals. It may also
increase the scarcity of land available for common pasture, thus contributing to
privatization of pastures.
Agricultural Technical Assistance Programs
Access to government agricultural extension contributed to adoption of inorganic
fertilizer and contour plowing in the Amhara region and to higher crop yields in
394
JOHN PENDER, FRANK PLACE, AND SIMEON EHUI
higher rainfall areas of this region (Chapter 9). However, extension has small and
statistically insignificant effects on production in lower rainfall areas of Amhara
and Tigray (Chapters 5 and 9). Hagos (2003) also found statistically insignificant
effects of agricultural extension on income in Tigray, and Demeke and Egziabher
(2003) even found negative effects of the extension and credit program on produc-
tion and income in marginal agricultural areas of Tigray. This is because the tech-
nologies most promoted by the extension program in Ethiopia during the period
studied, inorganic fertilizers and improved seeds for cereals, are profitable mainly
in the high-rainfall areas but less profitable and risky in low-rainfall areas, as noted
earlier.
Involvement of the Bureau of Agriculture's development agents in promoting
establishment of community woodlots in Tigray also tended to undermine collec-
tive action in managing these resources (Chapter 10). Thus, agricultural extension
and regulatory efforts of agricultural bureaus in low-rainfall areas of northern Ethi-
opia appear to have been of limited benefit to farmers during the period studied.
In Uganda, Jagger and Pender (Chapter 11) find a positive association of gov-
ernment agricultural extension with adoption of several land management prac-
tices, including use of fertilizer, pesticides, manure, and mulching. Extension and
training programs also are associated with increased value of crop production
(Chapter 7), especially in the lower-elevation areas. However, agricultural extension is
also associated with greater soil erosion in the higlands of Uganda (Chapter 7), and
in eastern Uganda, extension contributes to soil nutrient depletion by promoting
adoption of higher-yielding varieties without sufficient adoption of soil fertility
management practices (Nkonya et al. 2004). Thus, agricultural extension may lead
to trade-offs between production and sustainability objectives unless the extension
program provides a sufficiently intensive effort to promote improved land manage-
ment practices.
Agricultural technical assistance programs of nongovernmental organizations
(NGOs) also appear to have significant effects on agricultural production in Uganda,
but these are also context dependent. Such organizations are associated with in-
creased use of fertilizer and pesticides (Chapter 11), with higher crop production
in highland areas, and with lower erosion in general (Chapter 7).
In Kenya, Place et al. (Chapter 8) argue that differences in access to technical
assistance cannot account for the large differences in technology adoption and pro-
ductivity between the central and western highlands. Although Chapter 8 does
not statistically test the effects of technical assistance, their argument is supported
by findings of Gautam and Anderson (1999), who found statistically insignificant
effects of the agricultural training and visit extension system in Kenya. Thus, the
CONCLUSIONS AND IMPLICATIONS
395
effects of extension may not be uniformly positive even in areas of high agricultural
potential and favorable market access.
Credit Programs
The availability of credit appears to have had important positive effects on the extent
of agricultural commercialization, diversification, and intensification in central
Kenya (Chapter 8). In Ethiopia, we see less positive influence of credit. In Tigray,
formal credit use is associated with greater use of improved seeds and fertilizer
but has little effect on crop production and income because of limited influences of
these technologies in this environment (Chapter 5; Hagos 2003; Demeke and
Egziabher 2003). Holden et al. (Chapter 14) also predict limited effect of fertilizer
credit on crop production and income in their study community because of the
limited profitability of fertilizer use.
Credit programs also appear to have had relatively limited effect on land
management and crop production in Uganda (Chapters 7, 11, and 15; Nkonya et
al. 2004). Unless profitable technologies are available that can be financed by
credit, there is little reason to expect credit to have a major influence on agricultural
production.
Credit can also affect livestock ownership and management. Availability of
credit from the Amhara Credit and Savings Institution is associated with declining
livestock ownership, perhaps because of forced livestock sales to repay fertilizer
loans during a drought (Chapter 6). By contrast, other NGO sources of credit are
associated with increased ownership of oxen and improved cattle breeds, increased
stall-feeding, and reduced feeding of crop residues (Chapter 6). The effects of credit
thus appear to depend greatly on the focus of the credit program, with programs
oriented toward livestock development having more positive effect on livestock
ownership and management.
Local Organizations
Cooperatives and other local organizations appear to have important effects in
some circumstances. In Tigray, cooperatives are associated with more use of irri-
gation (Chapter 4), more use of seeds and less burning (Chapter 5), higher value
of crop production and income (Chapter 5), and better housing quality (Chap-
ter 4). In Amhara, the effects of cooperatives are more mixed (Chapter 9). Input
cooperatives are associated with greater use of improved seeds and some other
inputs but have mixed effects on yields in Amhara (Chapter 9). Such cooperatives
appear to be promoting use of purchased inputs as a substitute for other inputs in
this case.
396
JOHN PENDER, FRANK PLACE, AND SIMEON EHUI
Local organizations also can influence collective action to manage community
resources. Gebremedhin et al. (Chapter 10) found that communities that have
more local organizations were more likely to establish a penalty system to protect
restricted grazing lands, contributed more per household to protect the grazing
land, and had fewer violations of restrictions. Social capital is thus an important
asset contributing to collective as well as private natural resource management, as
emphasized in much of the literature on collective action and common property
resource management (e.g., Wade 1988; Ostrom 1990; Rasmussen and Meinzen-
Dick 1995; White and Runge 1995; Baland and Platteau 1996; Agrawal 2001;
McCay 2002; Pender and Scherr 2002).
Education
Education can influence agricultural production and household income in com-
plex ways. In western Kenya, the level of education is strongly correlated with use
of chemical fertilizer and higher off-farm income (Chapter 8). In Tigray, primary
education of the household head is associated with more intensive labor use (Chap-
ter 5), and in Amhara, education is associated with more use of improved seeds
in HPAs but less use of reduced tillage, crop rotation, or incorporation of crop
residues (Chapter 9). In Uganda, education is associated with less use of manure
(Chapter 11). However, formal education has little association with the value of
crop production per hectare or income in northern Ethiopia (Chapters 5 and 9),
probably because of the generally low level of education of rural households. In
Uganda, education is associated with higher value of crop production in the high-
lands but lower production in the lowlands, perhaps because of greater off-farm
opportunities available to more educated people in lowland areas close to the main
urban centers of Kampala and Jinja (Chapter 7). Nevertheless, education contributes
substantially to higher incomes in rural Uganda (Appleton 2001; Deininger and
Okidi 2001; Nkonya et al. 2004).
Gender
Gender also influences household income strategies, agricultural and land manage-
ment practices, and outcomes. In western Kenya, female-headed households plant
fewer crops in general and fewer high-value crops and use less fertilizer (Chapter 8).
In northern Ethiopia, female-headed households use less labor and oxen power,
reflecting a cultural taboo against women plowing (Chapters 5 and 9). As a result,
female-headed households in northern Ethiopia obtain substantially lower crop
yields and incomes than male-headed households (Chapters 5 and 9). In Uganda,
female-headed households are more likely than male-headed households to use
fertilizer, and households with more men use more of some labor-intensive land
CONCLUSIONS AND IMPLICATIONS
397
management practices (Chapter 11). Nevertheless, the difference in crop produc-
tion between male- and female-headed households is insignificant in Uganda
(Chapter 7). Thus, in Uganda female-headed households appear able to overcome
labor shortages in agricultural production by using other inputs.
Land Tenure
Land tenure also influences land management and productivity in mixed and
context-specific ways. In the Amhara region of Ethiopia, productivity is higher in
villages where land redistribution has occurred since 1991, even though use of sev-
eral inputs and management practices was lower (Chapter 9). This finding is con-
sistent with findings of Benin and Pender (2001), based on community-level data
for the Amhara region, and suggests that an important short-term effect of land
redistribution is to enable land-poor households who are able to use land produc-
tively to access land.
This does not prove that redistribution increases productivity in the longer
term because this may be undermined by lack of investment in soil and water con-
servation or in soil fertility improvements caused by tenure insecurity related to
expected future land redistributions. For example, other findings in Chapter 9 show
that expected tenure insecurity is associated with less use of manure but more of
inorganic fertilizer, probably reflecting incentives to use inputs that yield short-
term benefits where tenure is insecure. In another study in Ethiopia, Deininger
et al. (2003) found that land redistributions are associated with less investment in
terraces, and expectations of future redistributions are associated with less invest-
ment in both terraces and tree planting.2 Several other studies have also found neg-
ative effects of perceived tenure insecurity on land investments in Ethiopia (Alemu
1999; Gebremedhin and Swinton 2003a; Gebremedhin, Pender, and Ehui 2003).
However, other studies have found insignificant associations of tenure security with
land investments in Ethiopia (Shiferaw and Holden 1998; Holden and Yohannes
2002; Yesuf 2004; Hagos and Holden 2005), so the evidence is not fully clear.
Land redistribution can also influence livestock ownership and management.
Benin et al. (Chapter 6) find that land redistribution was associated with reduced
household ownership of more than two oxen but an increase in ownership of fewer
oxen and in ownership of other livestock. Land redistribution is also associated
with increased adoption of improved animal breeds, stall feeding, and use of ani-
mal health services (Chapter 6). Nevertheless, land redistribution is associated with
more degradation of grazing land quality, probably because it contributes to
increased livestock numbers overall (Chapter 6). Other effects of land redistribu-
tion can include changes in intrafamily relationships (e.g., dependence of children
on their parents for access to land), conflicts over land access, reduction in social
398
JOHN PENDER, FRANK PLACE, AND SIMEON EHUI
differentiation and economic mobility, changes in poverty and destitution, effects
on migration, and others (Bauer 1987; Amare 1994; Abate 1995; Amare 2003),
though these were not examined in the studies in this book.
Studies in this book found mixed effects of the mode of land acquisition. In
Amhara, Benin (Chapter 9) found that use of several inputs and land management
practices is lower on owner-operated plots than on leased in (mostly through share-
cropping) or borrowed plots and that yields were also lower on owner-operated
plots in low-rainfall areas. This is contrary to predictions of inefficiency of share-
cropping (Shaban 1987; Otsuka and Hayami 1988) and findings from studies else-
where in Ethiopia, which find that productivity is either lower (Ahmed et al. 2002;
Pender and Gebremedhin 2004) or insignificantly different on sharecropped than
on owner-operated plots (Gavian and Ehui 1999; Pender and Fafchamps 2005).
Benin's finding of lower productivity on owner-operated plots was not robust when
a household-fixed effects model was estimated, however, so not too much should
be inferred from this anomalous result.
Land tenure also has mixed effects in Uganda. Ugandan farmers are less likely
to use fertilizer on customary than freehold plots but are more likely to incorporate
crop residues and use mulching on mailo than freehold plots (Chapter 11). Farmers
with freehold plots appear to be more oriented toward using cash inputs than other
farmers, whereas mailo holders use more labor-intensive methods. Nevertheless,
Pender et al. (Chapter 7) do not find statistically significant differences between the
value of crop production on plots of different tenure, though they do find lower
erosion on mailo plots, probably because of greater production of less erosive peren-
nial crops on mailo land. The limited productivity effect of freehold land tenure in
Uganda is similar to findings of several other studies of the effects of land titling
in Africa (e.g., Atwood 1990; Barrows and Roth 1990; Migot-Adholla et al. 1991;
Place and Hazell 1993; Platteau 1996). Interestingly, the value of crop production
is greater on purchased than inherited plots in Uganda, suggesting that farmers
adopt a more commercial and intensive approach to use of purchased plots in order
to justify their investment (Chapter 7).
Summary of Findings
As hypothesized, many of the factors considered have complex and context-specific
associations with households' income strategies, land management practices, agri-
cultural productivity, household income, and land degradation. Among the more
general and robust findings are the findings that:
Ě Agricultural productivity, household incomes, and welfare indicators tend to be
greater in areas of higher agricultural potential and better market access.
CONCLUSIONS AND IMPLICATIONS
399
Ě Adoption of purchased inputs such as inorganic fertilizer tends to be greater in
areas of better market access.
Ě Population pressure and smaller farm sizes are associated with intensification
of agricultural production, but also with land degradation, in many cases.
Ě Cash crop production is associated with adoption of purchased inputs and
higher value of crop production per hectare.
Ě Nonfarm activities are associated with increased adoption of purchased inputs
and household income but also with lower labor intensity in agricultural
production.
Ě SWC investments and some organic measures have more immediate effect on
productivity in moisture-stressed environments, whereas inorganic fertilizer
and some vegetative agronomic practices are more effective in HPAs.
Ě Access to credit has limited influence on technology adoption and outcomes
unless the market environment and the profitability of technologies is
adequate.
The effects of other factors, such as irrigation, agricultural technical assistance, local
organizations, education, and land tenure systems appear to be more context de-
pendent. Further research efforts could usefully focus on such context-dependent
effects, investigating what about the context leads to better land management and
outcomes in some circumstances and less so in others, and how to devise more
effective strategies for sustainable land management taking such contextual factors
into account.
Although further research on effects of specific factors in specific domains is
still needed, several implications for policies and programs can be suggested based
on the findings of this book.
Policy and Program Implications
The research findings discussed above imply that no single policy strategy or pro-
gram will be able to solve the problems of land degradation, low agricultural pro-
ductivity, and poverty throughout the East African highlands. To achieve positive
and sustainable effects, policies and programs must account for the diversity and
complexity of situations in the East African highlands. A broad portfolio of invest-
ments by both public and private sectors in physical, human, natural, financial,
400
JOHN PENDER, FRANK PLACE, AND SIMEON EHUI
and social capital will be needed to achieve sustainable effects, but the socially profit-
able mix of those investments will vary as a result of differences in comparative
advantages of different livelihood and land management options in different con-
texts, as influenced by differences in agricultural potential, access to markets, pop-
ulation density, and other factors. In this section we suggest strategies for different
development domains in the East African highlands, followed by consideration of
more general lessons relating to some specific policy and program issues, drawing
on the broader literature as well as the findings in this book.
Although we seek to account for the heterogeneous environments in the East
African highlands, it is not practical to develop strategies for every possible situa-
tion. The conceptual framework and research findings in this book can be helpful
to target strategies to the most important domains in the highlands. For simplicity,
we consider options for only three broad domains: (1) areas with high agricultural
potential and favorable market access, (2) areas with high agricultural potential but
less favorable market access, and (3) areas with lower agricultural potential. We
consider variations in other dimensions, such as population pressure, where relevant
to the discussion.
Areas of High Agricultural Potential and Favorable Market Access
In areas of high agricultural potential and favorable access to large urban markets,
a virtuous circle is possible, involving increased production of high-value com-
modities and increased nonfarm activities, all contributing to higher incomes
and increased ability and incentive of farmers to invest in land-improving and
productivity-enhancing technologies, helping to increase production of high-value
commodities. In central Kenya, this virtuous circle was stimulated by the availabil-
ity of the large and growing market in Nairobi, the development of infrastructure
and proximity of processing facilities, and the presence of cooperatives providing
credit and market outlets for high-value products (Chapter 8). It also built on the
presence of a local merchant class with considerable international trading experi-
ence and development of long-term relationships between Kenyan exporters and
overseas buyers and distributors (Jaffee 1995).
These advantages are not present to the same extent elsewhere in the East
African highlands, though government policies and government and NGO pro-
grams can help to develop some of these advantages. For example, cooperative devel-
opment in Ethiopia and Uganda has been set back by the politicization and poor
performance of cooperatives in these countries during the tenures of the Marxist
Derg regime in Ethiopia and of Idi Amin and Milton Obote in Uganda. Coopera-
tives are again developing in these countries. For example, dairy cooperatives are
being promoted in periurban areas around Addis Ababa, though their coverage is
CONCLUSIONS AND IMPLICATIONS
401
still quite limited (Holloway et al. 2000). It will take significant investment cap-
ital and a supportive policy environment (e.g., avoidance of politicization or exces-
sive government regulation and taxation) to help nurture the development of such
organizations. Development of infrastructure in periurban areas, including roads,
electricity, and communications, is also needed to promote such private sector
development.
Where such investments in high-value commodities are taking place, small
farmers' opportunities to profitably use purchased inputs such as fertilizer, improved
seeds, pesticides, and animal feed will be increasing. In this context, provision of
agricultural technical assistance and credit promoting adoption of such high-value
commodities and inputs can yield high returns, as seen in central Kenya. The
potential to adopt labor-intensive land management practices such as use of manure,
compost, and biomass transfer is also likely to increase, both because of higher
return to labor inputs in high-value commodity production and because of increased
availability of manure as a result of dairy and other intensive livestock develop-
ment. Technical assistance and credit programs should be designed with these
opportunities in mind.
In some areas of high agricultural potential and favorable market access, such
as in central Uganda, pest and disease pressure are severe constraints to intensive
livestock and high-value crop production because of the lower elevation and more
humid climate in this region. Efforts to address these pest and disease problems
(for example, tsetse fly eradication or control efforts) are important public goods
that are required before substantial realization of the potential will be possible.
Even when pest control can be done privately, such as using pour-on insecticides,
the degree of collective cooperation in such efforts is critical to their success (Swal-
low et al. 2002). Thus, factors affecting the ability to attain cooperation, such as
distance to treatment centers, ethnic heterogeneity, and the nature of local govern-
ments, should be taken into account in designing programs for pest and disease
control.
Areas of High Agricultural Potential but Less Favorable Market Access
In areas of relatively high agricultural potential but more remote from major mar-
kets, such as the highlands of western Kenya, eastern and western Uganda and much
of the southern and western highlands of Ethiopia, the comparative advantage is
likely more in nonperishable and readily transportable commodities such as coffee
and cereals (coffee in more humid areas, cereals in less humid areas) and livestock
(more in live animals and skins than dairy). These areas have been suffering from
low world prices of both cereals and coffee in recent years, which, together with elim-
ination of input subsidies, liberalization of foreign exchange markets, and regional
402
JOHN PENDER, FRANK PLACE, AND SIMEON EHUI
trade restrictions (especially affecting livestock), has reduced the profitability of
using inputs in agricultural production. Pests and diseases are also serious problems
for these commodities in many areas and reduce the expected return and increase
the risks of expenditures on inputs. As a result, use of such inputs is not very prof-
itable in many of these areas, and efforts to promote their use through extension
and credit are unlikely to be very successful without major changes in the market
environment.
In such environments, promotion of improved technologies can lead to in-
creased soil nutrient mining as farmers adopt improved seeds (which are often
profitable) without adequate use of fertilizer or other soil fertility management
practices (which are often unprofitable in the near term) to restore the nutrients,
thus increasing depletion of soil nutrients through increased harvest. Identifying
and disseminating profitable technologies for restoring and maintaining soil fertil-
ity are critical in such circumstances. Positive results have been demonstrated for
some agroforestry practices such as improved fallows and biomass transfer, but wide-
spread adoption has been limited by land and labor constraints as well as by limited
awareness of these technologies in much of the East African highlands. These tech-
nologies have shown sufficient promise that broader efforts to disseminate them
are warranted, but the importance of land and labor constraints implies that these
practices are unlikely to be widely adopted everywhere, even when they are capable
of increasing crop yields substantially. Thus, efforts to develop suitable and profit-
able technologies consistent with the constraints faced by small farmers in these
environments are still urgently needed.
Agroforestry and other vegetative approaches to livelihood diversification,
provision of fodder and fuel supplies, and soil fertility improvement also may be
constrained by free grazing of livestock, as is common in the Ethiopian highlands
(Amede 2003). Development and enforcement of local community bylaws regu-
lating this practice may be necessary to attain the potential of such technologies
(Amede 2003). Given the long-standing tradition of the free grazing system and its
importance to the livelihoods of rural households in Ethiopia, such changes should
not be imposed by governments or widely promoted without adequate understand-
ing of the implications of such changes. Any changes in such long-standing insti-
tutions are likely to fail unless they are initiated and owned by local communities
themselves and brought about through processes that are perceived as fair by all
stakeholders at the local level.
Although not profitable in all areas, some use of inorganic fertilizer is usually
necessary to address deficiencies of some plant nutrients (such as phosphorus). This is
profitable (often in combination with other technologies) in many higher-potential
areas of the highlands, such as in western Amhara in Ethiopia and in parts of the
CONCLUSIONS AND IMPLICATIONS
403
eastern highlands of Uganda and western highlands of Kenya. The potential value of
inorganic fertilizer in such areas should not be discounted simply because farmers
face cash constraints. Such constraints can be addressed through fertilizer credit
programs, as has occurred in Ethiopia, which are effective where fertilizer use is
profitable. The problem then becomes the potential for successful adoption of
fertilizer and improved seeds to cause a collapse in output prices as a result of
poorly developed infrastructure, markets, storage, and marketing credit systems, as
occurred in high-potential maize-producing areas of Ethiopia in 2001 and 2002.
Development of market infrastructure and institutions, such as roads, trans-
portation and storage facilities, grades and standards, a market information system,
and marketing credit (e.g., through a warehouse receipts system) is critical to help
avoid such price collapses (Gabre-Madhin and Amha 2003) and can help to make
use of fertilizer and other inputs more profitable in general. Local purchasing of
grains for food aid and emergency reserve needs can also help to prevent dramatic
declines in prices that undermine farmers', consumers', and traders' confidence in the
market, though care should be exercised to avoid the opposite problem of causing
sharp price rises that contribute to food insecurity. Beyond this, promoting devel-
opment of an intensive livestock industry (e.g., poultry, pigs, beef fattening, dairy)
in areas close to urban markets can stimulate the demand for maize and other feed
grains from outlying areas having comparative advantage to supply this demand, pro-
viding a source of longer-term growth as well as helping to dampen price variability
because of the higher elasticity of demand for feed supplies than for food supplies.
Improvements in markets for coffee are also needed in high-agricultural-
potential areas. Although East African producers have limited ability to change
world market prices, they can focus on earning higher returns for their coffee by
investing in quality improvement and promoting coffee production for high-value
specialty markets (e.g., for organic coffee, shade-grown coffee, fair trade coffee, appel-
lation zones) (You and Bolwig 2003). Much of the coffee produced in East Africa
is grown using organic methods and under shade conditions; thus, qualifying for
certification should be feasible, though it is costly and subject to numerous require-
ments. Development of cooperatives can help to meet the requirements and reduce
transaction costs per farmer of compliance. For example, the Kawacom Organic
Coffee Project in Uganda has organized 14,000 farmers in farmer groups and is
exporting about 1,000 tons of organic coffee annually (Parrott and van Elzakker
2003), and in Ethiopia there are about 23,000 farmers involved in organic coffee
production through 35 cooperatives (Parrott and Kalibwani 2005). Organizations
in several East African countries (Uganda, Kenya, and Tanzania) are pursuing devel-
opment of accredited certification bodies and standards, which will help to reduce
the costs of certification in the future (EPOPA 2004).
404
JOHN PENDER, FRANK PLACE, AND SIMEON EHUI
Although there is potential for increased value from specialty coffees, this poten-
tial should not be oversold, as the market for these coffees is thin, and many coun-
tries are trying to exploit these opportunities, so the price advantages of producing
these are likely to be bid down as more producers enter these markets. Improve-
ments in the technology and marketing systems of more standard coffee varieties
should also be pursued and may benefit more coffee producers in the East African
highlands. Among the more promising options include development and dis-
semination of disease-resistant and higher-yielding varieties, improved regulation
of coffee quality, investments in improved infrastructure and transportation, devel-
opment of institutions to reduce traders' risk, such as a forward auction (Schluter
2003), and establishment of a warehouse receipts system (being considered in
Ethiopia) to facilitate provision of marketing credit (Ehui and Pender 2003). The
market potential may be greater for arabica (produced in highland areas of Ethiopia,
Kenya, and Uganda) than for robusta coffee (most common in Uganda at lower
elevations) because of heavy competition from low-cost robusta production from
Brazil and Vietnam (You and Bolwig 2003).
Improvements in food production are likely complementary to increasing cof-
fee or other high-value cash crop production. In densely populated remote areas
such as in much of southwestern Ethiopia, small and declining farm sizes and high
transportation costs may cause farmers to reduce production of coffee in order to
produce sufficient food for subsistence (Technical Committee on Agroforestry in
Ethiopia 1990; Westlake 1998). Increasing productivity of food crops may there-
fore help farmers save land for cash crop production, whereas cash crop production
enables farmers to be able to afford to purchase inputs for intensive food crop pro-
duction. Such complementarities between cash and food crop production should
be recognized by technical assistance programs.
Woodlots can be highly profitable in densely populated higher-potential areas
and can help to reduce pressure on natural forests and depletion of soils caused by
burning of dung and crop residues, as is common in Ethiopia. Provision of nurs-
eries and technical assistance helps to promote these. Policies that undermine wood-
lot development, such as excessive regulation of community woodlots and prohibi-
tion of tree planting in arable areas, as exist in the Tigray region of Ethiopia, should
be reconsidered.
Areas with Lower Agricultural Potential
In lower-potential areas, as in the highlands of eastern Amhara and Tigray in
Ethiopia, the comparative advantage is not in coffee production, and in most cases
also not in intensive cereal production using high levels of inputs. We have seen
that the profitability of inputs such as fertilizer and improved seeds is low in these
CONCLUSIONS AND IMPLICATIONS
405
areas, and as a result, agricultural extension and credit promoting them have had
limited influence. Investments in some soil and water conservation practices and
use of some land management practices such as reduced tillage and use of manure
and compost have shown more promise as a result of low organic matter and soil
moistureşholding capacity of the soils of these areas. Targeted use of costly inputs
such as fertilizer and improved seeds in combination with soil and water conserva-
tion or water-harvesting measures to ensure adequate soil moisture to enhance the
effectiveness of such inputs is likely to be more effective than blanket use of inputs.
Agricultural technical assistance programs are likely to be more effective if they take
such potential synergies into account.
Livestock are very important in the livelihood strategies of most households
in the lower-rainfall highlands, as in much of the higher-rainfall highlands. Cattle
(both oxen and other cattle) contribute to higher value of crop production, both
directly through use of ox traction and indirectly through increased availability
of manure. However, the potential to increase incomes through cattle ownership
appears to be greater for cows than for oxen in parts of northern Ethiopia, consis-
tent with the promising effects of reduced tillage found in this environment.
Opportunities to promote a shift away from dependence on oxen where reduced
tillage is profitable should be explored, as this can enable increased emphasis on
more profitable livestock, provide better opportunities to female-headed house-
holds and oxen-poor households, and reduce degradation of grazing lands (Chap-
ter 12). Other livestock (e.g., small ruminants and poultry) can also yield relatively
high returns in this environment, though livestock are a risky asset in drought-
prone areas because they are susceptible to substantial losses during drought years
as a result of feed shortages and price collapses resulting from herd liquidation.
Thus, efforts to develop rural financial institutions, providing farmers remunera-
tive and less risky savings alternatives to holding livestock as a store of wealth, could
be helpful.
Efforts to improve water, feed, and fodder availability and quality are needed
to achieve the potential contribution of livestock in such environments. Invest-
ments in small-scale irrigation and water harvesting, as are being promoted in
drought-prone areas of Ethiopia, can have benefits for livestock as well as for crop
production (Sileshi, Tegegne, and Tsadik 2003), though most emphasis has been
on crop production. Improved management of communal grazing lands is also
needed. Although many communities in northern Ethiopia are protecting some
of their grazing lands (Chapter 10), there is little investment in planting fodder
trees, shrubs, or grasses in most such areas. Without investments in increased bio-
mass productivity of such areas, the productivity of livestock will continue to be
limited by the productivity of the natural vegetation growing in communal areas
406
JOHN PENDER, FRANK PLACE, AND SIMEON EHUI
and the limited availability of crop residues. Availability of appropriate technical
assistance, credit, and health facilities oriented toward improved livestock produc-
tion can also be very helpful, as suggested by the positive effects of some NGO pro-
grams on livestock development in the Amhara region (Chapter 6). Continued
efforts to provide vaccination and animal health services are also needed.
Improved management of communal lands can also contribute to increased
income from forestry and related activities, such as beekeeping. Tree planting is one
of the most potentially profitable investments available to communities in these less-
favored environments and can contribute to increased agricultural production and
improved land management by reducing the need to burn dung and crop residues
for fuel, enabling more of these materials to be recycled to the soil ( Jagger and Pender
2003). However, the effectiveness of collective action to manage community wood-
lots in northern Ethiopia has been undermined by a regulatory approach that has
limited communities' sense of empowerment to harvest poles and other materials
from the woodlots. Devolution of real authority over community woodlots to local
communities, groups, or households is needed to achieve their potential ( Jagger,
Pender, and Gebremedhin 2005). There is also potential to promote tree planting
through allocation of degraded communal lands for private tree-planting activities, as
is being promoted in Tigray and Amhara. Such efforts have shown promise of achiev-
ing higher survival rates of trees and higher economic returns with less intensive labor
input than on community woodlots, though it is still too early to be sure of their
effects ( Jagger, Pender, and Gebremedhin 2005). Even on these privately managed
woodlots, most households still require permission to be able to harvest poles, which
may undermine their incentive and ability to manage these woodlots profitably.
Beyond relaxing such regulations, governments should also reconsider other
policies that restrict tree planting, such as the provisions of Tigray's 1997 land policy
proclamation banning planting of eucalyptus trees or prickly pear cactus on cul-
tivable land. The economic returns to tree planting can be much higher than the
returns to crop production, tree planting can increase a household's food security
by providing a source of income in a drought or other calamity, it frees labor that
may be used more profitably in off-farm activities or other pursuits, and the envi-
ronmental effects (though often hotly debated) are not clearly negative relative to
annual crop production (Getahun 2003; Jagger and Pender 2003). Where there
is serious concern about the effect of eucalyptus or other trees in arable lands on
neighboring farmers or water sources (e.g., negative effects on availability of water,
nutrients, or sunlight), local communities may find better ways to address this con-
cern than an outright ban, such as by regulating tree planting to be a minimum
distance from neighbors' fields or water sources. Continued promotion of tree plant-
ing through technical assistance and provision of nurseries is also important.
CONCLUSIONS AND IMPLICATIONS
407
Investments in irrigation are also needed where this is feasible and profitable,
especially in drought-prone environments. We have seen that small-scale irriga-
tion can have large positive effects on production in such environments (Chapter
9), but this is not always the case (Chapter 5). Careful study is needed to better
understand the extent to which small-scale irrigation is succeeding or failing in
these contexts and the main factors contributing to success or failure. Policies and
investments to address the problems discussed earlier, such as inefficient tradi-
tional irrigation practices, lack of trained manpower to design irrigation structures,
lack of coordination between organizations promoting irrigation development
and those responsible for maintenance of irrigation structures and watershed con-
servation, and the need for technical assistance, credit, infrastructure, and institu-
tions to facilitate production and marketing of higher-value irrigated crops could
be very helpful in attempts to ensure that irrigation investments achieve their full
potential. The problems limiting the effectiveness of microdams and other small-
scale irrigation investments, and the negative health effects of these investments,
should raise a cautionary flag concerning efforts to rapidly promote other water-
harvesting approaches such as the small ponds for supplementary irrigation that
are now being widely promoted in Ethiopia. There is a need to assess the problems
and constraints that may lead to worse than anticipated results of these invest-
ments before they are adopted on a massive scale. Targeting such investments to
areas where the benefits are substantial and the health and other risks are low (e.g.,
higher elevations), or making these investments in combination with other invest-
ments in necessary health measures (e.g., mosquito nets), may be a more effective
approach.
Regardless of what is done to promote improved agricultural production in
less-favored areas of the East African highlands, these areas are likely to remain
food-deficit areas and dependent to a significant degree on off-farm income for the
foreseeable future. Food-for-work programs account for a substantial share of
household income in drought-prone areas such as Tigray and eastern Amhara (Pen-
der 2004), acting as employment guarantee schemes and an important means of
preventing droughts from causing major famines. Efforts to promote develop-
ment of the nonfarm economy in these regions will continue to be important, for
example, through public investments in infrastructure, education and vocational
training, and attraction of private investment in industry. Until such efforts have
succeeded in bringing much broader development of the nonfarm economy,
employment guarantee schemes through food-for-work or other mechanisms will
continue to be needed as a safety net in these areas to prevent famines and the
downward spiral of asset liquidation, declining production, increasing poverty, and
land degradation that such famines can trigger (Amare 2003). However, this should
408
JOHN PENDER, FRANK PLACE, AND SIMEON EHUI
be done in a way that minimizes disincentives to pursue productive alternative
livelihood strategies or make productive investments.
Policy and Program Lessons
A primary lesson of the studies in this book is the critical importance of identify-
ing and promoting profitable income strategies and land management practices in
different biophysical and socioeconomic contexts. This lesson appears obvious but
needs to be emphasized because technical assistance and credit programs some-
times attempt to promote activities and technologies that are not profitable in
many contexts. The ineffectiveness of agricultural extension and credit focusing on
promoting fertilizer and improved seeds in drought-prone areas of northern Ethi-
opia is a clear example, but there are many others highlighted in the case studies of
this book.
Profitability depends not only on the price of outputs and purchased inputs
but also on the opportunity costs of nonpurchased inputs such as land and family
labor. Despite impressive effects of many organic technologies on crop yields in
many settings, these technologies often entail high land or labor costs that make
the technologies unattractive to farmers, as argued by Delve and Ramisch in Chap-
ter 13. Such costs must be taken into account in efforts to promote technologies.
Identification of what domains and for what types of households such costs and
constraints are likely to be prohibitive can help in targeting technical assistance
efforts. For example, improved fallow technologies are not likely to be widely
adopted in very densely populated areas, except in niches such as along field bound-
aries or on degraded plots; and highly labor-intensive technologies are less likely to
be adopted by extremely labor-constrained households, such as female-headed
households and HIV-affected households.
Technical assistance programs are more likely to be successful in identifying
and promoting profitable technologies if they take a farmer-centered, demand-led
approach and provide farmers with a broad menu of options rather than a very
narrow package of technologies. Top-down, target-driven approaches to technical
assistance are likely to fail, as shown in this book and in numerous other studies.
Farmers need information about the potential profitability of alternative livelihood
and land management options in different contexts, and not just blanket recom-
mendations to maximize yield or minimize soil erosion, which are unlikely to be
their primary objectives. Farmers also need information about postharvest and mar-
keting technologies, prices and marketing options, especially for newer commodities
with which they are less familiar.
CONCLUSIONS AND IMPLICATIONS
409
The profitability of land management practices can be increased in several ways.
Where high-value crops are agronomically and economically feasible, the return to
applying labor and other inputs intensively is generally higher for such crops. Thus,
promotion of cash crops, where feasible, together with suitable land manage-
ment practices can help to promote more profitable and sustainable land man-
agement. Development of improved technologies, such as drought-tolerant or
more fertilizer-responsive crop varieties can also help increase the profitability and
reduce the risks associated with fertilizer or other inputs. Continued applied research
and dissemination of improved land management options, such as agroforestry,
improved forages, and other promising technologies for specific recommendation
domains, are also needed. Investments in infrastructure and market institutions
can help to increase the profitability and reduce the market risk of producing high-
value crops as well as other commodities. However, it is important to have realistic
expectations about how much can be accomplished by such investments and where
they will have the most near-term influence. Where such investments can enable
expansion of what is already a highly profitable enterprise, such as dairy production
in periurban areas, they will likely yield high returns in the near term. By contrast,
investments in road building in remote areas will likely not have major effects on
agricultural production or household incomes in the near term. Being a two-hour
walk to the nearest all-weather road or town instead of three hours likely makes lit-
tle difference in terms of farmers' current livelihood or land management options.
Nevertheless, construction of roads and other infrastructure is an important step
toward longer-term rural development, and its importance should not be discounted
even if it does not show immediate effects. Such investments are part of the long-
term development process.
Development of farmer organizations, such as cooperatives, can be very help-
ful where there are potentially profitable commodities for such organizations to
promote, by reducing transactions costs in acquiring inputs or marketing outputs,
and providing access to credit and technical assistance. However, as with most
interventions, such organizations are not a panacea, and we have seen examples
where these are not associated with higher production or incomes. Further research
is needed to identify what circumstances favor the success of such organizations,
but certainly the profitability of the commodities that they deal with is one of the
primary factors.
In addition to expected profitability, risk is also, of course, important to farmers
in the East African highlands. For farmers in high-potential areas, weather risk is
often less important than market risk, and addressing this requires development of
market infrastructure and institutions, as discussed previously. Problems of pest and
410
JOHN PENDER, FRANK PLACE, AND SIMEON EHUI
diseases are also a major concern, especially (but not only) in humid environments,
and investments in appropriate infrastructure, collective action, research, inputs, and
technical assistance are critical to addressing these concerns (e.g., vaccination cam-
paigns, tsetse eradication efforts, human and animal health facilities, development
of disease- and pest-resistant varieties, training in integrated pest management).
In drought-prone environments, weather risk is usually the primary concern.
Coping with risk is of necessity a constant preoccupation of poor households in
these environments. Livelihood and commodity diversification is one common
strategy that households pursue to address risk as well as for other reasons (e.g., to
more fully utilize labor and other household resources or to exploit economies of
scope among different activities) (Barrett, Reardon, and Webb 2001). Education,
technical assistance, and credit programs should recognize the importance and
potential of the variety of income strategies that households may pursue, facilitat-
ing options and not focusing too narrowly on a particular commodity or set of land
management technologies.
Irrigation, other water-harvesting technologies, and soil and water conserva-
tion measures can help to reduce risk and increase profitability of agricultural pro-
duction, especially in drought-prone environments. However, such efforts must be
carefully designed and implemented (especially if done on a large scale) to address
the technical, institutional, and market problems such as have been discussed in the
context of Tigray (but which are likely not limited to Tigray). This need appears to
be at odds sometimes with the desires of policymakers and program managers, who
may feel pressure to rapidly scale up such efforts and achieve broad consequences.
In some cases, the availability of food aid or other assistance or the goal of provid-
ing employment may contribute to the desire to implement public works projects
rapidly and on a large scale, even if production or conservation objectives may not
be adequately served (Bantirgu 2003). Because irrigation and water-harvesting
projects can have substantial negative health and environmental effects as well as
being costly to implement and maintain, it is advisable for policymakers and devel-
opment agencies to resist such pressures and take a more careful approach to ensure
that such negative effects can be minimized, while the economic and social benefits
of such projects are maximized.
Education can contribute substantially to households' livelihood options and
to household income, although these occur only in the long-term. In some cases,
this will also contribute to improved land management. However, this will not
always be the case, as more educated households are sometimes less prone to adopt
labor-intensive land management practices. This is not an argument not to invest
in education, but it suggests that the potential trade-offs of improved education for
land management should be recognized and addressed. For example, incorporating
CONCLUSIONS AND IMPLICATIONS
411
teaching about the principles of sustainable land management into educational cur-
ricula could help to improve farmers' capacity to innovate and adapt technologies
to their particular circumstances.
Even when profitable and risk-reducing technologies are available, they may not
be adopted by households because of the constraints that they face. For example,
fertilizer and improved seed use are often constrained by farmers' lack of access to
cash and credit, even where they would be profitable. Improved fallows are con-
strained because of farmers' lack of land. Application of organic materials is often
limited by scarcity and competing uses for these materials and by labor constraints.
Knowledge constraints may also limit adoption of many natural resource manage-
ment technologies (e.g., integrated pest management, integrated soil fertility man-
agement) that require adequate understanding of local conditions and the principles
underlying the technologies to adapt them to local conditions. Many of these con-
straints may be binding for smallholders in the East African highlands; thus, an inte-
grated approach that accounts for and addresses multiple constraints is needed.
Special attention is needed to address the constraints of women farmers. As we
have seen, in some places they are disadvantaged by cultural norms. They often face
much tighter labor constraints than male farmers and male-headed households, and
women are sometimes inhibited from making decisions about land investments
and land management practices while their husbands are away, as seen in western
Kenya. Addressing these problems requires special attention in agricultural research,
technical assistance, education, training, and credit programs to provide livelihood
and land management options that are suitable to the circumstances of women
farmers. Households affected by HIV/AIDS and other diseases also require special
consideration, particularly when labor-intensive methods are being promoted.
Land tenure policies and traditions also sometimes discriminate against women
farmers. For example, households that move away from their village in northern
Ethiopia for more than two years lose access to their land; this restriction may be
very limiting to a widow who is not able to farm productively but is prevented
from moving to town where she may have better employment opportunities.
Addressing such problems requires changes in social attitudes as well as policies.
Land tenure issues have implications beyond the effects on female farmers,
especially regarding the means of acquiring land. In Ethiopia, where land sales
are prohibited, alternative means of land transfer can have important effects on
land management and productivity. We have seen that government land redistri-
bution can increase farming intensity and productivity in the near term but may also
undermine productivity in the long term by reducing tenure security. Land lease
markets in many areas appear to function relatively efficiently, though this is not
always the case, as seen in Tigray. This may be a result of government regulation of
412
JOHN PENDER, FRANK PLACE, AND SIMEON EHUI
land lease markets in Tigray (Pender and Gebremedhin 2004) and argues for avoid-
ing such restrictions.
We do not see significant productivity advantages of freehold tenure over
customary or other tenure systems in Uganda, consistent with findings of other
studies from Kenya and elsewhere in Sub-Saharan Africa. Thus, there is little argu-
ment for broad-based land titling efforts, although there may still be advantages
of land titling in some socioeconomic contexts (e.g., in periurban areas where the
demand for land titles to facilitate sales and access to credit may be high). This is
consistent with the general theme of this book that such interventions should be
targeted to the development domains where they can yield high returns.
Population pressure was found in several studies to contribute to intensifica-
tion of agriculture, as argued by Boserup (1965) and her followers. However, rural
population pressure is associated with land degradation in some studies, and we
have seen that population pressure and small farm sizes inhibit adoption of some
improved land management practices, such as improved fallows. Reducing popula-
tion pressure in densely populated highland areas thus may help to improve some
aspects of land management and reduce land degradation. However, it is clear that
population pressure is not the most important factor contributing to land degrada-
tion in the East African highlands, as demonstrated by the favorable land manage-
ment outcomes in the densely populated highlands of central Kenya.
Research Implications
A great deal has been learned from the research studies included in this book. Still,
these studies have not been able to cover all of the important research issues related
to achieving improved livelihoods and sustainable land management in the East
African highlands; many important information gaps remain to be investigated.
Despite the primary importance of profitability of livelihood and land man-
agement options, there is still a dearth of information about this. The studies in
this book have shed light on the profitability of some options in some circumstances,
but much more needs to be known in order to develop effective targeted inter-
ventions. There is little systematic and reliable information collected on a regular
basis about the profitability of different crop, livestock, or forestry activities in the
different domains of the highlands or the profitability of land management prac-
tices linked to these different livelihood activities. Beyond estimating private profit-
ability, information on the social profitability of alternative activities in different
domains is also needed, taking into account externalities, market price distortions,
nonmarketed inputs and outputs, and other factors.
CONCLUSIONS AND IMPLICATIONS
413
The social profitability of alternative public programs and investments also
needs to be better understood, to help guide development investors and governments
as to where the highest returns can be expected. For example, there is limited infor-
mation on the social costs and benefits of investments in small-scale irrigation and
other water-harvesting measures, as mentioned previously. The returns, costs, risks,
and social and environmental effects of other public investments, such as investments
in infrastructure, education, agricultural research and extension, and others are also
not well quantified. Several of the chapters in this book provide a solid basis to
build on in addressing this information need, but more research is needed to esti-
mate the costs, risks, and social and environmental effects.
To better assess such effects, more long-term research with panel data sets and
dynamic models is needed to better understand the dynamic relationships between
policy and program interventions; among local institutions and endowments of
physical, human, natural, financial, and social capital; between community and
household responses in terms of collective action, livelihood strategies, and land
management practices; among changes in production, income, land degradation,
and other outcomes; and the feedback effects of these responses and outcomes on
interventions, local institutions and endowments, and future responses. It is diffi-
cult to know the extent to which communities and households are trapped in a
downward spiral, stagnation, a virtuous upward spiral, or another kind of dynamic
development path, or what the most effective interventions will be to promote
sustainable development, without better understanding of the dynamic situations
that are occurring and the key causal factors and feedback relationships that are
driving them.
For example, some communities may be falling deeper into poverty and
depleting all of their endowments as a result of a lack of sufficiently profitable
investment opportunities for any type of capital. Unless profitable investments of
some kind can be identified, a sustainable development solution may not be pos-
sible without promoting large-scale emigration out of such areas. In other cases,
communities and households may be depleting their natural capital but investing
in other forms of capital that are yielding higher returns (Pender 1998). Such a
development path may be sustainable as long as households are aware of the deple-
tion of natural capital and will eventually address it adequately as the returns to
investing in natural capital increase relative to the returns to investing in other
types of capital (Pender 1998). Alternatively, they may not be sufficiently aware of
the depletion, may not have adequate incentive or ability to address it because
of externalities or other market failures (e.g., absence of credit, land tenure insecu-
rity), or may be crossing a threshold into a poverty-degradation trap in which the
414
JOHN PENDER, FRANK PLACE, AND SIMEON EHUI
costs are too high or the marginal returns too low to maintain or restore the natu-
ral capital stock (Pender 1998; Barrett et al. 2002).
It matters a great deal for the appropriate policy or program response which
situation householders are in. If there is sufficient awareness and no major market
failure, the problem is likely to take care of itself as the relative returns to investment
in different types of capital adjust (Pender 1998). If there is insufficient awareness
of the degradation problem, educational and technical assistance approaches may
be sufficient to solve it. If the problem is caused by market failures or a degradation
trap, more intervention will be necessary to address these causes. Without more
information to diagnose what kind of dynamic situations communities and house-
holds are facing, it will be difficult to prescribe effective remedies.
Even before such dynamic information becomes available, however, it would be
very useful to identify areas and household types for whom profitable livelihoods
and land management practices are feasible but are not being pursued. Where such
untapped potentials exist, it is useful to investigate the reasons why and identify the
extent to which policies, public investments, and programs could facilitate fulfill-
ment of these potentials. The research in this book has identified some examples
of such potentials, such as production of high-value commodities in high-potential
areas close to urban markets and tree-planting activities in many other areas. The
research has also provided some insights into the reasons why such potentials are
not being more widely exploited; these include the lack of development of cooper-
atives in Ethiopia and Uganda, in part because of politicization and poor perfor-
mance of these in the past, and overregulation of tree-planting activities in northern
Ethiopia. Further case study research into these and other promising livelihood and
land management options could yield valuable insights.
More historical case study research investigating the dynamics of changes in
income strategies, land use, land management, land degradation, productivity, and
welfare outcomes, such as the influential case study of Machakos by Tiffen, Mor-
timore, and Gichuki (1994), would also be valuable. Such long-term historical
studies can yield a wealth of insights into the processes of land degradation or im-
provement and into key driving forces and responses that are not possible to achieve
using only cross-sectional surveys of the type emphasized by many of the studies in
this book. However, the conclusions of such a well-focused case study can easily be
overgeneralized. Similar studies are needed in different development domains and
different historical, political, and social contexts to draw more robust and generaliz-
able conclusions about the dynamics of land degradation, causes, and responses
in the East African highlands. A combination of quantitative survey and qualitative
case study research methods, building on the strengths and addressing the weak-
CONCLUSIONS AND IMPLICATIONS
415
nesses of each approach, is more likely to produce clear and robust conclusions than
reliance on any single approach.
The scale of interventions and their effects also need to be better understood
and have been addressed only in a limited fashion in this book. Interventions that
are able to increase production and household income when pursued on a small
scale may lead to quite different effects when implemented on a large scale. The
negative effects of rapid adoption of improved maize varieties and fertilizer on
maize prices in high-potential areas of Ethiopia have been cited, but other examples
of such scale-dependent effects could be found. Research tracing effects across
scales is needed, from assessing influences of policy and program interventions on
adoption decisions at the plot and household scale and their implications for local
natural resource conditions to the effects on prices and other outcomes at the com-
munity, national, and regional scales. The feedback effects occurring between these
scales must be better understood and accounted for in planning interventions if the
benefits of such interventions are to be maximized and unintended negative effects
are to be minimized. The use of bioeconomic models at household, community,
and higher scales are likely to be essential for an understanding of these effects.
Notes
1. However, substantial efforts were made in the chapters to base the empirical specification
on sound theoretical models and to control for threats to causal interpretation such as nonrandom
selection of cases, omitted variables, and endogenous explanatory variables. Thus, although causal-
ity cannot be proven, the studies have addressed many of the usual reasons why the relationships
between explanatory and dependent variables may fail to be causal ones.
2. Interestingly, Deininger et al. (2003) also found that past land redistributions were asso-
ciated with more tree-planting investments. They argued that this may be because tree planting
increases tenure security, but it may simply have been the result of young households planting trees
around newly constructed houses on land acquired through redistribution, as trees are commonly
planted around the homestead in Ethiopia.
References
Abate, T. 1995. Land redistribution and intra-household relations: the case of two communities in
Northern Ethiopia. Ethiopian Journal of Development Research 17 (1): 23ş42.
Abay, F., M. Lemma, P. O'Flynn, and A. Waters-Bayer. 2001. A challenge and an opportunity:
innovation by women farmers in Tigray. In Farmer innovation in Africa: a source of inspiration
for agricultural development, ed. C. Reij and A. Waters-Bayer. London: Earthscan.
Abegaz, A. 2005. Soil nutrient flows and integrated nutrient management in the northern Ethio-
pian highlands. In Policies for improved land management and agricultural market development
in the Ethiopian highlands, ed. J. Pender, R. Ruben, M. Jabbar, and E. Gabre-Madhin. Sum-
mary of papers and proceedings of a workshop held at the Ghion Hotel, Addis Ababa, Febru-
ary 19ş20, 2004. Environment and Production Technology Division Workshop Summary
Paper No. 17. Washington, D.C.: IFPRI.
Adato, M., and R. Meinzen-Dick. 2002. Assessing the impact of agricultural research on poverty using
the sustainable livelihoods framework. EPTD Discussion Paper No. 89/FCND Discussion
Paper No. 128. Washington, D.C.: IFPRI.
Agrawal, A. 2001. Common property institutions and sustainable governance of resources. World
Development 29 (10): 1649ş1672.
Ahmed, M., B. Gebremedhin, S. Benin, and S. Ehui. 2002. Measurement and sources of technical
inefficiency of land tenure contracts in Ethiopia. Environment and Development Economics 7:
507ş527.
Aklilu, Y. 2002. An audit of the livestock marketing status in Kenya, Ethiopia, and Sudan. Nairobi,
Kenya: Organization of African Unity, Intra-African Bureau for Animal Resources.
Alemu, T. 1999. Land tenure and soil conservation: Evidence from Ethiopia. Ph.D. thesis, Depart-
ment of Economics, Gothenburg University.
418
REFERENCES
Allgood, J., and J. Kilungo. 1996. An appraisal of the fertilizer market in Kenya and recommenda-
tions for improving fertilizer use practices by smallholder farmers: a field report. Muscle Shoals,
Ala., U.S.A.: IFDC.
Alumira, J., and A. Awiti. 2000. The African highlands ecoregion: A situational analysis. African
Highlands Initiative Report, Kampala, Uganda.
Amacher, G. S., L. Ersado, D. Grebner, and W. F. Hyde. 2006. Natural resources, microdams, and
health in Tigray, Ethiopia. Journal of Development Studies (in press).
Amare, Y. 1994. Land redistribution and socioeconomic change in Ethiopia: The case of Wogda, Northern
Shewa. African Studies Center, Boston University, WP 190.
------. 1995. Household economic status, seasonality and food strategies in Ethiopia: the case of
Wogda, northern Shewa. Ph.D. dissertation, Boston University.
------. 2003. Destitution in the north-eastern highlands of Ethiopia: Community and household studies
in Wag Hamra and South Wello. FSS Studies on Poverty No. 3. Addis Ababa, Ethiopia: Forum
for Social Studies.
Amede, T. 2003. Opportunities and challenges in reversing land degradation: the regional experi-
ence. In Natural resources degradation and environmental concerns in the Amhara National Regional
State: impact on food security. Proceedings of the Natural Resource Management Conference,
July 24ş26, 2002, Bahir Dar, Ethiopia.
Angelsen, A. 1999. Agricultural expansion and deforestation: Modeling the impact of population,
market forces and property rights. Journal of Development Economics 58 (1): 185ş218.
Angima, S., D. Stott, M. O'Neill, C. Ong, and G. Weesies. 2003. Soil erosion prediction using Rusle
for central Kenyan highland conditions. Agriculture, Ecosystems and the Environment 97 (1ş3):
295ş308.
ANRSC (Amhara National Regional State Council). 2000a. Review of activity of the five-year
(1996ş2000) development, peace, and democracy programme. Amharic Version. Bahir Dar,
Ethiopia: ANRSC.
------. 2000b. The administration and use of rural land in Amhara region. Draft policy document.
Bahir Dar, Ethiopia: ANRSC.
Anselin, L. 2001. Spatial effects in econometric practice in environmental and resource economics.
American Journal of Agricultural Economics 83 (3): 705ş710.
Appleton, S. 1998. Changes in poverty in Uganda, 1992ş1996, WPS/98-15. University of Oxford:
Centre for the Study of African Economies.
------. 2001. What can we expect from universal primary education? In Uganda's recovery: the role
of farms, firms, and government, ed. R. Reinikka and P. Collier. Washington, D.C.: World
Bank.
REFERENCES
419
APSEC (Agricultural Policy Secretariat, Uganda). 2000. Report on characterization of policies and
institutions affecting land management. Paper presented at a Workshop on Policies on Improved
Land Management in Uganda, Kampala, Uganda.
Argwings-Kodhek, G. 1999. Contemporary issues determining the future of Kenyan agriculture: An
agenda for policy and research. Kenya Agricultural Marketing and Policy Analysis Project, Depart-
ment of Agricultural Economics, Michigan State University, East Lansing, Michigan.
Argwings-Kodhek, G., T. S. Jayne, G. Nyambane, T. Awuor, and T. Yamano. 1999. How can micro-
level household information make a difference for policy making? Kenya Agricultural Marketing
and Policy Analysis Project, Tegemeo Institute, Egerton University, Kenya Agricultural Research
Institute, and Michigan State University (mimeo).
Arthur, B. 1988. Self-reinforcing mechanisms in economics. In The economy as an evolving complex
system, ed. K. J. Arrow and P. Anderson, pp. 9ş33. New York: John Wiley & Sons.
Asefa, D. 2001. The socio-economic effects and environmental impacts of area enclosures in
Hauzien Wereda, Tigray, Ethiopia. M.Sc. thesis, Agricultural University of Norway.
Asefa, D. T., G. Oba, R. B. Weladji, and J. E. Colman. 2003. An assessment of restoration of bio-
diversity in degraded high mountain grazing land in northern Ethiopia. Land Degradation and
Development 14: 25ş38.
Aspen, H. 2003. Informal credit: Money borrowing and lending in Wńlo. Paper presented at the
15th International Conference of Ethiopian Studies, Hamburg, July 21ş25, 2003.
Asrat, R. 2002. Sustainability of minimum tillage practice in Ethiopia: Agronomic and socio-
economic implications. M.Sc. thesis, Agricultural University of Norway.
Atwood, D. A. 1990. Land registration in Africa: The impact on agricultural production. World
Development 18 (5): 659ş671.
Aune J. B., and R. Lal. 1997. Agricultural productivity in the tropics and critical limits of properties
of oxisols, ultisols and alfisols. Tropical Agriculture 74: 96ş103.
Aune, J. B., M. T. Bussa, F. G. Asfaw, and A. A. Ayele. 2001. The ox plowing system in Ethiopia:
Can it be sustained? Outlook on Agriculture 30: 275ş280.
Ayantunde, A. A. 1998. Influence of grazing regimes on cattle nutrition and performance and veg-
etation dynamics in Sahelian rangelands. Ph.D. thesis, Wageningen Agricultural University,
Wageningen, The Netherlands.
Ayele, A. A., and J. B. Aune. 2001. Technical options for agricultural development in the Ethiopian
highlands. A model of crop-livestock interactions. In Economic policy and sustainable land use.
Recent advances in quantitative analyses for developing countries, ed. N. Heerink, H. van Keulen,
and M. Kuiper. Heidelberg, Germany: Springer-Verlag.
Baffoe, J. K. 2000. Structural adjustment and agriculture in Uganda. International Labour Organi-
zation Working Paper No. 149. Geneva.
420
REFERENCES
Bagoora, F. D. K. 1988. Soil erosion and mass wasting risk in the highland areas of Uganda. Moun-
tain Research and Development 8 (2/3): 173ş182.
Baland, J. M., and J. P. Platteau. 1996. Halting degradation of natural resources: Is there a role for rural
community? Oxford: Clarendon Press.
------. 1999. The ambiguous impact of inequality on local resource management. World Develop-
ment 27 (5): 773ş788.
Baland, J.-M., F. Gaspart, F. Place, and J.-P. Platteau. 2003. The distributive impact of land markets
in Central Uganda. FacultÚs des Sciences Úconomiques, socials et de gestion Working Paper
No. 252-2003/13, University of Namur, Namur, Belgium.
Balihuta, A. M., and K. Sen. 2001. Macroeconomic polices and rural livelihood diversity: A Ugandan
case study. LADDER Working paper No. 3, University of East Anglia, U.K.
Bantirgu, A. 2003. NGOs in helping combat natural resources degradation in the Amhara Regional
State: An overview. In Natural resources degradation and environmental concerns in the Amhara
National Regional State: Impact on food security, ed. T. Amede. Proceedings of the Natural
Resource Management Conference, July 24ş26, 2002, Bahir Dar, Ethiopia.
Barbier, B., and G. Bergeron. 2001. Natural resource management in the hillsides of Honduras. Bio-
economic modeling at the microwatershed level. IFPRI Research Report No. 123. Washington,
D.C.
Bardhan, P. 1993. Analytics of the institutions of informal cooperation in rural development. World
Development 21 (4): 633ş639.
Barrett, C. B. 1996. On price risk and the inverse farm size-productivity relationship. Journal of
Development Economics 51: 193ş215.
Barrett, C. B., and D. C. Clay. 2003. Self-targeting accuracy in the presence of imperfect factor
markets: Evidence from food-for-work in Ethiopia. Journal of Development Studies 39 (5):
152ş180.
Barrett, C. B., S. T. Holden, and D. Clay. 2004. Can food-for-work programs reduce vulnerability?
In Insurance against poverty, ed. S. Dercon. Oxford: Oxford University Press.
Barrett, C. B., F. Place, and A. Aboud. 2002. The challenges of stimulating adoption of improved
natural resource management practices in African agriculture. In Natural resources management
in African agriculture, ed. C. B. Barrett, F. Place, and A. A. Aboud. Nairobi, Kenya: ICRAF
and CABI.
Barrett, C. B., T. Reardon, and P. Webb. 2001. Non-income diversification and household liveli-
hood strategies in rural Africa: Concepts, dynamics and policy implications. Food Policy 26 (4):
315ş331.
Barrett, C. B., F. Place, A. A. Aboud, and D. R. Brown. 2002. The challenge of stimulating adop-
tion of improved natural resource management practices in African agriculture. In Natural
REFERENCES
421
resources management in African agriculture: Understanding and improving current practices, ed.
C. B. Barrett, F. Place, and A. A. Aboud. Wallingford, U.K.: CABI.
Barrows, R., and M. Roth. 1990. Land tenure and investment in African agriculture: theory and
evidence. Journal of Modern African Studies 28: 265ş297.
Bassett, T. J., and D. Crummey. 2003. Contested images, contested realities: Environment and society
in African savannas. In African savannas: Global narratives and local knowledge of environmental
change, ed. T. J. Bassett and D. Crummey. Oxford: James Currey.
Bationo, A., and A. Buerkert. 2001. Soil organic matter management for sustainable land use in
Sudano-Sahelian West Africa. Nutrient Cycling in Agroecosystems 61: 131ş142.
Bationo, A., F. Lompo, and S. Koala. 1998. Research on nutrient flows and balances in West Africa:
State-of-the-art. Agriculture, Ecosystems and Environment 71 (1ş3): 19ş35.
Bauer, D. F. 1977. Household and society in Ethiopia. Occasional Papers No. 6. African Studies
Centre, Michigan State University, East Lansing.
------. 1987. The dynamics of communal and hereditary land tenure among the Tigray of
Ethiopia. In The question of the commons: The culture and ecology of communal resources. Tuc-
son, Ariz., U.S.A.: University of Arizona Press, pp. 217ş230.
Bebe, B. O., H. M. J. Udo, and W. Thorpe. 2002. Development of smallholder dairy systems in the
Kenya highlands. Outlook on Agriculture 31: 113ş120.
Becker, M., J. K. Ladha, and M. Ali. 1995. Green manure technology: Potential usage, limitations.
A case study for lowland rice. Plant and Soil 174: 181ş194.
Bekunda, M., and P. Woomer. 1996. Organic resource management in banana-based cropping
systems of the Lake Victoria Basin, Uganda. Agriculture, Ecosystems and Environment 59:
171ş180.
Belay, A., A. S. Claasens, and F. C. Wehner. 2002. Effect of direct nitrogen and potassium and
residual phosphorus fertilizers on soil chemical properties, microbial components and maize
yield under long-term crop rotation. Biology and Fertility of Soils 35: 420ş427.
Belshaw, D., P. Lawrence, and M. Hubbard. 1999. Agricultural tradables and economic recovery
in Uganda: The limitations of structural adjustment in practice. World Development 27 (4):
673ş690.
Benin, S., and J. Pender. 2001. Impacts of land redistribution on land management and productivity
in the Ethiopian highlands. Land Degradation and Development 12: 555ş568.
Benin, S., S. Ehui, and J. Pender. 2002. Policies for livestock development in the Ethiopian highlands.
Socio-economics and Policy Research Working Paper No. 14, International Livestock Research
Institute, Nairobi, Kenya.
------. 2003a. Policies for livestock development in the Ethiopian highlands. Environment, Devel-
opment and Sustainability 5 (3ş4): 491ş510.
422
REFERENCES
------. 2003b. Factors affecting soil fertility management on smallholder farms in sub-Saharan
Africa: A case study of the highlands of northern Ethiopia. Presented at the Workshop on
BASIS/IDR Research in Eastern Amhara Region, Bahir Dar, Ethiopia, June 17ş18, 2003.
Benin, S., M. Ahmed, J. Pender, and S. Ehui. 2005. Development of land rental markets and agri-
cultural productivity growth: the case of northern Ethiopia. Journal of African Economics 14:
21ş54.
Berhane, G. 1996. Livestock production in Central Tigray. In Rural exploratory studies in the central
zone of Tigray, northern Ethiopia, ed. A. O. ěyhus and G. Gebru. Proceedings of a workshop,
Noragric, Agricultural University of Norway, pp. 55ş68.
Berry, R. A., and W. R. Cline. 1979. Agrarian structure and productivity in developing countries. Bal-
timore, Md., U.S.A.: Johns Hopkins University Press.
Bertolini, R., D. MŘller-Falcke, G. Soon-Song, and M. Torero. 2002. Information and commu-
nication technologies for development. Present situation, perspectives and potential areas
for German technical cooperation in Peru, Lao P.D.R., Vietnam, Tanzania and Uganda.
GTZ Division 43--Health, Education, Nutrition, Emergency Aid, IK-Technologien in der
Entwicklungszusammenarbeit.
Besley, T. 1995. Property rights and investment incentives: Theory and evidence from Ghana. Jour-
nal of Political Economy 103 (5): 903ş937.
Bigman, D., and H. Fofack. 2000. Geographical targeting for poverty alleviation: methodology and
applications. Washington, D.C.: World Bank.
Binswanger, H. P., and J. McIntire. 1987. Behavioral and material determinants of production rela-
tions in land abundant tropical agriculture. Economic Development and Culture Change 35 (1):
73ş99.
Binswanger, H., and M. R. Rosenzweig. 1986. Behavioral and material determinants of production
relations in agriculture. Journal of Development Studies 22: 503ş539.
Bishop, C. M. 1995. Neural networks for pattern recognition. New York: Oxford University Press.
Blundell, R. W., and R. J. Smith. 1989. Estimation in a class of limited dependent variable models.
Review of Economic Studies 56: 37ş58.
BoA (Bureau of Agriculture). 1999a. Amhara National Regional State 5-Year Development Action
Plan, 1988ş1992 Ethiopian Calendar. Bahir Dar, Ethiopia: BoA.
------. 1999b. General basic agricultural data: Wereda level. Bahir Dar, Ethiopia: BoA.
------. 1999c. Basic agricultural data. Bahir Dar, Ethiopia: BoA.
Bockstael, N. E. 1996. Modeling economics and ecology: The importance of a spatial perspective.
American Journal of Agricultural Economics 78: 1168ş1180.
B÷jo, J., and D. Cassells. 1995. Land degradation and rehabilitation in Ethiopia: A reassessment.
AFTES Working Paper No. 17. Washington, D.C.: World Bank.
REFERENCES
423
BoPED (Bureau of Planning and Economic Development). 1998. Statistical bulletin for the years
1993/94ş1996/97. Bahir Dar, Ethiopia: BoPED.
------. 1999. Statistical bulletin for the year 1999. Bahir Dar, Ethiopia: BoPED.
Boserup, E. 1965. The conditions of agricultural growth. New York: Aldine.
Braun, A. R., E. M. A. Smaling, E. I. Muchugu, K. D. Shepherd, and J. D. Corbett. 1997. Mainte-
nance and improvement of soil productivity in the highlands of Ethiopia, Kenya, Madagascar and
Uganda. AHI Technical Report Series No. 6, African Highlands Initiative, Nairobi, Kenya.
Brett, E. A. 1991. Rebuilding survival structures for the poor: organizations options for develop-
ment in the 1990s. In Changing Uganda, ed. H. B. Hansen and M. Twaddle. Athens, Ohio,
U.S.A.: Ohio State University.
------. 1994. Rebuilding organization capacity in Uganda under the National Resistance Move-
ment. Journal of Modern African Studies 32 (1): 53ş80.
Brookfield, H., and C. Padoch. 1995. Appreciating agrodiversity: A look at the dynamism and
diversity of indigenous farming practices. Environment 36: 37ş45.
Bruce, J. W., and S. E. Migot-Adholla (eds.). 1994. Searching for land tenure security in Africa.
Dubuque, Iowa, U.S.A.: Kendall/Hunt.
Bruce, J., A. Hoben, and D. Rahmato. 1994. After the derg: An assessment of rural land tenure issues
in Ethiopia. Madison, Wisc., U.S.A.: Land Tenure Center, University of Wisconsin.
Buresh, R. J., P. C. Smithson, and D. T. Hellums. 1997. Building soil phosphorus capital in Africa.
In Replenishing soil fertility in Africa, ed. R. J. Buresh, P. Sanchez, and F. Calhoun, pp. 111ş
150. SSA Special Publication 51. Madison, Wisc., U.S.A.: SSA.
Buyanovsky, G. A., and G. H. Wagner. 1998. Changing role of cultivated land in the global carbon
cycle. Biology and Fertility of Soils 27: 242ş245.
Carter, M. R. 1984. Identification of the inverse relationship between farm size and productivity:
An empirical analysis of peasant agricultural production. Oxford Economic Papers 36 (1):
131ş145.
Carter, S. E., P. N. Bradley, S. Franzel, and J. K. Lynam. 1994. Spatial variation as a factor in natural
resource management research. In Proceedings of an IDRC/ICRAF workshop on Sustainable
Mountain Agriculture, December 6ş11, 1993, ICRAF, Nairobi, Kenya.
Chayanov, A. 1966. The theory of peasant economy. Homewood, Ill., U.S.A.: Richard Irwin.
Chenery, E. M. 1960. An introduction to the soils of the Uganda protectorate. Memoria of the
Research Division, Department of Agriculture, Uganda, Series 1, No. 1.
Cheung, S. N. S. 1969. The theory of share tenancy. Chicago: University of Chicago Press.
Chomitz, K. M., and D. A. Gray. 1996. Roads, land use, and deforestation: A spatial model applied
to Belize. World Bank Economic Review 10 (3): 487ş512.
424
REFERENCES
CIESIN/IFPRI/World Bank/CIAT (Center for International Earth Science Information Network,
International Food Policy Research Institute, World Bank, and Centro Internacional de Agri-
cultura Tropical). 2005. Global RuralşUrban Mapping Project, Version 1: Urban/rural popu-
lation grids. Palisades, NY: CIESIN, Columbia University.
Clay, D. C., D. Molla, and D. Habtewold. 1999. Food aid targeting in Ethiopia: A study of who
needs it and who gets it. Food Policy 24: 391ş409.
Clay, D. C., T. Reardon, and J. Kangasniemi. 1998. Sustainable intensification in the highland
tropics: Rwandan farmers' investments in land conservation and soil fertility. Economic Devel-
opment and Cultural Change 46 (2): 351ş378.
Cleaver, K. M., and G. A. Schreiber. 1994. Reversing the spiral: The population, agriculture and envi-
ronment nexus in Sub-Saharan Africa. Washington, D.C.: World Bank.
Cohen, M. J., M. T. Brown, and K. D. Shepherd. 2005. Estimating the environmental costs of soil
erosion at multiple scales in Kenya using energy synthesis. International Centre for Research
in Agroforestry, Nairobi, Kenya (mimeo).
Cohen, M., K. Shepherd, and M. Walsh. 2005. Empirical reformulation of the universal soil loss
equation for erosion risk assessment in a tropical watershed. Geoderma 124: 235ş252.
Corbett, J. D., S. N. Collis, B. R. Bush, E. I. Muchugu, R. F. O'Brien, R. Q. Jeske, R. A. Burton,
R. E. Martinez, C. M. Stone, J. W. White, and D. P. Hodson. 1999. East African Country
Almanacs (ACT V2). Texas Agricultural Experiment Station, Texas A&M University System,
Blackland Research Center Report No. 99-06, College Station, Texas.
CoSAERAR (Commission for Sustainable Agriculture and Environmental Rehabilitation for Amhara
Region). 1999. CoSAERAR (brochure). Bahir Dar, Ethiopia: CoSAERAR.
CSA (Central Statistical Authority). 1998. Agricultural sample survey: Report on livestock, poultry
and beehives population, Volume II. Addis Ababa, Ethiopia: CSA.
Danish International Development Agency (DANIDA). 1996. Evaluation of poverty reduction in
Danish development assistance: Uganda. Copenhagen: DANIDA.
Defoer, T. 2000. Moving methodologies. Learning about integrated fertility management in Sub-
Saharan Africa. Ph.D. thesis, Wageningen University, Wageningen, The Netherlands.
Degefe, B., and B. Nega. 2000. Annual report on the Ethiopian economy, Volume I, 1999/2000. Addis
Ababa, Ethiopia: Ethiopian Economic Association.
Deininger, K., and R. Castagnini. 2004. Incidence and impact of land conflict in Uganda. World
Bank Policy Research Working Paper 3248, March 2004. Washington, D.C.: World Bank.
Deininger, K., and J. Okidi. 2001. Rural households: Incomes, productivity, and nonfarm enterprises.
In Uganda's recovery: The role of farms, firms, and government, ed. R. Reinikka and P. Collier.
Washington, D.C.: World Bank.
Deininger K., S. Jin, B. Adenew, S. Gebre-Selassie, and B. Nega. 2003. Tenure security and land-
related investment: Evidence from Ethiopia. World Bank Policy Research Working Paper 2991.
Washington, D.C.: World Bank.
REFERENCES
425
de Jager, A., S. M. Nandwa, and P. F. Okoth. 1998. Monitoring nutrient flows and economic per-
formance in African farming systems (NUTMON). I. Concepts and methodologies. Agriculture
Ecosystems and Environment 71: 37ş48.
de Janvry, A., M. Fafchamps, and E. Sadoulet. 1991. Peasant household behavior with missing
markets: Some paradoxes explained. Economic Journal 101.
Delgado, C., M. Rosegrant, H. Steinfeld, S. Ehui, and C. Courbis. 1999. Livestock to 2000: The next
food revolution. Food, Agriculture, and the Environment Discussion Paper 28. Washington,
D.C.: IFPRI.
Delve, R. J., and B. Jama. 2002. Developing organic resource management options with farmers in east-
ern Uganda. Proceedings of the 17th World Congress of Soil Science, Bangkok, Thailand, 2002.
Delve, R. J., G. Cadisch, J. C. Tanner, W. Thorpe, P. J. Thorne, and K. E. Giller. 2001. Implications
of livestock feeding management on soil fertility in the smallholder farming systems of sub-
Saharan Africa. Agriculture, Ecosystems and Environment 84: 227ş243.
Demeke, M., and T. Abebe. 2003. Ethiopian Agriculture: Macro and Micro Perspective. Afrint
Country Case Study for Ethiopia, Department of Sociology, Lund University, Lund, Sweden.
Demeke, M., and T. G. Egziabher. 2003. Sustainable rural (regional) development in Ethiopia: The
case of marginal weredas in Tigray region. Paper presented at the 7th Annual Conference of
the Agricultural Economics Society of Ethiopia, August 7ş9, 2003. Addis Ababa University
(mimeo).
Deolalikar, A. 1981. The inverse relationship between productivity and farm size: A test using regional
data from India. American Journal of Agricultural Economics 63 (2): 275ş279.
Derpch, R. 1998. Historical review of no-tillage cultivation of crops. Projet "Conservaciˇn de Suelos"
MAG-GTZ. Asunciˇn, Paraguay: Casilla de Correo.
Desta, L., M. Kassie, S. Benin, and J. Pender. 2000. Land degradation and strategies for sustainable
development in the Ethiopian highlands: Amhara Region. Socio-economics and Policy Research
Working Paper 32. Nairobi, Kenya: ILRI (International Livestock Research Institute).
Devereux, S. 2000. Destitution in Ethiopia's Northeast Highlands. Conceptual Paper. Addis Ababa:
Save the Children (UK).
Devereux, S., and K. Sharp. 2003. Is poverty really falling in rural Ethiopia? Paper presented at the
conference Staying Poor: Chronic Poverty and Development Policy at the University of Man-
chester, April 7ş9, 2003.
Devereux, S., K. Sharp, and Y. Amare. 2004. Destitution in Wollo, Ethiopia. IDS Research Report
No. 55. Sussex, U.K.: IDS.
De Wolf, J., and R. Rommelse. 2000. Improved fallow technology in western Kenya: Potential and
reception by farmers. Nairobi: International Centre for Research in Agroforestry (mimeo).
Dicklitch, S. 1998. The elusive promise of NGOs in Africa: Lessons from Uganda. New York: St. Mar-
tin's Press.
426
REFERENCES
Diechmann, U. 1994. A medium resolution population database for Africa. Technical paper and digi-
tal database. Santa Barbara, Calif., U.S.A.: National Center for Geographic Information and
Analysis.
Durning, A. 1989. Poverty and the environment: reversing the downward spiral. Worldwatch Paper 92.
Washington, D.C.: Worldwatch Institute.
Earthtrends. 2004. www.earthtrends.wri.org.
Ege, S. 1997. The promised land: The Amhara land redistribution of 1997. Trondheim, Norway: Cen-
ter for Environment and Development, Norwegian University of Science and Technology.
------. 2003a. The role of oxen in peasant agriculture: Ch'enńt rentals in Ch'orisa, South Wńlo. Paper
presented at the 15th International Conference of Ethiopian Studies, Hamburg, July 21ş25,
2003.
------. 2003b. Peasants in famine: Ox scarcity and the organisation of farming in Wńlo, Ethiopia.
Unpublished paper. Department of Social Anthropology, Norwegian University of Science and
Technology, Trondheim.
Ege, S., and H. Aspen. 2003. On the brink of famine: Ch'orisa, Qalu, 2002. Trondheim, Norway:
Department of Social Anthropology, Norwegian University of Science and Technology.
Egziabher, K. G. 2003. Socio-economic impact assessment study on three micro-dams. Mekelle
University Faculty of Business and Economics, Mekelle, Ethiopia.
Ehui, S., and J. Pender. 2003. Resource degradation, low agricultural productivity and poverty in
Sub-Saharan Africa: Pathways out of the spiral. Plenary paper presented at the 25th Inter-
national Conference of Agricultural Economists, August 16ş23, Durban, South Africa. Wash-
ington, D.C.: IFPRI.
Ehui, S., H. Li Pun, V. Mares, and B. Shapiro. 1998. The role of livestock in food security and envi-
ronmental protection. Outlook on Agriculture 27 (2): 81ş87.
Elias, E., and I. Scoones. 1999. Perspectives on soil fertility change: A case study from southern
Ethiopia. Land Degradation and Development 10 (3): 195ş206.
Elias, E., S. Morse, and D. G. R. Belshaw. 1998. Nitrogen and phosphorus balances of Kindo
Koisha farms in southern Ethiopia. Agriculture, Ecosystems and Environment 71: 93ş113.
Ellis, F. 2000. Rural livelihoods and diversity in developing countries. Oxford: Oxford University
Press.
EMA (Ethiopian Mapping Authority). 1994. Ethiopia tourist map. Addis Ababa, Ethiopia.
EPOPA. 2004. An evaluation of the program Export Promotion of Organic Products from Africa
(EPOPA), Phase II. www.grolink.se/epopa/publications/EPOPA-Phase-2-Evaluation-04.pdf.
Esilaba, A. O., J. B. Byalebeka, A. Nakiganda, S. Mubiru, D. Ssenyange, R. Delve, M. Mbalule, and
G. Nalukenge. 2001. Integrated nutrient management strategies in Iganga District, Uganda. CIAT
Africa Occasional Publication Series, No. 35, Kampala, Uganda.
REFERENCES
427
Ethiopian Economic Association. 2002. A research report on land tenure and agricultural development
in Ethiopia. Addis Ababa: Ethiopian Economics Association.
Eweg, H. P. A., R. van Lammeren, and F. Yifter. 1997. The GIS implementation. In Rehabilitation
of degraded and degrading areas of Tigray, Northern Ethiopia, Final Report, ed. E. Feoli, Project
Coordinator, Commission of the European Communities, STD3 Project No. TS3-CT92-
0049, 1992ş1996. University of Trieste, Italy, Department of Biology.
Fairhead, J., and M. Leach. 1996. Misreading the African landscape: Society and ecology in a forest-
savanna mosaic. Cambridge: Cambridge University Press.
Fairhead, J., and I. Scoones. 2005. Local knowledge and the social shaping of soil investments:
critical perspectives on the assessment of soil degradation in Africa. Land Use Policy 22 (1):
33ş42.
Fan, S., and Hazell, P. 2000. Should developing countries invest more in less-favored areas? An
empirical analysis of rural India. Economic and Political Weekly 35 (April 22): 1455ş1464.
Fan, S., P. Hazell, and S. Thorat. 1999. Linkages between government spending, growth, and poverty in
rural India. IFPRI Research Report No. 118. Washington, D.C.: IFPRI.
FAO (Food and Agricultural Organization of the United Nations). 1986. Ethiopian highlands recla-
mation study: Final report. Rome.
------. 1995. Forest resources 1990. Tropical forest plantation resources. FAO Forestry Paper 128.
Rome.
------. 1998. The state of food and agriculture: 1998. Rome
------. 1999. Uganda Soil Fertility Initiative. Draft concept paper. Rome.
------. 2000. World soil resources report: Land resource potential and constraints at regional and coun-
try levels. Land and Water Development Division, Rome.
------. 2002. FAOSTAT database. http://faostat.fao.org.
------. 2004. FAOSTAT database. http://faostat.fao.org.
FAO and World Food Programme. 1997. Special report: FAO/WFP crop and food supply assessment,
mission to Uganda. Rome: FAO.
------. 2000. Special report: FAO/WFP crop and food supply assessment, mission to Ethiopia. Rome:
FAO.
Farley, C. 1995. Smallholder knowledge, soil resource management and land use change in the
highlands of Southwest Uganda. Ph.D. thesis, University of Florida, Gainesville, Fla., U.S.A.
Farrington, J., and A. Bebbington. 1993. Reluctant partners? Non-government organizations, the state
and sustainable agricultural development. London and New York: Routledge.
FBAK Feld Consulting. 2001. Sector study of the horticultural export sector in Kenya. Nairobi: Study
for USAID-Kenya.
428
REFERENCES
FDRE (Federal Democratic Republic of Ethiopia). 2003. Memorandum of economic and financial
policies for the period July 8, 2003şJuly 7, 2004. Washington, D.C.: International Monetary
Fund. http://www.imf.org.
Feder, G., and D. Feeny. 1993. The theory of land tenure and property rights. In The economics of
rural organization: Theory, practice and policy, ed. K. Hoff, A. Braverman, and J. E. Stiglitz.
Washington, D.C.: World Bank.
Feder, G., and T. Onchan. 1987. Land ownership, security, and farm investment in Thailand. Amer-
ican Journal of Agricultural Economics 69 (2): 311ş320.
Feder, G., R. Just, and D. Zilberman. 1985. Adoption of agricultural innovations in developing
countries: A survey. Economic Development and Cultural Change 33 (2): 255ş298.
Feder, G., T. Onchan, Y. Chalamwong, and C. Hongladaron. 1988. Land policies and farm produc-
tivity in Thailand. Baltimore, Md., U.S.A.: Johns Hopkins University Press.
Federal Democratic Republic of Ethiopia. 2002. Ethiopia: Sustainable development and poverty
reduction programme. Ministry of Finance and Economic Development, Addis Ababa.
Fischer, G., M. Shah, H. van Velthuizen, and F. O. Nachtergaele. 2001. Global agro-ecological
assessment for agriculture in the 21st century: A global assessment of the world's agricultural
ecology: Methodology and results. Rome and Laxenburg, Austria: Food and Agriculture Orga-
nization of the United Nations and International Institute for Applied Systems Analysis.
Fischler, M. 1997. Legume green manures in the management of maize-bean cropping systems in
eastern Africa with special reference to crotalaria. Ph.D. thesis, Swiss Federal Institute of Tech-
nology, Zurich, Switzerland.
Foster, H. L. 1976. Soil fertility in Uganda. Ph.D. thesis, University of Newcastle upon Tyne, U.K.
------. 1981. The basic factors which determine inherent soil fertility in Uganda. Journal of Soil
Science 32: 149ş160.
FURP (Fertilizer Use Recommendation Project). 1995. Fertilizer use recommendations, Vol. 1ş23.
Nairobi, Kenya.
Gabre-Madhin, E., and W. Amha. 2003. Getting markets right in Ethiopia: Institutional changes to
grain markets. Washington, D.C.: IFPRI.
Gautam, M., and J. R. Anderson. 1999. Reconsidering the evidence on returns to T&V extension in
Kenya. Policy Research Working Paper 2098. Washington, D.C.: World Bank, Operations Eval-
uation Department.
Gavian, S., and S. Ehui. 1999. Measuring the production efficiency of alternative land tenure con-
tracts in a mixed crop-livestock system in Ethiopia. Agricultural Economics 20: 37ş49.
Gavian, S., and Fafchamps, M. 1996. Land tenure and allocative efficiency in Niger. American Jour-
nal of Agricultural Economics 78 (2): 460ş471.
REFERENCES
429
GEA (German Ethiopian Association). 1997. Informationsbl÷tter Nr. 01/97, Juni 1997. Deutsch-
─thiopischer Verein e.V.
Gebremedhin, B. 1998. The economics of soil conservation investments in the Tigray region of
Ethiopia. Unpublished Ph.D. dissertation, Department of Agricultural Economics, Michigan
State University, East Lansing.
Gebremedhin, B., and S. Swinton. 2003a. Investment in soil conservation in northern Ethiopia: The
role of land tenure security and public programs. Agricultural Economics 29 (203): 69ş84.
------. 2003b. Reconciling food-for-work project feasibility with food aid targeting in Tigray,
Ethiopia. Food Policy 26 (1): 85ş95.
Gebremedhin, B., J. Pender, and S. Ehui. 2003. Land tenure and land management in the high-
lands of northern Ethiopia. Ethiopian Journal of Economics 8 (2): 47ş63.
Gebremedhin, B., J. Pender, and G. Tesfay. 2003. Community natural resource management: The
case of woodlots in northern Ethiopia. Environment and Development Economics 8: 129ş148.
------. 2004. Collective action for grazing management in crop-livestock mixed systems in the
highlands of northern Ethiopia. Agricultural Systems 82: 273ş290.
Gebremedhin, B., M. Swinton, and Y. Tilahun. 1999. Effects of stone terraces on crop yields and
farm profitability: Results of on-farm research in Tigray, northern Ethiopia. Journal of Soil and
Water Conservation 54 (3): 568ş573.
Gebrewold, A., A. Misgina, and B. I. Shapiro. 1998. Animal traction and the potential for use of
dairy cows in the Ethiopian highlands. In Technology transfer: Multi-purpose cows for milk, meat,
and traction in smallholder farming systems, ed. E. Zerbini, B. I. Shapiro, and J. C. Chirgwin.
Proceedings of an expert consultation, International Livestock Research Institute (ILRI), Addis
Ababa, Ethiopia, September 11ş14, 1995. Nairobi, Kenya: ILRI.
Gelaye, G. 1999. Peasant poetics and state discourse in Ethiopia: Amharic oral poetry as a response
to the 1996ş97 land redistribution policy. Northeast African Studies 6 (1ş2): 171ş206.
Getahun, A. 1991. Agricultural growth and sustainability: Conditions for their compatibility in the
tropical East Africa highlands. In Agricultural sustainability, growth and poverty alleviation: Issues
and policies, ed. S. Vosti, T. Reardon, and W. von Urff, pp. 451ş468. Washington, D.C.: IFPRI.
------. 2003. Eucalyptus farming in Ethiopia: the case for eucalyptus woodlots in the Amhara
region. In Natural resources degradation and environmental concerns in the Amhara National
Regional State: Impact on food security, ed. T. Amede. Proceedings of the Natural Resource
Management Conference, July 24ş26, 2002, Bahir Dar, Ethiopia.
Giller, K. E., G. Cadisch, C. Ehaliotis, E. Adams, W. D. Sakala, and P. L. Mafongoya. 1997. Build-
ing soil nitrogen capital in Africa. In Replenishing soil fertility in Africa, ed. R. Buresh, P. A.
Sanchez, and F. Calhoun, pp. 151ş192. Soil Science Society of America Special Publication
No. 51. Madison, Wisc.: American Society of Agronomy.
430
REFERENCES
Gittinger, J. P., S. Chernick, N. R. Horenstein, and K. Saito. 1990. Household food security and the
role of women. World Bank Discussion Paper 96. Washington, D.C.: World Bank.
Gladwin, C. H., J. S. Peterson, D. Phiri, and R. Uttaro. 2002. Agroforestry, adoption decisions,
structural adjustment and gender in Africa. In Natural resources management in African agri-
culture: Understanding and improving current practices, ed. C. B. Barrett, F. Place, and A. A.
Aboud. Wallingford, U.K.: CABI.
Goetz, S. J. 1992. A selectivity model of household food marketing behaviour in sub-Saharan Africa.
American Journal of Agricultural Economics 64: 444ş452.
Gold, C. S., E. B. Kiggnndu, A. Karamura, F. Bagamba, and A. M. K. Abera. 1999. Geographic
shifts in the highland cooking banana (Musa spp., group AAA-EA) production in Uganda. Inter-
national Journal of Sustainable Development and World Ecology. 6 (1): 45ş59.
Goldman, A. 1995. Threats to sustainability in African agriculture. Human Ecology 23: 291ş334.
Gordon, H. S. 1954. The economic theory of a common property resource: the fishery. Journal of
Political Economy 62 (2): 124ş142
Government of the Republic of Uganda. 2000. Plan for modernization of agriculture: Eradicating
poverty in Uganda. Government strategy and operational framework. Kampala.
Greene, W. H. 1993. Econometric analysis. New York: Macmillan.
Grepperud, S. 1996. Population pressure and land degradation: The case of Ethiopia. Journal of
Environmental Economics and Management 30 (1): 18ş33.
Haggblade, S., P. Hazell, and J. Brown. 1989. Farmşnonfarm linkages in rural sub-Saharan Africa.
World Development 17 (8): 1173ş1201.
Hagos, F. 2003. Poverty, institutions, peasant behavior and conservation investment in northern
Ethiopia. Ph.D. dissertation No. 2003:2, Department of Economics and Social Sciences, Agri-
cultural University of Norway, Aas.
Hagos, F., and S. Holden. 2006. Tenure security, resource poverty, public programs, and household
plot-level conservation investments in the highlands of northern Ethiopia. Agricultural Eco-
nomics 34 (2): 183ş196.
Hagos, F., J. Pender, and N. Gebreselassie. 1999. Land degradation in the highlands of Tigray and
strategies for sustainable land management. Socioeconomic and Policy Research Working Paper
No. 25. Addis Ababa: International Livestock Research Institute.
Haile, M., B. Gebremedhin, and A. Belay. 2003. The status of soil fertility in Tigray. In Policies for
sustainable land management in the highlands of Tigray, northern Ethiopia, B. Gebremedhin,
J. Pender, S. K. Ehui, and M. Haile, eds. Socio-economics and Policy Research Working Paper
54, International Livestock Research Institute, Nairobi, Kenya, and Environment and Pro-
duction Technology Division Workshop Summary Paper No. 14, International Food Policy
Research Institute, Washington, D.C.
REFERENCES
431
Haile, M., T. Adhanom, K. Witten, M. Yohannes, P. Byass, and S. Lindsay. 2003. Water harvest-
ing in micro dams: Its impact on the socio-economic condition of the community and the
salinity of the irrigated fields in Tigray. In Policies for sustainable land management in the high-
lands of Tigray, northern Ethiopia, ed. B. Gebremedhin, J. Pender, S. K. Ehui, and M. Haile.
Socio-economics and Policy Research Working Paper 54. International Livestock Research
Institute, Nairobi, Kenya, and Environment and Production Technology Division Workshop
Summary Paper No. 14, International Food Policy Research Institute, Washington, D.C.
Hailu, B., and M. Haile. 2001. Liberating local creativity: building on the "best farming practices"
extension approach from Tigray's struggle for liberation. In Farmer innovation in Africa: A source
of inspiration for agricultural development, ed. C. Reij and A. Waters-Bayer. London: Earthscan.
Harrison, A. 2003. Working abroad: The benefits flowing from nationals working in other economies.
Paper presented to the Round Table on Sustainable Development, November 19, 2003, Orga-
nization for Economic Cooperation and Development, Paris.
Harrop, J. 1970. Soils. In Agriculture in Uganda, ed. J. D. Jameson, pp. 43ş71. Oxford: Oxford
University Press.
Hartemink, A. E. 2003. Soil fertility decline in the tropics; with case studies on plantations. Walling-
ford, U.K.: CAB International.
Haugerud, A. 1989. Land tenure and agrarian change in Kenya. Africa 59 (1): 61ş90.
Hausman, J. 1978. Specification tests in econometrics. Econometrica 46: 1251ş1271.
Hayami, Y., and V. Ruttan. 1985. Agriculture development: An international perspective (2nd ed.).
Baltimore, Md., U.S.A.: Johns Hopkins University Press.
Hayes, J., M. Roth, and L. Zepeda. 1997. Tenure security, investment and productivity in Gambian
agriculture: A generalized probit analysis. American Journal of Agricultural Economics 79:
369ş382.
Hazell, P. 1999. Agricultural growth, poverty alleviation and environmental sustainability. Having
it all. Brief 59. http://www.ifpri.org/2020/briefs/number59.htm.
Hazell, P., and E. Lutz. 1998. Integrating environmental and sustainability concerns into rural
development policies. In Agriculture and the environment. Perspectives on sustainable rural devel-
opment. Washington, D.C.: World Bank.
Hazell, P., R. Ruben, H. Jansen, and A. Kuyvenhoven. 2002. Investing in poor people in poor lands.
Paper prepared for the International Fund for Agricultural Development, IFPRI, Washington,
D.C., and Wageningen University and Research Center, Wageningen, The Netherlands.
Heisey, P. A., and W. Mwangi. 1995. Fertiliser use and maize production in sub-Saharan Africa.
Mexico: CIMMYT.
Heltberg, R. 1998. Rural market imperfections and the farm sizeşproductivity relationship: Evi-
dence from Pakistan. World Development 26 (10): 1807ş1826.
432
REFERENCES
Hengsdijk, H., G. W. Meijerink, and M. E. Mosugu. 2005. Modeling the effect of three soil and
water conservation practices in Tigray, Ethiopia. Agriculture, Ecosystems and Environment 105:
29ş40.
Herweg, K. 1993a. Major constraints to effective soil conservation--experiences in Ethiopia. 7th
ISCO Conference Proceedings, September 27ş30, Sydney, Australia.
------. 1993b. Problems of acceptance and adaptation of soil conservation in Ethiopia. Topics in
Applied Resource Management 3: 391ş411.
Hilhorst, T., and F. Muchena. 2000. Nutrients of the move: Soil fertility dynamics in African farming
systems. International Institute of Environment and Development, London.
Hoben, A. 1995. Paradigms and politics: The cultural construction of environmental policy in
Ethiopia. World Development 23 (6): 1007ş1021.
Hoekstra, D., and J. Corbett. 1995. Sustainable agricultural growth for the Highlands of East and
Central Africa: Prospects to 2020. Paper prepared for the International Food Policy Research
Institute. Washington, D.C.: IFPRI.
Holden, S. T., C. Barrett, and F. Hagos. 2006. Food-for-work for poverty reduction and promo-
tion of sustainable land use: can it work? Environment and Development Economics 11(1):
15ş38.
Holden, S. T., and B. Shiferaw. 2000. Development paths and policies for sustainable land mange-
ment in Andit Tid, North Shewa. An exploration of policy alternatives. Paper presented at the
national workshop on Policies for Sustainable Land Management, Addis Ababa, May 22ş23,
2000.
------. 2004. Land degradation, drought and food security in a less-favored area in the Ethiopian
highlands: A bio-economic model with market imperfections. Agricultural Economics 30 (1):
31ş49.
Holden, S. T., and H. Yohannes. 2002. Land redistribution, tenure insecurity, and intensity of pro-
duction: A study of farm households in Southern Ethiopia. Land Economics 78 (October):
573ş590.
Holden, S. T., B. Shiferaw, and J. Pender. 2001. Market imperfections and profitability of land use
in the Ethiopian highlands: a comparison of selection models with heteroskedasticity. Journal
of Agricultural Economics 52 (3): 53ş70.
------. 2004. Off-farm income, household welfare and sustainable land management. Food Policy
29: 369ş392.
------. 2005. Policy analysis for sustainable land management and food security: A bio-economic
model with market imperfections. Research Report 140, pp. 43ş71. Washington, D.C.: IFPRI.
Holden, S., B. Shiferaw, and M. Wik. 1998. Poverty, credit constraints and time preference: Of rel-
evance for environmental policy? Environment and Development Economics 3: 105ş130.
REFERENCES
433
Holden, S. T., S. Benin., B. Shiferaw, and J. Pender. 2003. Tree planting for poverty reduction in
less-favored areas of the Ethiopian highlands. Small-Scale Forest Economics, Management and
Policy 2 (1): 63ş80.
Holloway, G., C. Nicholson, C. Delgado, S. Staal, and S. Ehui. 2000. How to make a milk market:
A case study from the Ethiopian highlands. International Livestock Research Institute Socio-
economics and Policy Research Working Paper No. 28. Nairobi, Kenya: ILRI.
Holt, J., and R. Dessalegn. 1999. Sustainable livelihoods in North Wollo and Wag Hamra zones.
Addis Ababa: Save the Children (UK).
Howes, M. 1997. NGOs and the development of local institutions: A Ugandan case-study. Journal
of Modern African Studies 35 (1): 17ş35.
Hurni, H. 1985. Erosion-productivity-conservation systems in Ethiopia. Paper presented at the 4th
International Conference on Soil Conservation, Maracacy, Venezuela.
------. 1988. Degradation and conservation of resources in the Ethiopian highlands. Mountain
Research and Development 8 (2/3): 123ş130.
Hurni, H., and I. Perich. 1992. Towards a Tigray Regional Environmental and Economic Strategy
(TREES): A contribution to the symposium on Combating Environmental Degradation in Tigray,
Ethiopia. Group for Development and Environment, Institute of Geography, University of
Bern, Switzerland.
Hyden, G. 1983. No shortcuts to progress: African development management in perspective. Berkeley
and Los Angeles: University of California Press.
IFDC (International Fertilizer Development Center). 1999. The fertilizer market in Uganda: An
assessment and a strategy for development (draft paper). IFDC, Muscle Shoals, Ala., U.S.A.
ILCA (International Livestock Centre for Africa). 1987. ILCA's strategy and long term plan. Addis
Ababa, Ethiopia: ILCA.
ILRI (International Livestock Research Institute). 2000. Strategy to 2010: Making the livestock revo-
lution work for the poor. Nairobi, Kenya: ILRI.
------. 2002. Livestock: A pathway out of poverty. ILRI's strategy to 2010. Nairobi, Kenya: ILRI.
------. 2003. http://www.ilri.cgiar.org/gis/.
International Telecommunications Union. 2004. African telecommunications indicators 2004. Geneva,
Switzerland: ITU.
ISNAR (International Service for National Agricultural Research). 1988. Republic of Uganda estab-
lishment of a national agricultural research organization (NARO). The Hague: International
Service for National Agricultural Research.
Jabbar, M., and G. Ayele. 2002. Property rights and related issues. Paper presented the Workshop on
Policies for Sustainable Land Management in the Highlands of Oromiya Region, March 25ş26,
2002. Addis Ababa, Ethiopia: International Livestock Research Institute.
434
REFERENCES
Jaffee, S. 1995. The many faces of success: The development of Kenyan horticultural exports. In
Marketing Africa's high-value foods: Comparative experiences of an emergent private sector, ed.
S. Jaffee and J. Morton. Washington, D.C.: World Bank.
Jagger, P., and J. Pender. 2003. The role of trees for sustainable management of less-favored lands:
The case of eucalyptus in Ethiopia. Forest Policy and Economics 3 (1): 83ş95.
Jagger, P., J. Pender, and B. Gebremedhin. 2003. Woodlot devolution in northern Ethiopia: Opportunities
for empowerment, smallholder income diversification, and sustainable land management. Environ-
ment and Production Technology Division Discussion Paper No. 107. Washington, D.C.: IFPRI.
------. 2005. Trading off environmental sustainability for empowerment and income: Woodlot
devolution in northern Ethiopia. World Development 33 (9): 1491ş1510.
Jama, B., C. A. Palm, A. Buresh, A. Niang, C. Gachengo, G. Nziguheba, and B. Amadalo. 2000.
Tithonia diversifolia as a green manure for soil fertility improvement in western Kenya: A
review. Agroforestry Systems 49 (2): 201ş221.
Jayne, T. S., V. Kelly, and E. Crawford. 2003. Fertilizer consumption trends in sub-Saharan Africa.
Policy synthesis for Cooperating USAID Offices and Country Missions No. 69. USAID and
SD, Washington, D.C.
Jayne, T. S., J. Strauss, and T. Yamano. 2002. Targeting of food aid in rural Ethiopia: Chronic need
or inertia. Journal of Development Economics 68 (2): 247ş288.
Jayne, T., J. Govereh, M. Wanzala, and M. Demeke. 2003a. Fertilizer market development: A com-
parative analysis of Ethiopia, Kenya and Zambia. Food Policy 28: 293ş316.
Jayne, T. S., T. Yamano, M. Weber, D. Tschirley, R. Benfica, A. Chapoto, and B. Zulu. 2003b.
Smallholder income and land distribution in Africa: Implications for poverty reduction strate-
gies. Food Policy 28(3): 253ş275.
Johnson, D. G. 1950. Resource allocation under share contracts. Journal of Political Economy 58:
111ş123.
Joireman, S. F. 2001. Property rights and the role of the state: Evidence from the Horn of Africa.
Journal of Development Studies 38 (1): 1ş28.
Juo, A. S. R., and B. T. Kang. 1989. Nutrient effects of modification of shifting cultivation in West
Africa. In Mineral nutrients in tropical forest and savanna ecosystems, ed. J. Proctor. Oxford:
Blackwell.
Kaizzi, C. K. 2002. The potential benefit of green manures and inorganic fertilizers in cereal production
on contrasting soils in eastern Uganda. Center for Development Research (ZEF), Ecology and
Development Series Vol. 4. University of Bonn, Germany.
Kaizzi, C. K., H. Ssali, and P. L. G. Vlek. 2004. The potential of velvet bean (Mucuna pruriens) and
N fertilizers in maize production on contrasting soils and agro-ecological zones of East
Uganda. Nutrient Cycling in Agroecosystems 68 (1): 59ş72.
REFERENCES
435
Kaizzi, C. K., H. Ssali, A. Nansamba, G. Ruecker, and P. L. G. Vlek. 2002. Estimated farm-level
nutrient balances for the farming systems of Eastern Uganda. End of project report. Bonn, Ger-
many: ZEF.
Kanbur, R. 2003. Q-squared: Qualitative and quantitative methods in poverty appraisal. Delhi: Per-
manent Black.
KantÚ, S. 2001. Gestion de la fertilitÚ des sols par classe d'exploitation au Mali Sud. Ph.D. thesis,
Wageningen University, Wageningen, The Netherlands.
Kappel, W. 1996. Economic analysis of soil conservation in Ethiopia: Issues and research perspectives.
Addis Ababa, Ethiopia: Ministry of Agriculture.
Katyal, J. C., N. H. Rao, and M. N. Reddy. 2001. Critical aspects of organic matter management in
the Tropics: The example of India. Nutrient Cycling in Agroecosystems 61: 77ş88.
Kebede, D. 1996. Brief account on soil conservation research program and its activities in Ethiopia.
Paper presented at the Workshop on Soil and Water Conservation Research, Nazareth, Ethiopia,
April 29ş30, 1996.
Keeley, J., and I. Scoones. 2000. Knowledge, power and politics: The environmental policy-making
process in Ethiopia. Journal of Modern African Studies 38 (1): 89ş120.
Keeley, J., and I. Scoones. 2003. Understanding environmental policy processes: Cases from Africa.
London: Earthscan.
------. 2004. Understanding policy processes in Ethiopia: A response. Journal of Modern African
Studies 42 (1): 149ş153.
Kennedy, P. 1985. A guide to econometrics. Cambridge, Mass., U.S.A.: MIT Press.
Ketelaars, J. J. M. H. 1991. ElÚvage de la rÚgion: PossibilitÚ et limites. In Manuel sur les pÔturages des
pays sahÚliens, ed. H. Breman and N. de Ridder, pp. 61ş94. Paris: Karthala.
Key, N. E., E. Saudolet, and A. de Janvry. 2000. Transactions costs and agricultural household supply
response. American Journal of Agricultural Economics 82 (2): 245ş259.
Kinfe, A. W. 2002. Public and private labor investment and institutions for soil and water conservation
in Tigray, northern Ethiopia. Policies for Sustainable Land Management in the Ethiopian High-
lands Working Paper No. 2002-02. Wageningen, The Netherlands: Wageningen University
and Research Center.
Knox, A., R. Meinzen-Dick, and P. Hazell. 2002. Property rights, collective action and technologies
for natural resource management: A conceptual framework. In Innovation in natural resource
management: the role of property rights and collective action in developing countries, ed. R. Meinzen-
Dick, A. Knox, F. Place, and B. Swallow. Baltimore, Md., U.S.A.: Johns Hopkins University
Press.
Koning, N., and E. Smaling. 2005. Environmental crisis or "lie of the land"? The debate on soil
degradation in Africa. Land Use Policy 22 (1): 3ş12.
436
REFERENCES
Krishna, A., P. Kristjanson, M. Radeny, and W. Nindo. 2004. Escaping poverty and becoming poor
in twenty Kenyan villages. Journal of Human Development 5 (2): 211ş226.
Kristjanson, P., S. Tarawali, I. Okike, I. V. M. Manyong, and B. B. Singh. 2002. Evaluating adop-
tion of new crop-livestock-soil-management technologies using georeferenced village-level
data. In Natural resources management in African agriculture, ed. C. B. Barrett, F. M. Place, and
A. A. Aboud, pp. 169ş180. Oxford, U.K.: CABI.
Krugman, P. 1998. Space: The final frontier. Journal of Economic Perspectives 12 (2): 161ş174.
Kruseman, G. 2000. Bio-economic household modelling for agricultural intensification. Mansholt
Studies No. 20. Wageningen, The Netherlands: Mansholt Graduate School.
------. 2004. Long-term bio-economic modeling for the assessment of policies for sustainable land use in
less-favored areas. Washington, D.C.: IFPRI, Environment and Production Technology Division
(mimeo).
Kruseman, G., R. Ruben, and G. Tesfay. 2006. Diversity and development domains in the Ethio-
pian highlands. Agricultural Systems 88 (1): 75ş91.
Kuule, M. 2002. Comparison of the effects of Mucuna pruriens, Lablab purpureus, Canavalia ensi-
formis and Crotalaria grahamiana on soil productivity in Tororo district, eastern Uganda.
M.Sc. thesis, Makerere University, Uganda.
LaFrance, J. T. 1992. Do increased commodity prices lead to more or less soil degradation? Aus-
tralian Journal of Agricultural Economics 36 (1): 57ş82.
Lal, R. 1984. Mechanized tillage systems effects on soil erosion from an alfisol in watersheds
cropped to maize. Soil and Tillage Research 4: 349ş360.
Lampietti, J. A., P. Christine, L. C. Maureen, and H. Mitiku. 1999. Gender and preferences for
malaria prevention in Tigray, Ethiopia. In Gender and Development 3. Washington, D.C.:
World Bank (cited by Mintesinot and Mitiku 2003).
Leach, M., and R. Mearns. 1996. Environmental change and policy: Challenging received wisdom
in Africa. In The lie of the land: Challenging received wisdom on the African environment, ed.
M. Leach and R. Mearns. London: International African Institute in association with James
Currey.
Lee, D., and C. Barrett. 2000. Tradeoffs or synergies? Agricultural intensification, economic develop-
ment, and the environment. Wallingford, U.K.: CABI.
Leonard, H. J. 1989. Environment and the poor: development strategies for a common agenda. New
Brunswick, N.J., U.S.A.: Transaction.
Lesschen, L., J. Stoorvogel, and E. Smaling. 2003. Scaling soil nutrient balances: Final report. Rome:
Wageningen University and FAO.
Lewis, W. A. 1954. Economic development with unlimited supplies of labour. Manchester School
22 (May): 139ş191.
REFERENCES
437
Lipsey, R. G., and K. Lancaster. 1956. The general theory of second best. Review of Economic Studies
24 (1): 11ş32.
Lufafa, A., A. M. Tenywa, M. Isabirye, M. J. G. Majaliwa, and P. L. Woomer. 2003. Prediction of
soil erosion in a Lake Victoria basin catchment using a GIS-based Universal Soil Loss model.
Agricultural Systems 76: 883ş894.
Lynam, J. K., S. M. Nandwa, and E. M. A. Smaling. 1998. Nutrient balances as indicators of pro-
ductivity and sustainability in sub-Saharan African agriculture. Agriculture, Ecosystems and
Environment 71: 1ş4.
MAAIF (Ministry of Agriculture, Animal Husbandry and Fisheries, Republic of Uganda). 1999. Plan
for the modernization of agriculture: Land management (soil fertility) issues and options paper.
Kampala, Uganda: Soil Fertility Initiative Working Group.
Machado, P. L. O. de A., and C. A. Silva. 2001. Soil management in no-tillage systems in the
tropics with special reference to Brazil. Nutrient Cycling in Agroecosystems 61: 119ş130.
Maddala, G. S. 1983. Limited dependent and qualitative models in econometrics. New York: Cam-
bridge University Press.
Majaliwa, J. G. M. 2003. Soil and plant nutrient losses from major agricultural land use types and
associated pollution loading in selected micro-catchment of the Lake Victoria catchment.
Ph.D. dissertation, Makerere University.
Mamdani, S. 1993. Pluralism and the right of association. Working Paper No. 29. Kampala: Centre
for Basic Research.
Mango, N. A. R. 2002. Husbanding the land: Agricultural development and socio-technical change
in Luoland, Kenya. Ph.D. thesis, Wageningen University, Wageningen, The Netherlands.
McCann, J. C. 1995. People of the plow: An agricultural history of Ethiopia, 1800ş1990. Madison,
Wisc., U.S.A.: University of Wisconsin Press.
------. 1999. Green land, brown land, black land: An environmental history of Africa, 1800ş1990.
Oxford: James Currey.
McCarthy, N., A. Kamara, and M. Kirk. 2001. The effect of environmental variability on livestock and
land-use management: The Borena Plateau, southern Ethiopia. Environment and Production
Technology Division Discussion Paper 75. Washington, D.C.: IFPRI.
McCay, B. 2002. Emergence of institutions for the commons: Contexts, situations, and events. In
The drama of the commons, ed. E. Ostrom, T. Dietz, N. Dolsak, P. C. Stern, S. Stonich, and
E. U. Weber. Washington, D.C.: National Academy Press.
McIntire, J., D. Bourzat, and P. Pingali. 1992. Crop-livestock interaction in sub-Saharan Africa. Wash-
ington, D.C.: World Bank.
MEA (Millennium Ecosystem Assessment). 2005. Ecosystem and human well being: Synthesis. Wash-
ington, D.C.: Island Press.
438
REFERENCES
Meinzen-Dick, R., A. Knox, F. Place, and B. Swallow (eds.). 2002. Innovation in natural resource
management: The role of property rights and collective action in developing countries. Baltimore,
Md., U.S.A.: Johns Hopkins University Press.
Mertens, B., and E. F. Lambin. 1997. Spatial modeling of deforestation in southern Cameroon.
Applied Geography 17 (2): 143ş162.
Migot-Adholla, S., F. Place, and W. Oluoch-Kosura. 1990. Tenure security and land productivity
in Kenya. Washington, D.C.: Agriculture and Rural Development Department, World Bank
(mimeo).
Migot-Adholla, S., P. Hazell, B. Blarel, and F. Place. 1991. Indigenous land right systems in sub-
Saharan Africa: A constraint on productivity? World Bank Economic Review 5 (1): 155ş175.
Miiro, R., A. Esilaba, and D. Soniia. 2002. Integration and dissemination of green manure cover
crops in small scale farming systems: Successes and constraints in eastern Uganda. Bulletin Vol. 5,
pp. 59ş68. Makerere University, Agricultural Research Institute Kabanyolo (MUARIK).
Ministry of Planning and Finance, Government of Kenya. 2000. Second report on poverty in Kenya,
Volume 1: Incidence and depth of poverty. Nairobi.
Minot, N., and M. Ngigi. 2004. Building on successes in African agriculture: Are Kenya's horticultural
exports a replicable success story? IFPRI 2020 Focus Series, Focus 12, ed. S. Haggblade. Wash-
ington, D.C.: IFPRI.
Mintesinot, B., and H. Mitiku. 2003. Water harvesting in northern Ethiopia: Environmental,
health and socio-economic impacts. In Integrated water and land management research and
capacity building priorities for Ethiopia, ed. P. G. McCornick, A. B. Kamara, and G. Tadesse.
Proceedings of a MoWR/EARO/IWMI/ILRI international workshop held at ILRI, Addis
Ababa, Ethiopia, December 2ş4, 2002. Colombo, Sri Lanka: International Water Manage-
ment Institute (IWMI), and Nairobi, Kenya: International Livestock Research Institute (ILRI).
Mintesinot, B., H. Verplancke, E. Van Ranst, and H. Mitiku. 2004. Examining traditional irriga-
tion methods, irrigation scheduling and alternate furrows irrigation on vertisols in northern
Ethiopia. Agricultural Water Management 64: 17ş27.
Mugo, F. 1999. The effects of fuelwood demand and supply characteristics, land factors, and gender
roles on tree planting and fuelwood availability in highly populated rural areas of Kenya.
Ph.D. thesis, Department of Natural Resources, Cornell University, Ithaca, N.Y., U.S.A.
Mukherjee, C., H. White, and M. Wuyts, 1998. Econometrics and data analysis for developing coun-
tries. London: Routledge.
Mulebeke R. 2003. Validation of a GIS-USLE model in a banana-based micro-catchment of the
Lake Victoria basin. M.Sc. thesis, Makerere University.
Murithi, F. 1998. Economic evaluation of the role of livestock in mixed smallholder farms of the
central highlands of Kenya. Ph.D. thesis, Department of Agriculture, University of Reading.
REFERENCES
439
Mutuo, P. K. 1999. Soil phosphorus pools following phosphorus fertilization and their relationship
to maize yield in western Kenya. M.Sc. thesis, Moi University, Kenya.
Mutuo, P. K., P. C. Smithson, R. J. Buresh, and R. J. Okalebo. 1999. Comparison of phosphate rock
and triple superphosphate on a phosphorus-deficient Kenyan soil. Communications in Soil Sci-
ence and Plant Analysis 30: 1091ş1103.
Mwebaze, S. 2002. Country pasture/forage resource profiles: Uganda. FAO Grassland and Pasture Crops
Programme. Rome: FAO.
Nabuguzi, E. 1995. Popular initiatives in service provision in Uganda. In: Service provision under
stress in East Africa: The state, NGOs and people's organizations in Kenya, Tanzania and Uganda,
ed. J. Semboya and O. Therkildesen. Portsmouth: Heinemann.
Nandwa, S. M. 2001. Soil organic carbon (SOC) management for sustainable productivity of crop-
ping and agro-forestry systems in Eastern and southern Africa. Nutrient Cycling in Agroecosystems
61: 143ş158.
Ndikumana, J., J. Stuth, R. Kamidi, S. Ossiya, R. Marambii, and P. Hemlett. 2000. Coping mecha-
nisms and their efficacy in disaster-prone pastoral systems of the Greater Horn of Africa: Effects of
the 1995ş97 drought and the 1997ş98 El Nino rains and the responses of pastoralists and live-
stock. Nairobi, Kenya: ILRI.
Nelson, G., and J. Geoghaghan. 2002. Deforestation and land use change: Sparse data environments.
Agricultural Economics 27 (3): 201ş216.
Nelson, G. C., and D. Hellerstein. 1997. Do roads cause deforestation? Using satellite images in
econometric analysis of land use. American Journal of Agricultural Economics 79 (1): 80ş88.
Ngigi, M. 2004. Building on successes in African agriculture: Smallholder dairy in Kenya. IFPRI 2020
Focus Series, Focus 12, ed. S. Haggblade. Washington, D.C.: IFPRI.
Nicholson, C. F., P. K. Thornton, L. Mohamed, R. W. Muinga, D. M. Mwamachi, E. H. Elbasha,
S. J. Staal, and W. Thorpe. 1999. Smallholder dairy technology in coastal Kenya. In: A Syn-
thesis of findings concerning CGIAR case studies on the adoption of technological innovations, ed.
L. Sechrest, M. Stewart, and T. Stickle, pp. 65ş79. Consultative Group in International Agri-
cultural Research (CGIAR) Impact Assessment and Evaluation Group, Secretariat of the
United Nations, Food and Agriculture Organization (FAO), Rome, Italy.
Njuki, J. 2001. Gender roles in agroforestry: A socio-economic analysis of Embu and Kirinyaga
Districts, Kenya. Ph.D. thesis, Faculty of Agriculture, Sokoine University.
Njuki, J., and F. Verdeaux. 2001. Changes in land use and land management in the Eastern Highlands
of Kenya: Before land demarcation to the present. Nairobi: International Centre for Research in
Agroforestry (mimeo).
Nkonya, E. M. 2002. Uganda crop trader characteristics and their marketing constraints. East
African Journal of Rural Development 1891: 23ş39.
440
REFERENCES
Nkonya, E., J. Pender, D. Ssserunkuuma, and P. Jagger. 2002. Development pathways and land
management in Uganda. Paper presented at Workshop on Policies for Improved Land Man-
agement in Uganda, Africana Hotel, Kampala, Uganda, April 17ş18, 2002.
Nkonya, P., J. Pender, P. Jagger, D. Sserunkuuma, C. K. Kaizzi, and H. Ssali. 2004. Strategies for sus-
tainable land management and poverty reduction in Uganda. Research Report No. 133. Wash-
ington, D.C.: IFPRI.
Nkonya, E., J. Pender, K. Edward, S. Mugarura, and J. Muwonge. 2005a. Who knows, who cares?
Determinants of enactment, awareness, and compliance with community natural resource manage-
ment bylaws in Uganda. CAPRi Working Paper No. 41. Washington, D.C.: IFPRI.
Nkonya, E., J. Pender, C. Kaizzi, K. Edward, and S. Mugarura. 2005b. Policy options for increasing
crop productivity and reducing soil nutrient depletion and poverty in Uganda. Environment and
Production Technology Division Discussion Paper No. 134. Washington, D.C.: IFPRI.
North, D. C. 1990. Institutions, institutional change and economic performance. Cambridge: Cam-
bridge University Press.
Nyoro, J. 1999. Trends in regional agricultural productivity in Kenya. Kenya Agricultural Marketing
and Policy Analysis Project, Tegemeo Institute, Egerton University, Kenya Agricultural Research
Institute, and Michigan State University (mimeo).
Nyssen, J., M. Haile, J. Moeyersons, J. Poesen, and J. Deckers. 2004. Environmental policy in
Ethiopia: A rejoinder to Keeley and Scoones. Journal of Modern African Studies 42 (1):
137ş147.
Nziguheba, G., R. Merckx, and C. A. Palm. 2002. Soil phosphorus dynamics and maize response to
different rates of phosphorus fertilizer applied to an acrisol in western Kenya. Plant and Soil
243: 1ş10.
Okumu, B. N., M. A. Jabbar, D. Colman, and N. Russell. 2002. A bioeconomic model of inte-
grated crop-livestock farming systems: The case of the Ginchi watershed in Ethiopia. In Nat-
ural resources management in African agriculture: Understanding and improving current practices.
Wallingford, U.K.: CABI.
Oldeman, L., Hakkeling, R., and W. Sombroek. 1991. World map of the status of human induced soil
degradation: An explanatory note, 2nd ed. Wageningen, The Netherlands: International Soil
Reference and Information Centre, and Nairobi, Kenya: UNEP.
Olson, M. 1965. The logic of collective action. Public goods and the theory of groups. Cambridge, Mass.,
U.S.A.: Harvard University Press.
Omamo, S. W. 1998. Transport costs and smallholder cropping choices: An application to Siaya
district, Kenya. American Journal of Agricultural Economics 80 (1): 116ş123.
Oriade, C. A., and C. R. Dillon. 1997. Developments in biophysical and bioeconomic simulation
of agricultural systems: a review. Agricultural Economics 17: 45ş48.
REFERENCES
441
Ostrom, E. 1990. Governing the commons: The evolution of institutions for collective action. Cam-
bridge: Cambridge University Press.
Otsuka, K., and Y. Hayami. 1988. Theories of share tenancy: A critical survey. Economic Develop-
ment and Cultural Change 37 (1): 31ş68.
Otsuka, K., and F. Place. 2001a. Issues and theoretical framework. In Land tenure and natural resource
management: A comparative study of agrarian communities in Asia and Africa, ed. K. Otsuka and
F. Place. Baltimore, Md., U.S.A.: Johns Hopkins University Press.
Otsuka, K., and F. Place (eds.). 2001b. Land tenure and natural resource management: A comparative
study of agrarian communities in Asia and Africa. Baltimore, Md., U.S.A.: Johns Hopkins Uni-
versity Press.
Otsuka, K., H. Chuma, and Y. Hayami. 1992. Land and labor contracts in agrarian economies:
Theories and facts. Journal of Economic Literature 30: 1965ş2018.
Ouwerkerk, C. van. 1990. Use of single oxen for crop cultivation in Ethiopia. Soil and Tillage
Research 16: 417.
Owuor, J. 1999. Determinants of agricultural productivity in Kenya. Kenya Agricultural Marketing
and Policy Analysis Project, Tegemeo Institute, Egerton University, Kenya Agricultural Research
Institute, and East Lansing, Mich., U.S.A.: Michigan State University (mimeo).
Pagiola, S. 1996. Price policy and returns to soil conservation in semi-arid Kenya. Environmental
and Resource Economics 8: 251ş271.
Palm, C. A., K. E. Giller, P. L. Mafongoya, and M. J. Swift. 2001. Management of organic matter
in the tropics: Translating theory into practice. Nutrient Cycling in Agroecosystems 61: 63ş75.
Park, S. J., and P. L. G. Vlek. 2002. Environmental correlation of three-dimensional soil spatial vari-
ability: A comparison of three adaptive techniques. Geoderma 109(1ş2): 117ş140.
Parrott, N., and F. Kalibwani. 2005. Africa. In The world of organic agriculture: Statistics and emerg-
ing trends 2004, ed. H. Willer and M. Yussefi. Bonn: International Federation of Organic
Agriculture Movements.
Parrott, N., and B. van Elzakker. 2003. Organic and like-minded movements in Africa. Bonn: Inter-
national Federation of Organic Agricultural Movements.
Peeler, E. J., and A. O. Omore. 1997. Manual of livestock production systems in Kenya, 2nd ed.
Nairobi: Kenya Agricultural Research Institute.
Pender, J. 1996. Discount rates and credit markets: Theory and evidence from rural India. Journal
of Development Economics 50: 257ş296.
------. 1998. Population growth, agricultural intensification, induced innovation and natural
resource sustainability: An application of neoclassical growth theory. Agricultural Economics
19: 99ş112.
442
REFERENCES
------. 2001. Rural population growth, agricultural change and natural resource management
in developing countries: A review of hypotheses and some evidence from Honduras. In Popu-
lation matters: demographic change, poverty and economic growth in developing countries, ed.
N. Birdsall, S. Sinding, and A. Kelley. Oxford: Oxford University Press.
------. 2004. Targeting rural investments in the highlands of northern Ethiopia. Paper prepared
for USAID/Ethiopia. Washington, D.C.: IFPRI, Environment and Production Technology
Division (mimeo).
Pender, J. P., and M. Fafchamps. 2006. Land lease markets and agricultural efficiency in Ethiopia.
Journal of African Economies 15 (2): 251ş284.
Pender, J., and B. Gebremedhin. 2004. Impacts of policies and technologies in dryland agriculture:
Evidence from northern Ethiopia. In Challenges and strategies for dryland agriculture, ed. S. C.
Rao. CSSA Special Publication 32. Madison, Wisc., U.S.A.: American Society of Agronomy
and Crop Science Society of America.
Pender, J., and P. Hazell. 2000. Promoting sustainable development in less-favored areas. 2020
Vision, Focus 4. Washington, D.C.: IFPRI.
Pender, J., and J. Kerr. 1998. Determinants of farmers' indigenous soil and water conservation
investments in India's semi-arid tropics. Agricultural Economics 19: 113ş125.
------. 1999. The effects of land sales restrictions: Evidence from south India. Agricultural Eco-
nomics 21: 279ş294.
Pender, J., and S. J. Scherr. 2002. Organizational development and natural resource management:
Evidence from Central Honduras. In Property rights, collective action, and technologies for natu-
ral resource management, ed. R. Meinzen-Dick, A. Knox, F. Place, and B. Swallow. Baltimore,
Md., U.S.A.: Johns Hopkins University Press.
Pender, J., B. Gebremedhin, and M. Haile. 2002. Livelihood strategies and land management prac-
tices in the highlands of Tigray. Paper presented at the Workshop on Policies for Sustainable
Land Management in the Highlands of Tigray, Axum Hotel, Mekelle, Ethiopia, March 28ş29,
2002.
Pender, J., F. Place, and S. Ehui. 1999. Strategies for sustainable agricultural development in the East
African Highlands. Environment and Production Technology Division Discussion Paper No. 41.
Washington, D.C.: IFPRI.
Pender, J., S. J. Scherr, and G. Durˇn. 2001. Pathways of development in the hillsides of Honduras:
Causes and implications for agricultural production, poverty, and sustainable resource use.
In Tradeoffs or synergies? Agricultural intensification, economic development and the environment,
ed. D. R. Lee and C. B. Barrett. Wallingford, U.K.: CABI.
Pender, J., B. Gebremedhin, S. Benin, and S. Ehui. 2001a. Strategies for sustainable development in
the Ethiopian highlands. American Journal of Agricultural Economics 83 (5): 1231ş1240.
REFERENCES
443
Pender, J., P. Jagger, E. Nkonya, and D. Sserunkuuma. 2001b. Development pathways and land man-
agement in Uganda: Causes and implications. EPTD Discussion Paper No. 85. Washington,
D.C.: IFPRI.
------. 2004a. Development pathways and land management in Uganda. World Development 32
(5): 767ş792.
Pender, J., E. Nkonya, P. Jagger, D. Sserunkuuma, and H. Ssali. 2004b. Strategies to increase agri-
cultural productivity and reduce land degradation: Evidence from Uganda. Agricultural Eco-
nomics 31 (2/3): 181ş195.
Pender, J., S. Ssewanyana, K. Edward, and E. Nkonya. 2004c. Linkages between poverty and land
management in rural Uganda: Evidence from the Uganda National Household Survey, 1999/2000.
Environment and Production Technology Division Discussion Paper No. 122. Washington,
D.C.: IFPRI.
Pieri, C. 1989. FertilitÚ des terres de savanes: Bilan de trente ans de recherche et de dÚveloppement agri-
cole au sűd du Sahara. Paris: Ministier de la CoopÚration.
Pingali, P., Y. Bigot, and H. P. Binswanger. 1987. Agricultural mechanization and the evolution of
farming systems in sub-Saharan Africa. Baltimore, Md., U.S.A.: Johns Hopkins University
Press.
Pinstrup-Andersen, P., and R. Pandya-Lorch. 1994. Alleviating poverty, intensifying agriculture, and
effectively managing natural resources. Food, Agriculture, and the Environment Discussion
Paper 1. Washington, D.C.: IFPRI.
Place, F. 2002. Land markets in SSA: preconditions, potentials and limitations. Paper presented at
the conference on Land Issues in Africa, April 29şMay 2, 2002, Africana Hotel, Kampala.
Place, F., and P. Hazell. 1993. Productivity effects of indigenous land tenure systems in sub-Saharan
Africa. American Journal of Agricultural Economics 75 (1): 10ş19.
Place, F., and K. Otsuka. 2000. Population pressure, land tenure and tree resource management
in Uganda. Land Economics 76 (2): 233ş251.
Place, F., and B. Swallow. 2000. Assessing the relationships between property rights and technology adop-
tion in smallholder agriculture: A review of issues and empirical methods. CAPRi Working Paper
No. 2. Washington, D.C.: IFPRI.
Place, F., J. Ssenteza, and K. Otsuka. 2001. Customary and private land management in Uganda.
In Land tenure and natural resource management: A comparative study of agrarian communities in
Asia and Africa, ed. K. Otsuka and F. Place. Baltimore, Md., U.S.A.: Johns Hopkins Univer-
sity Press.
Place, F., S. Franzel, Q. Noordin, and B. Jama. 2004. Improved fallows in Kenya: History, farmer
practice, and impacts. Environment and Production Technology Division Discussion Paper
No. 115. Washington, D.C.: IFPRI.
444
REFERENCES
Place, F., S. Franzel, J. Dewolf, R. Rommelse, F. Kwesiga, A. Niang, and B. Jama. 2002a. Agro-
forestry for soil fertility replenishment: Evidence on adoption processes in Kenya and Zambia.
In Natural resources management in African agriculture: Understanding and improving current
practices, ed. C. Barrett, F. Place, and A. Abdillahi. Wallingford, U.K.: CABI.
Place, F., Kariuki, G., Wangila, J., Kristjanson, P., Makauki, A., and J. Ndubi. 2002b. Assessing the
factors underlying differences in group performance: methodological issues and empirical findings
from the highlands of Central Kenya. CAPRi Working Paper No. 25. Washington, D.C.: IFPRI.
Place, F., Swallow, B. M., Wangila, J. W., and Barrett, C. B. 2002c. Lessons for natural resource
management technology adoption and research. In Natural resources management in African
agriculture: Understanding and improving current practices, ed. C. B. Barrett, F. Place, and
A. Abdillahi. Wallingford, U.K.: CABI.
Platteau, J.-P. 1996. The evolutionary theory of land rights as applied to sub-Saharan Africa: A crit-
ical assessment. Development and Change 27: 29ş85.
Principe, J. C., N. R. Euliano, and W. C. Lefebvre. 2000. Neural and adaptive systems: Fundamentals
through simulations. New York: John Wiley & Sons.
Putnam, R. D. 1995. Bowling alone: America's declining social capital. Journal of Democracy 6 (1):
65ş78.
Quisumbing, A., J. B. Aidoo, E. Payongayong, and K. Otsuka. 2002. Agroforestry management in
Ghana. In Land tenure and natural resource management: A comparative study of agrarian com-
munities in Asia and Africa, ed. K. Otsuka and F. Place, pp. 53ş96. Baltimore, Md., U.S.A.:
Johns Hopkins University Press.
Rahmato, D. 1984. Agrarian reform in Ethiopia. Uppsala: Scandinavian Institute of African Studies.
Rasmussen, L. N., and R. Meinzen-Dick. 1995. Local organizations for natural resource management:
Lessons from theoretical and empirical literature. Environment and Production Technology Divi-
sion Discussion Paper 11. Washington, D.C.: IFPRI.
Raussen, T., F. Place, W. Bamwerinde, and F. Alacho. 2002. Report on a survey to identify suitable
agricultural and natural resourceşbased technologies for intensification in southwestern Uganda.
Washington, D.C.: International Centre for Research in Agroforestry and IFPRI.
Reardon, T. 1997. Using evidence of household income diversification to inform study of the rural
nonfarm labor market in Africa. World Development 25 (5): 735ş748.
Reardon, T., and S. Vosti. 1995. Links between rural poverty and the environment in developing
countries: Asset categories and investment poverty. World Development 23 (9): 1495ş1506.
Reardon, T., E. Crawford, and V. Kelly. 1994. Links between non-farm income and farm invest-
ment in African households: Adding the capital market perspective. American Journal of Agri-
cultural Economics 76 (5): 1172ş1176.
REFERENCES
445
Reardon, T., C. Barrett, V. Kelly, and K. Savadogo. 2001. Sustainable versus unsustainable agricul-
tural intensification in Africa: Focus on policy reforms and market conditions. In: Tradeoffs or
synergies? Agricultural intensification, economic development and environment, ed. D. Lee and
C. B. Barrett. New York: CABI.
Renard, K. G., G. R. Foster, G. A. Weesies, and J. P. Porter. 1991. RUSLE: Revised Universal Soil
Loss Equation. Journal of Soil and Water Conservation 46 (1): 30ş33.
Republic of Kenya. 1997. Welfare Monitoring Survey III. Central Bureau of Statistics, Office of the
Vice-President and Ministry of Planning and National Development. Nairobi: Government
Printers.
------. 2002. 1999 Housing and Population Census. Nairobi: Central Bureau of Statistics.
------. 2003. Geographic dimensions of well-being in Kenya: Where are the poor, Volume 1. Nairobi:
Central Bureau of Statistics.
Republic of Uganda. 1992. Report on Uganda national census of agriculture and livestock 1990ş91.
Entebbe: Ministry of Agriculture, Animal Industry and Fisheries.
------. 1998. Land Act, 1998. Kampala, Uganda: Government Printer.
------. 2003. Uganda Poverty Status Report 2003. Kampala: Ministry of Finance, Planning and Eco-
nomic Development.
Republic of Uganda and FAO. 1999. Soil fertility initiative. Entebbe: National Agricultural Research
Organization (NARO) and FAO.
RESAL Ethiopia. 2000. Income diversification in Amhara: The need for a strategy. Consultancy
report for RESAL (European Food Security Network). Louvain-la-Neuve, Belgium: ADE.
REST (Relief Society of Tigray). 1995. Farming systems, resource management and household cop-
ing strategies in northern Ethiopia: Report of a social and agro-ecological baseline study in
central Tigray. Oslo: NORIGRIC.
Rogers, E. M. 1995. Diffusion of innovations, 4th ed. New York: Free Press.
Rommelse, R. 2001a. The impact of improved fallows and biomass transfer on household poverty indi-
cators in western Kenya. Natural Resources Problems, Priorities and Policies Programme Work-
ing Paper 2001-3. Nairobi: International Centre for Research in Agroforestry.
------. 2001b. Economic analyses of on-farm biomass transfer and improved fallow trials in western
Kenya. Natural Resources Problems, Priorities and Policies Programme Working Paper 2001-2.
Nairobi: International Centre for Research in Agroforestry.
Roose, E., and B. Barthes. 2001. Organic matter management for soil conservation and productiv-
ity restoration in Africa: A contribution from Francophone research. Nutrient Cycling in Agro-
ecosystems 61: 159ş170.
446
REFERENCES
Ruben, R., G. Kruseman, and A. Kuyvenhoven. 2006. Strategies for sustainable intensification in
the East African highlands: Labour use and input efficiency. Agricultural Economics 34 (2):
167ş181.
Ruecker, G., S. J. Park, H. Ssali, and J. Pender. 2003. Strategic targeting of development policies to a
complex region: A GIS-based stratification applied to Uganda. ZEF Discussion Papers on Devel-
opment Policy, Discussion Paper No. 69. Bonn: Center for Development Research, University
of Bonn.
Runge, C. F. 1992. Common property and collective action in economic development. In Making
the commons work: Theory, practice and policy, ed. D. W. Bromley, pp. 41ş62. San Francisco:
International Center for Self-Governance.
Ruthenberg, H. 1980. Farming systems in the tropics. Oxford: Clarendon Press.
------. 1985. Innovation policy for small farmers in the tropics: The economics of technical innovations
for agricultural development. Oxford: Clarendon Press.
Salehi-Isfahani, D. 1988. Technology and preferences in the Boserup model of agricultural growth.
Journal of Development Economics 28 (2): 175ş191.
Sanchez, P. A., K. D. Shepherd, M. J. F. M. Soule, R. J. Place, A. N. Burez, A. N. Izac, A. U. Mok-
wunye, F. R. Kwesiga, C. G. Ndiritu, and P. L. Woomer. 1997. Soil fertility in Africa: An
investment in natural resource capital. In Replenishing soil fertility in Africa, ed. R. J. Buresh,
P. A. Sanchez, and F. Calhoun. Madison, Wisc., U.S.A.: Soil Science Society of America.
Sanchez, P., M. S. Swaminathan, P. Dobie, and N. Yuksel. 2005. Halving hunger: It can be done.
New York: UN Millennium Project.
Sanders, J., S. Ramaswamy, and B. Shapiro. 1995. Economics of agricultural technology development
in semi-arid sub-Saharan Africa. Baltimore, Md., U.S.A.: Johns Hopkins University Press.
Sandler, T. 1992. Collective action: Theory and applications. Ann Arbor, Mich., U.S.A.: University of
Michigan Press.
Savadogo, M. 2000. Crop residue management in relation to sustainable land use. A case study for
Burkina Faso. Ph.D. thesis, Wageningen Agricultural University, Wageningen, The Netherlands.
Savenije, H., and T. van Zutphen. 1991. The struggle against desertification in Burkina Faso. In
Making haste slowly: Strengthening local environmental management in agricultural development,
ed. H. Savenije and A. Huijsman, pp. 116ş129. Amsterdam: Royal Tropical Institute KIT.
Scherr, S. J. 1999. Soil degradation: A threat to developing country food security by 2020? Food, Agri-
culture and Environment Discussion Paper 27. Washington, D.C.: IFPRI.
Scherr, S., and P. Hazell. 1994. Sustainable agricultural development strategies in fragile lands. Envi-
ronment and Production Technology Division Discussion Paper No. 1. Washington, D.C.:
IFPRI.
REFERENCES
447
Scherr, S. J., G. Bergeron, J. Pender, and B. Barbier. 1996. Policies for sustainable development in frag-
ile lands: Methodology overview. Environment and Production Technology Division. Washing-
ton, D.C.: IFPRI (mimeo).
Schluter, J. 2003. A study of the coffee market and proposal for a forward auction and coffee
exchange. Washington, D.C.: IFPRI (mimeo).
Semalulu, O., A. A. Akwang, and B. Nakileza. 1999. Needs assessment for agricultural research in the
Mount Elgon Hillsides farming systems. NARO-DFID-SRI-MUK report, p. 222. National Agri-
cultural Research Organization, Entebbe, Uganda.
Sen, A. 1975. Employment, technology, and development. London: Oxford University Press.
Shaban, R. A. 1987. Testing between competing models of sharecropping. Journal of Political Econ-
omy 95 (5): 893ş920.
Shaxson, T. F. 1988. Conserving soil by stealth. In Conservation farming on steeplands, ed. W. C.
Moldenhauer and N. W. Hudson. Ankeny, Ia., U.S.A.: Soil and Water Conservation Society
and World Association of Soil and Water Conservation.
Shepherd, K., and M. Walsh. 2001. Light reflectance provides rapid assessment of soil quality. Nat-
ural Resources Problems, Priorities, and Policies Working Paper 2001-1, International Centre
for Research in Agroforestry. Nairobi: ICRAF.
------. 2002. Development of reflectance spectral libraries for characterization of soil properties.
Soil Science Society of America Journal 66: 988ş998.
Shiferaw, B., and S. T. Holden. 1998. Resource degradation and adoption of land conservation
technologies in the Ethiopian highlands: A case study in Andit Tid, North Shewa. Agricultural
Economics 18: 233ş247.
------. 2000. Policy instruments for sustainable land management: the case of highland small-
holders in Ethiopia. Agricultural Economics 22: 217ş232.
------. 2001. Farm level benefits to investments for mitigating land degradation: Empirical evidence
from Ethiopia. Environment and Development Economics 6: 335ş358.
Shipton, P. 1988. The Kenyan land tenure reform: Misunderstandings in the public creation of pri-
vate property. In Land and society in contemporary Africa, ed. R. E. Downs and S. P. Reyna,
pp. 91ş135. Hanover, N.H., U.S.A.: University Press of New England.
Sianga, C. W. 1995. Land has come back: Lessons from a soil conservation project in the Dodoma
region of Tanzania. Norwegian Journal of Agricultural Sciences Supplement 25: 81ş86.
Sileshi, Z., A. Tegegne, and G. T. Tsadik. 2003. Water resources for livestock in Ethiopia: Implications
for research and development. In Integrated water and land management research and capacity
building priorities for Ethiopia, ed. P. G. McCornick, A. B. Kamara, and G. Tadesse. Proceed-
ings of a MoWR/EARO/IWMI/ILRI international workshop held at ILRI, Addis Ababa,
448
REFERENCES
Ethiopia, December 2ş4, 2002. Colombo, Sri Lanka: International Water Management Insti-
tute (IWMI), and Nairobi, Kenya: International Livestock Research Institute (ILRI).
Singh, I., L. Squire, and J. Strauss. 1986. Agricultural household models: Extensions, applications and
policy. Baltimore, Md., U.S.A.: Johns Hopkins University Press.
Singh, M., M. N. A. Kumar, S. N. Rai, and P. K. Pradhan. 1993. Urea-ammonia treatment of straw
under village conditions. Reasons for success and failure. In Feeding of ruminants on fibrous
crop residues (proceedings), ed. K. Singh and J. B. Schiere, pp. 298ş296. New Delhi, India:
Indian Council of Agricultural Research.
Sjaastad, E., and D. W. Bromley. 1997. Indigenous land rights in sub-Saharan Africa: Appropria-
tion, security and investment demand. World Development 25 (4): 549ş562.
Smale, M., and T. Jayne. 2003. Maize in eastern and southern Africa: "Seeds" of success in retrospect.
Environment and Production Technology Division Discussion Paper 97. Washington, D.C.:
IFPRI.
Smaling, E. M. A., S. M. Nandwa, and B. H. Janssen. 1997. Soil fertility in Africa is at stake. In
Replenishing soil fertility in Africa, ed. R. J. Buresh, P. A. Sanchez, and F. Calhoun, pp. 151ş192.
SSSA Special Publication 51. Madison, Wisc., U.S.A.: Soil Science Society of America and
American Society of Agronomy.
Smith, R. J., and R. W. Blundell. 1986. An exogeneity test for a simultaneous equation Tobit model
with an application to labor supply. Econometrica 54: 679ş685.
Smithson, P., B. Jama, R. J. Delve, P. van Straaten, and R. Buresh. 2003. East African phosphate
resources and their agronomic performance. In Direct application of phosphate rock and related
technology: Latest developments and practical experiences, ed. S. S. S. Rajan and S. H. Chien,
pp. 123ş133. Proceedings of international meeting, Kuala Lumpur, Malaysia, July 16ş20, 2001.
Muscle Shoals, Ala., U.S.A.: International Center for Soil Fertility and Agricultural Development.
Sonneveld, B. G. J. S. 2002. Land under pressure: The impact of water erosion on food production
in Ethiopia. Ph.D. dissertation, Free University of Amsterdam.
Soule, M., and K. D. Shepherd. 2000. An ecological and economic analysis of phosphorus replen-
ishment for Vihiga Division, western Kenya. Agricultural Systems 64: 83ş98.
Ssali, H. 2003. Soil organic matter and its relationship to soil fertility changes in Uganda. In Policies
for sustainable land management in the East African highlands, ed. S. Benin, J. Pender, and
S. Ehui. Summary of papers and proceedings of the conference held at the United Nations
Economic Commission for Africa, Addis Ababa, Ethiopia, April 24ş26. Environment and Pro-
duction Technology Division Workshop Summary Paper No. 13. Washington, D.C.: IFPRI.
Sserunkuuma, D., J. Pender, and E. Nkonya. 2001. Land management in Uganda: Characterization
of problems and hypotheses about causes and strategies for improvement. Washington, D.C.: IFPRI,
Environment and Production Technology Division (mimeo).
REFERENCES
449
Staal, S., L. Chege, M. Kenyanjui, A. Kimari, B. Lukuyu, D. Njubi, M. Owango, J. Tanner,
W. Thorpe, and M. Wambugu. 1997. Characterisation of dairy systems supplying the Nairobi
milk market: A pilot survey in Kiambu District for the identification of target groups of producers.
Nairobi: KARI/MoA/ILRI Collaborative Research Project Report.
Staal, S. J., I. Baltenweck, M. M. Waithaka, T. de Wolff, and L. Njoroge. 2002. Location and uptake:
Integrated household and GIS analysis of technology adoption and land use, with application
to smallholder dairy farms in Kenya. Agricultural Economics 27: 295ş315.
Stahl, M. 1990. Constraints to environmental rehabilitation through people's participation in the northern
Ethiopian highlands. United Nations Research Institute for Social Development (UNRISD)
Discussion Paper 13. Geneva, Switzerland.
StataCorp. 2003. Stata statistical software: Release 8.0. Reference manual. College Station, Tex., U.S.A.:
Stata Corporation.
------. 2005. Stata statistical software: Version 8.2. College Station, Tex., U.S.A.: Stata Corporation.
Stiglitz, J. E. 1993. Economics. New York: W. W. Norton.
Stocking, M. 1996. Soil erosion: Breaking new ground. In The lie of the land: Challenging received
wisdom on the African environment, ed. M. Leach and R. Mearns. London: International
African Institute in association with James Currey.
Stoorvogel, J., and E. Smaling. 1990. Assessment of soil nutrient depletion in sub-Saharan Africa: 1983ş
2000. Report No. 28, Vols. 1ş4. Wageningen, The Netherlands: Winand Staring Center.
Stoorvogel, J. J., E. M. A. Smaling, and B. H. Janssen. 1993. Calculating soil nutrient balances at
different scales. Fertilizer Research 35: 227ş235.
Sutcliffe, J. P. 1993. Economic assessment of land degradation in the Ethiopian highlands: A case study.
Addis Ababa: National Conservation Strategy Secretariat, Ministry of Planning and Economic
Development, Transitional Government of Ethiopia.
Suttie, J. M. 2000. Hay and straw conservation. For small-scale and pastoral conditions, p. 303. FAO
Plant Production and Protection Series No. 29. Rome: FAO.
Swallow, B. W., and D. W. Bromley. 1995. Institutions, governance and incentives in common
property regimes for African rangelands. Environment and Resource Economics 6: 99ş118.
Swallow, B., J. Wangila, W. Mulatu, O. Okello, and N. McCarthy. 2002. Collective action in space:
Assessing how cooperation and collective action vary across an African landscape. In Innova-
tion in natural resource management: The role of property rights and collective action in developing
countries, ed. R. Meinzen-Dick, A. Knox, F. Place, and B. Swallow. Baltimore, Md., U.S.A.:
Johns Hopkins University Press.
Swift, M. J., P. D. Seward, P. G. H. Frost, J. N. Qureshi, and F. N. Muchena. 1994. Long-term
experiments in Africa: developing a database for sustainable land use under global change. In
450
REFERENCES
Long term experiments in agricultural and ecological sciences, ed. F. A. Leigh and A. E. Johnston.
Wallingford, U.K.: CABI.
Swinkels, R., and S. Franzel. 1997. Adoption potential of hedgerow intercropping in the maize-
based cropping systems in the highlands of western Kenya. Part II: Economic and farmers
evaluation. Experimental Agriculture 33: 211ş233.
Swinkels, R. A., S. Franzel, K. D. Shepard, E. Ohlsson, and J. K. Ndufa. 1997. The economics of
short rotation improved fallows: Evidence from areas of high population intensity in western
Kenya. Agricultural Systems 55: 99ş121.
Taa, A., D. Tanner, A. T. P. Bennie. 2004. Effect of stubble management, tillage and cropping
sequence on wheat production in the south-eastern highlands of Ethiopia. Soil and Tillage
Research 76: 69ş82.
Technical Committee on Agroforestry in Ethiopia. 1990. Agroforestry: Potentials and research needs
for the Ethiopian highlands. Nairobi: International Centre for Research on Agroforestry.
Tedros, A. G., H. Mitiku, H. W. Karen, A. Getachew, M. Ambachew, Y. Mekonnen, D. Hailay, W. L.
Steven, and B. Peter. 1999. Incidence of malaria among children living near dams in northern
Ethiopia. British Medical Journal 319: 663ş666 (cited by Mintesinot and Mitiku 2003).
Tesfay, G., M. Haile, B. Gebremedhin, J. Pender, and E. Yazew. 2000. Small-scale irrigation in
Tigray: Management and institutional considerations. Paper presented at a seminar on Policies
for Sustainable Land Management in the Highlands of Ethiopia, May 22ş23. International
Livestock Research Institute Socio-economics and Policy Research Working Paper No. 30.
Nairobi: ILRI.
Tiessen, H., E. V. S. B. Samprio, and I. H. Salcedo. 2001. Organic matter turnover and manage-
ment in low input agriculture of NE Brazil. Nutrient Cycling in Agroecosystems 61: 99ş103.
Tiffen, M., M. Mortimore, and F. Gichuki. 1994. More people--less erosion: Environmental recovery
in Kenya. London: John Wiley & Sons.
Tolera, A, and F. Sundst°l. 1999. Morphological fractions of maize stover harvested at different
stages of grain maturity and nutritive value of different fractions of the stover. Animal Feed Sci-
ence and Technology 81: 1ş16.
Transparency International. 2004. Global corruption report. Berlin.
Tukahirwa. J. 1996. Measurement, prediction and social ecology of soil erosion in Kabale, South-
western Uganda. Unpublished doctoral dissertation, Institute of Environment and Resource
Management, Makerere University, Uganda.
Turner, R. K., D. Pearce, and I. Bateman. 1993. Environmental economics: An elementary introduc-
tion. Baltimore, Md., U.S.A.: Johns Hopkins University Press.
UNCTAD (United Nations Conference on Trade and Development). 2003. World investment report
2003, FDI policies for development: National and international perspectives. Geneva: UNCTAD.
REFERENCES
451
UNDP (United Nations Development Programme). 1997. Horn of Africa: The monthly review, 21st
Februaryş28th April. Addis Ababa: UNDP, Emergencies Unit for Ethiopia. http://www.sas.
upenn.edu/African_Studies/eue_web/hoa0497.htm.
UNECA. 1997. Livestock development in Tigray: Forage development strategy as a major entry point
towards sustainable minimum grazing system, Part I. Addis Ababa: Sustainable Development
and Environmental Rehabilitation Program (SAERP), United Nations Economic Commission
for Africa.
UNEP (United Nations Environment Programme). 2002. Global environmental outlook 3. Nairobi,
Kenya.
United Nations. 2001. World urbanization prospects. Department of Economic and Social Affairs,
Population Division. Rome.
Uphoff, N. 1993. Grassroots organizations and NGOs in rural development: Opportunities for
diminishing states and expanding markets. World Development 21 (4): 606ş622.
USDA (United States Department of Agriculture). 1990. World agriculture: Trends and indicators,
1970ş89. USDA Statistical Bulletin 815. Washington, D.C.
Van den Bosch, H., J. N. Gitari, V. N. Ogaro, S. Maobe, and J. Vlaming. 1998. Monitoring nutri-
ent flows and economic performance in African farming systems (NUTMON). Monitoring
nutrient flows and balances in three districts in Kenya. Agriculture, Ecosystems and Environment
71: 63ş80.
Varughese, G., and E. Ostrom. 2001. The contested role of heterogeneity in collective action: Some
evidence from community forestry in Nepal. World Development 29 (5): 747ş765.
Vlek, P. L. G. 1990. The role of fertilizers in sustaining agriculture in sub-Saharan Africa. Fertiliser
Research 26: 327ş339.
von ThŘnen, J. 1826. The isolated state, English ed. London: Pergamon.
Vosti, S., and T. Reardon. 1997. Sustainability, growth, and poverty alleviation: A policy and agro-
ecological perspective. Baltimore, Md., U.S.A.: Johns Hopkins University Press.
Vredeseilanden-Coopibo-Uganda, SNV-Uganda, and Oxfam-Uganda. 1998. Participatory research
carried out in Arua, Iganga, Kitgum and Pallisa Districts. Vredeseilanden-Coopibo-Uganda,
Kampala, Uganda.
Waata, F., B. Jama, and R. J. Delve. 2002. Integrated soil productivity initiative through research
and education (INSPIRE): A collaborative effort to improve livelihoods in Tororo District,
Uganda. Project report. CIAT, Kampala, Uganda.
Wade, R. 1987. The management of common property resources: Finding a cooperative solution.
World Bank Research Observer 2 (2): 219ş234.
------. 1988. Village republics. Cambridge: Cambridge University Press.
452
REFERENCES
Wangila, J. 2000. Proceedings of workshop for local policy makers in western Kenya. Nairobi: Inter-
national Centre for Research in Agroforestry (mimeo).
Wangila, J., J. de Wolf, and R. Rommelse. 1999. Characterization of households in the pilot project
area of western Kenya. Nairobi: International Centre for Research in Agroforestry (mimeo).
WCED (World Commission on Environment and Development). 1987. Our common future. Oxford:
Oxford University Press.
Webb, P., J. von Braun, and Y. Yohannes. 1992. Famine in Ethiopia: Policy implications of cropping
failure at the national and household levels. Research Report 92. Washington, D.C.: IFPRI.
Westlake, M. 1998. Strategy for development of the coffee sector. Project Report PA-6. Decentraliza-
tion Support Activity Project, Ministry of Finance and Ministry of Economic Development
and Cooperation, Addis Ababa, Ethiopia.
White, A. T., and C. F. Runge. 1995. The emergence and evolution of collective action: Lessons
from watershed management in Haiti. World Development 23 (10): 1683ş1698.
Woelcke, J. 2003. Bio-economics of sustainable land management in Uganda. Developing Economics
and Policy Series. Frankfurt: Peter Lang.
Woldehanna, T., and T. Alemu. 2002. Poverty profile of Ethiopia: 1995/96 and 1999/00. A report pre-
pared for the Ministry of Finance and Economic Development (MOFED). Addis Ababa, Ethiopia:
MOFED.
Wondafrash, H., L. Grace, and T. Assefa. 1998. Rural credit study in Amhara National Regional
State (ANRS). Bahir Dar, Ethiopia: ANRS.
Wood, S., K. Sebastian, F. Nachtergaele, D. Nielsen, and A. Dai. 1999. Environment and Produc-
tion Technology Division Discussion Paper No. 44. Washington, D.C.: IFPRI.
World Bank. 1996. Uganda: The challenge of growth and poverty reduction. Country study. Washing-
ton, D.C.
------. 2002a. World Bank development report. Washington, D.C.
------. 2002b. World development indicators database. http://www.worldbank.org/html/extdr/
regions.htm#u.
------. 2003. The little green data book. Washington, D.C.
Wortmann, C. S., and C. A. Eledu. 1999. Uganda's agroecological zones: A guide for planners and
policy makers. Kampala, Uganda: Centro Internacional de Agricultura Tropical (CIAT).
Wortmann, C. S., and C. K. Kaizzi. 1998. Nutrient balances and expected effects of alternative
practices in farming systems of Uganda. Agriculture, Ecosystems and Environment 71: 115ş129.
Yared, A., A. Yigremew, T. Degafa., A. P. Castro, and P. D. Little. 2000. Food security and resource
access. A final report on the community assessment in Soth Wello and Oromiya Zones of Amhara
Region, Ethiopia. BASIS-CRSP/Institute of Development Research, Addis Ababa: Addis Ababa
University.
REFERENCES
453
Yesuf, M. 2004. Risk, time and land management under market imperfection: Applications to
Ethiopia. Ph.D. thesis, Department of Economics, Gothenburg University, Sweden.
Yigremew, A. 1997. Rural landholding readjustment in West Gojjam, Amhara Region. Ethiopian
Journal of Development Research 19 (2): 57ş89.
Yohannes, G. 1989. Land-use, agricultural production and soil conservation methods in the Andit Tid
area, Shewa Region. Research Report 17. Soil Conservation Research Project. Addis Ababa:
Ministry of Agriculture Soil and Water Conservation Development.
You, L., and S. Bolwig. 2003. Alternative growth scenarios for Ugandan coffee to 2020. Environment
and Production Technology Division Discussion Paper No. 98. Washington, D.C.: IFPRI.
You, L., and J. Chamberlin. 2004. Spatial analysis of sustainable livelihood enterprises of Uganda cot-
ton production. EPTD Discussion Paper 121. Washington, D.C.: IFPRI.
Young, A. 1996. The Tigray and Eritrean Peoples Liberation Fronts: A history of tensions and prag-
matism. Journal of Modern African Studies 34 (1): 105ş120.
------. 1997. Agroforestry for soil management, 2nd ed. Wallingford, U.K.: CABI.
Zerbini, Z. E., A. E. Woldu, and B. I. Shapiro. 1999. The potential of cow traction in the East
African Highlands. In Meeting the challenges of animal traction, ed. P. Starkey and P. Kaum-
butho, pp. 199ş211. London: Intermediate Technology Publications.
Contributors
Rahel Asrat is with the Ministry of Agriculture in Addis Ababa, Ethiopia.
Jens B. Aune is an Agro-ecologist in the Department for International Environ-
ment and Development Studies (Noragric) at the Norwegian University of Life
Sciences, Aas, Norway.
Samuel Benin is a research fellow in the Development Strategy and Governance
Division of the International Food Policy Research Institute, Washington, D.C.
He was formerly a postdoctoral scientist with the International Livestock Research
Institute in Addis Ababa, Ethiopia.
Thomas Berger is a visiting professor at the University of Hohenheim, Germany.
Balesh Tulema Bune is with the Holetta Agricultural Research Centre, Holetta,
Ethiopia.
Robert Delve is a senior scientist with the Tropical Soil Biology and Fertility Pro-
gram at the International Center for Tropical Agriculture, Nairobi, Kenya.
Tineke deWolff was a GIS specialist at the International Livestock Research Insti-
tute, Nairobi, Kenya.
Simeon Ehui is lead economist at the World Bank Country Office in Abuja, Nigeria.
He was formerly head of the Livestock Policy Analysis Program at the International
Livestock Research Institute, Nairobi, Kenya.
456
CONTRIBUTORS
Berhanu Gebremedhin is a scientist at the International Livestock Research Insti-
tute, Addis Ababa, Ethiopia.
Stein Holden is a professor of development economics in the Department of Eco-
nomics and Resource Management at the Norwegian University of Life Sciences,
Aas, Norway.
Pamela Jagger is a Ph.D. student of political science at Indiana University, Bloom-
ington. She was formerly a research analyst in the Environment and Production
Technology Division of the International Food Policy Research Institute, Washing-
ton, D.C.
Kayuki C. Kaizzi is a senior research officer at the National Agricultural Research
Organization in Kawanda, Uganda.
Patti Kristjanson is project leader and economist at the International Livestock
Research Institute, Nairobi, Kenya.
Gideon Kruseman is a senior research fellow at the Agricultural Economics
Research Institute in the Hague, the Netherlands.
Russ Kruska is a GIS scientist at the International Livestock Research Institute,
Nairobi, Kenya.
Fridah Mugo is the director of Thuiya Development and Environmental Consul-
tants, Nairobi, Kenya.
Festus Murithi is a department head and economist at the Kenya Agricultural
Research Institute, Nairobi, Kenya.
E. C. Njuguna is an analyst in the Department of Resources Surveys and Remote
Sensing at the Kenya Ministry of Environment and Natural Resources, Nairobi.
Jemimah Njuki is a social scientist at the International Center for Tropical Agri-
culture, Nairobi, Kenya.
Ephraim Nkonya is a research fellow in the Environment and Production Technol-
ogy Division of the International Food Policy Research Institute, Washington, D.C.
Soojin Park is a professor at the Institute of Regional Studies, Seoul National Uni-
versity, Korea.
CONTRIBUTORS
457
John Pender is a senior research fellow in the Environment and Production Tech-
nology Division of the International Food Policy Research Institute, Washington,
D.C., where he leads the research program on Land Resource Management for
Poverty Reduction.
Frank Place is a theme leader and economist at the World Agroforestry Centre,
Nairobi, Kenya.
Joshua Ramisch is a senior research fellow in the Tropical Biology and Soil Fertility
Program at the International Center for Tropical Agriculture, Nairobi, Kenya.
Ruerd Ruben is the chair of development studies and director of the Centre for Inter-
national Development Issues at Radboud University, Nijmegen, the Netherlands.
Bekele Shiferaw is a senior scientist at the International Crops Research Institute
for the Semi-Arid Tropics, Nairobi, Kenya.
Henry Ssali, now retired, was a senior principal research officer and head of the
Soil Fertility Management Programme at the National Agricultural Research
Organization, Kawanda, Uganda.
Dick Sserunkuuma is an assistant professor in the Department of Agricultural
Economics at Makerere University, Kampala, Uganda.
Steve Staal is a theme director and economist at the International Livestock Research
Institute, Nairobi, Kenya.
Dereje Asefa Teklehaimanot is a former M.Sc. student at the Norwegian Univer-
sity of Life Sciences, Aas, Norway, who lives on a farm in Oslo, Norway.c
Girmay Tesfay is a Ph.D. student of development economics at Wageningen Uni-
versity, the Netherlands, and a faculty member at Mekelle University, Ethiopia.
Johannes Woelcke is an economist at the World Bank, Washington, D.C.
Robert Zomer is global coordinator of the Consultative Group on International
Agricultural Research's Consortium for Spatial Information and a scientist at the
International Water Management Institute, Colombo, Sri Lanka.
Index
Page numbers for entries occurring in figures are suffixed by an f, those for entries in notes by an n,
and those for entries in tables by a t. Figures appearing in the color insert pages are designated by f
(color insert).
Absolute advantages, 38
income strategies, 39ş40, 48ş49, 55t, 378,
Access to markets. See Market access
380t; independence tests of, 89ş90; inter-
Acquired immunodeficiency syndrome (AIDS),
action with other development domain
13, 194, 320, 411
dimensions, 46ş49, 85; irrigation and, 44,
Aerial photography, of Kenyan highlands,
48, 55t; in Kenyan highlands, 3f (color
63ş65, 69
insert), 66ş68, 67t, 378, 400ş407; and labor
Africa 2000 Network (A2N), 361ş62
intensity, 40ş41, 55t; and land degradation,
African Highlands Initiative, 171
41, 55t, 380t; and land management,
Agricultural Development Led Industrialization
40ş41, 48ş49, 55t, 298, 378ş79, 380t;
(ADLI, Ethiopia), 142, 217
and livestock, 144ş48, 145tş147t, 151ş64,
Agricultural Finance Cooperation (Kenya), 23
378; and lower- versus higher-value crops,
Agricultural potential, 39ş41, 378ş79; altitude
41; multiple dimensions of, 39, 86ş88, 102;
and, 87ş90, 88t; areas of high, but with less
perfect markets case of, 39ş40; and produc-
favorable market access, strategies for,
tivity, 55t, 176, 380t; and program partici-
401ş4; areas of high, with favorable market
pation, 280, 293, 294t; rainfall and, 86ş88,
access, strategies for, 400ş401; areas with
88t; realistic markets case of, 40; soil quality
lower, strategies for, 404ş7; in comparative
and, 87, 88t; in Uganda, 5f (color insert),
advantages, 39ş41, 48, 84; as dimension of
167ş68, 176, 281, 293, 294t, 298, 378,
development domain, 46ş49, 47t, 66ş68,
400ş407
81ş82, 86, 102; in Ethiopian highlands,
Agricultural productivity. See Productivity
378, 400ş407; in Ethiopian highlands, in
Agricultural research systems, 24, 37; in
less-favored area, 335; in Ethiopian high-
Ethiopia, 24, 317; in Kenya, 24, 323;
lands of Amhara, 8f (color insert), 144ş48,
in Uganda, 24, 279, 323, 373ş74
145tş147t, 151ş64, 222, 228, 236tş239t,
Agricultural sector policies, 22ş24; as critical
242tş247t; in Ethiopian highlands of Tigray,
variable, 28; in Ethiopia, 23ş24, 142ş43;
87ş88, 88t, 100ş104; factor analysis of,
in Kenya, 22ş23, 28, 206ş7; in Uganda, 23,
87ş88, 88t; and income, 379, 380t; and
28, 278. See also specific countries and policies
460
INDEX
Agriculture: macro-, meso-, and micro-level
239t, 390; grazing land in, 142, 146ş47,
factors in, 5ş6; percent of work force
146t, 149, 155ş58, 156t, 161ş62; house-
engaged in, 2; successes in, 3. See also specific
hold-level factors in, 228, 231t; household
concepts, countries, crops, and policies
refuse in, 225, 225t, 235ş40, 237t, 239t;
AIDS, 13, 194, 320, 411
improved seeds in, 225, 225t, 235ş40, 237t,
Alternative land contracts, in Ethiopia, 221ş22
239t; income strategies in, 142; input use in,
Altitude: and agricultural potential, 87ş90,
226, 227t, 240ş41, 242tş244t; irrigation
88t; of East African highlands, 6ş7, 7f; of
in, 151ş64, 235ş40, 248ş49, 393; labor in,
Ethiopian highlands of Tigray, 87ş88, 88t,
226, 227t, 240ş41, 242tş244t, 250; land
91, 92f, 94ş96, 114, 115t; of Kenyan high-
investments in, 224ş25, 224tş225t; land
lands, 2f (color insert), 6ş7, 7f , 73ş75; and
management in, 220ş22, 224ş26, 225t,
livestock in Ethiopia, 151
235ş40, 236tş239t, 250ş52, 390ş91; land
Aluminum toxicity, in Uganda, 10
reform (redistribution) in, 220ş22, 251ş52;
Amhara Credit and Savings Institution (ACSI),
land use in, 226; literacy/education in,
162
151ş64, 396; livestock in, 142ş64, 310;
Amhara region of Ethiopia: administrative
livestock in, trends since 1991, 144ş48;
zones of, 227; agricultural potential in, 8f
location of, 144; manure use in, 225, 225t,
(color insert), 144ş48, 145tş147t, 151ş64,
235ş40, 237t, 239t; market access in, 8f
222, 228, 236tş239t, 242tş247t; animal
(color insert), 150ş64, 222; peasant asso-
health services in, 142, 147ş48, 147t, 150,
ciations of, 143ş44; plot acquisition in,
158ş61, 159t; classifications of highlands in,
223ş24; plot-level factors in, 228, 231t;
8f (color insert); contour plowing in, 225,
plot size in, 235; policies and programs in,
225t, 235ş40, 236t, 238t; credit use in, 148,
217ş56; population of, 8f (color insert),
150ş64; crop residues in, 225, 225t, 235,
144, 222, 227ş28; private pastures in,
237t, 239t; crop rotation in, 225, 225t,
146ş47, 146t, 155ş56, 156t, 161; pro-
235, 236t, 238t; draft power in, 226, 227t,
ductivity in, 220ş22, 226ş27, 241ş52,
240ş41, 242tş244t, 250; econometric
245tş247t; rainfall and drought in, 144ş48,
analysis of, 217ş54; econometric analysis
145tş147t, 228; reduced or zero tillage in,
of, approach in, 228ş29, 230tş233t; econo-
225, 225t, 235ş40, 236t, 238t, 312, 391;
metric analysis of, conceptual framework
seed usage in, 226, 227t, 240ş41, 242tş
and hypotheses for, 218ş22; econometric
244t, 250; sociocultural environment of,
analysis of, endogenous variables in, 228,
226ş27; tenure rights in, 220ş26, 224tş
230t; econometric analysis of, estimation
225t, 227t, 235, 240ş41, 247ş48, 251ş52,
procedure for, 229ş34; econometric analysis
397; tree growing in, 349, 406; village/
of, exogenous variables in, 228, 231tş233t;
district-level factors in, 228ş29, 232tş233t;
econometric analysis of, implications of,
village-stratified analysis of, 222ş23. See also
250ş52; econometric analysis of, results of,
Andit Tid, Ethiopia
234ş50, 236tş239t, 242tş247t; econo-
Amin, Idi, 279, 357, 400
metric analysis of, study area and data for,
Andit Tid, Ethiopia: agricultural potential of,
8f (color insert), 222ş27; education in, 396;
335; bioeconomic model of, 335ş56, 338f;
extension services in, 148, 150ş52, 249ş50,
credit in, 336ş37, 339ş43, 340fş341f;
393ş94; farm size in, 235, 248; feed
description of, 335ş37; development trend
resources for livestock in, 142ş43, 146ş47,
in, 336ş37; food-for-work programs in,
146t, 149ş50, 155ş56, 156t, 161ş62, 311;
343ş48, 344fş347f, 353fş354f, 355; grow-
female-headed households in, 240ş41; fertil-
ing seasons of (meher and belg), 335; live-
izer use in, 225ş26, 225t, 235ş40, 237t,
stock in, 335ş36, 339, 341f; location of,
INDEX
461
335; main crops of, 335; off-farm income in,
Busia District of Kenya, 321
336, 339ş43, 340fş341f, 342t, 354ş55;
Busia District of Uganda, 321
policies for poverty reduction, sustainable
land management, and food security in,
Cabbage, Kenyan production of, 196, 196t
338ş56; population density of, 335; rainfall
Canavalia, 324ş25, 325t
in, 335; stimulation of tree growing in,
Capital intensity, population pressure and, 45
348ş52, 353fş354f, 355; tenure rights
Carbon credits, 318
in, 336
Carrots, Kenyan production of, 24ş25
Animal health services, in Ethiopia, 142,
Cash crops: of Ethiopia, 25, 94; of Kenya,
147ş48, 147t, 150, 158ş61, 159t
2f (color insert), 25, 65, 69t, 70ş79, 72t,
Area enclosures, in Ethiopia, 315ş16
196ş97, 196t; of Uganda, 25, 172ş75
Artificial insemination, of livestock, 147, 147t,
Cassava: Kenyan production of, 24, 196,
150, 161
196t; mosaic virus-resistant, in Iganga
Artificial neural network (ANN), 364
District of Uganda, 361ş62; Ugandan
Avocado: Kenyan production of, 26, 197ş98;
price for, 361t; Ugandan production of,
Ugandan production of, 26
172, 361
Cattle: and community resource management,
Bananas: Kenyan production of, 24, 196ş97,
264ş65, 271ş72; in East African highlands,
196t; Ugandan price for, 361t; Ugandan
25ş26; in Ethiopian highlands, 310; in
production of, 25, 172, 361
Ethiopian highlands of Amhara, 145t, 149;
Barley, Ethiopian production of, 25, 94ş96,
in Ethiopian highlands of Tigray, 96, 97t;
95t, 335
in Kenyan highlands, 25, 65, 69t, 70ş75,
Beans: Ethiopian production of, 94, 95t, 335;
72t, 197ş98, 198t, 202ş3, 203t, 310; in
Kenyan production of, 24ş25, 196ş97,
Uganda, 172. See also Dairy production;
196t, 201, 201t, 209, 210t; Ugandan price
Livestock
for, 361t; Ugandan production of, 25, 361
CBOs. See Community-based organizations
Biocarbon Fund, 318
Cell phone use, 17
Bioeconomic model(s): integrated approach to,
Central highlands of Kenya, 7f (color insert),
360ş64; of less-favored area of Ethiopian
25, 65, 192ş93; agricultural investment in,
highlands, 333ş56, 338f; modeling
199ş214; agricultural potential of, 378; crop
approach for, 364; need for, 415; of technol-
diversification in, 200ş202, 201t; cropping
ogy adoption in eastern Uganda, 358ş75
seasons in, 192; household factors in,
Biomass cycling, through animals, 328ş29
207ş10; income strategies in, 388; labor in,
Biomass transfer, 326ş27, 331, 391ş92
205, 206t; livestock in, 202ş3, 203t; major
Blue Nile, siltation of, 12ş13
crops of, 197; market access in, 192ş93,
Borrowing. See Credit
379ş86; nutrient investments in, 204, 204t;
Boserup, Esther, 46, 66, 119, 131, 387, 412
population density of, 192, 195; rainfall in,
Boserupian effects, 81ş82, 126, 131, 185ş86,
192; versus western, comparative analysis of,
387, 412
205ş14, 212t
Bugiri District of Uganda, 321
Cereal production: in Kenyan highlands,
Bulls, in Ethiopia, 145t
econometric model of, 61ş63; in Uganda,
Bureau of Agriculture (Ethiopia), 88ş89, 96,
172. See also specific cereal crops
100t, 148, 162, 394
Chat, Ethiopian production of, 25
Burning to prepare fields: in Ethiopian high-
Check dams, in Ethiopian highlands of
lands of Tigray, 116, 117t, 119t, 121t, 123,
Amhara, 224, 224t
131, 132t, 135, 391; in Uganda, 175
Chick peas, Ethiopian production of, 94, 95t
462
INDEX
Churches, in Uganda, 279
tics on, 274; violations of restrictions on,
Clean Development Mechanism, 318
261, 270t
Climate: as critical variable, 27; of East African
Community property resources: definition of,
highlands, 1, 8, 27, 59; of Ethiopian high-
274n1; dependence on, 265ş66
lands, 8, 27, 81, 85; of Kenyan highlands, 8,
Community resource management, 406; bene-
27, 73ş75; topography and, 6ş7
fits received from, 262ş63, 272; collective
Coffee: certified organic, 403; Ethiopian pro-
action in, 257ş75; econometric analysis of,
duction of, 25, 403ş4; Kenyan policies on,
259ş75; econometric analysis of, data for,
22, 201, 206; Kenyan production of, 25, 70,
259ş63; econometric analysis of, empirical
192, 197, 201, 209, 210t, 403ş4; market
approach in, 263ş72; in Ethiopian high-
improvements for, 403ş4; specialty, 403ş4;
lands of Tigray, 257ş75, 406; first-come,
Ugandan price for, 361t; Ugandan produc-
first-served basis of, 257; and land degrada-
tion of, 25, 172, 361, 403ş4
tion, 257ş58, 273; market access and,
Coffee Marketing Board (Uganda), 23
264ş65, 268, 271ş73; penalty system in,
Coffee-Tea Zone, of central Kenyan highlands,
263ş64, 269ş71, 270t; population density
192
and, 258, 264, 268, 271ş72, 387; privatiza-
Collective action: in community resource man-
tion in, 257ş58; program participation and,
agement, 257ş75; definition of, 274n2; in
264ş65, 273, 396; use rules in, 257ş58
grazing land management, 269ş72; indica-
Community service programs, in Uganda, 284,
tors of, 263ş64; individual incentives for,
285tş287t, 288, 289t
263; livestock issues and, 264ş65, 271ş72;
Community woodlots, 406; allowable uses on,
market access and, 264ş65, 271; penalty
261; benefits received from, 262ş63; char-
system in, 263ş64, 269ş71, 270t; popula-
acteristics of, 260, 260t; in Ethiopian high-
tion density and, 264, 271, 387; program
lands of Tigray, 258ş69, 272ş75; guards for,
participation and, 264ş65, 271; in woodlot
261, 267t, 268ş69; labor input for, 266ş68,
management, 266ş69
267t; number of trees planted per hectare,
Combating nutrient depletion, 311ş12
267t; results of econometric analysis of,
Community-based organizations (CBOs): defi-
266ş69, 267t; summary of statistics on,
nition of, 281; devolution of government
273; survival rate of, 266, 267t, 268; village-
services to, 278; in Uganda, history of, 280;
versus tabia-managed, 258ş61, 260t,
in Uganda, household involvement in, 283,
264ş65, 269, 272; violation of restrictions
292t, 293; in Uganda, importance of, 303;
on, 261, 267t, 268ş69
in Uganda, main focuses of, 284ş91,
Comparative advantages, 38ş39, 57n2, 84,
285tş287t, 289t; in Uganda, number
399ş407; versus absolute, 38; agricultural
and presence of, 281ş84, 282t
potential and, 38ş41, 48, 84; of areas of
Community Carbon Fund, 318
high agricultural potential and favorable
Community grazing land: allowable uses on,
market access, 400ş401; in Ethiopian high-
261, 261t; area of, per household, 269, 270t;
lands of Tigray, 136; favored areas versus
benefits received from, 262ş63; characteris-
less-favored areas, 334; irrigation and, 44;
tics of, 260, 261t; in Ethiopian highlands
market access and, 41ş44, 84; population
of Tigray, 258ş75; guards for, 261, 269ş71,
pressure and, 44ş46, 84
270t; heterogeneity in ox ownership and,
Conceptual framework, 32ş38
264ş65, 271ş73; household contribution
Conditioning factors, 6; in econometric model,
for, average value of, 270t; penalty system
62; in Kenyan highlands, 63ş64
for, 269ş71, 270t; results of econometric
Contour plowing: in Ethiopian highlands of
analysis of, 269ş72, 270t; summary of statis-
Amhara, 225, 225t, 235ş40, 236t, 238t; in
INDEX
463
Ethiopian highlands of Tigray, 116, 117t,
highlands of Amhara, 225, 225t, 235, 237t,
119t, 121t, 131, 132t
239t; as feed resource, in Ethiopian high-
Contract farming, 17
lands, 146ş47, 146t, 155, 156t; in Uganda,
Cooperatives, 17, 22ş23, 395; effects of, 381t;
determinants of use, 300, 301tş302t, 303;
in Ethiopian highlands of Tigray, 114, 115t,
in Uganda, program participation and,
127, 129, 130t; in Uganda, 278ş79
289ş91, 290t, 300
Cooperative Societies Act of 1963 (Uganda),
Crop rotation: in Ethiopian highlands of
279
Amhara, 225, 225t, 235, 236t, 238t; in
Cotton: fertilizer recommendations for, 323;
Uganda, 175
Kenyan production of, 70; Ugandan pro-
Crops, cash: of Ethiopia, 25, 94; of Kenya,
duction of, 175, 361
2f (color insert), 25, 65, 69t, 70ş79, 72t,
Cows: in Ethiopia, 145t, 152ş54, 153t,
196ş97, 196t; of Uganda, 25, 172ş75
310ş11. See also Dairy production; Livestock
Crops, major, 24ş25; of Ethiopia, 25; of
Credit, 50ş51, 395; availability, in East African
Kenya, 24ş25, 196ş97, 196t; of Uganda,
highlands, 17; education and access to, 51;
25, 172ş75
in Ethiopia, 17, 23ş24, 395; in Ethiopia,
Crotalaria, 324
and livestock, 148, 150ş64; in Ethiopian
Cultural influences, 36ş37
highlands, in less-favored area, 336ş37,
Currency exchange rates, 20
339ş43, 340fş341f; in Ethiopian highlands
Customary land, in Uganda, 168ş70
of Amhara, 148, 150ş64; in Ethiopian
highlands of Tigray, 88ş89, 99, 100t, 101,
Dairy Goat Association of Kenya, 198
103ş4, 108ş10, 114, 115t, 122, 126,
Dairy production: in Ethiopia, 310ş11; in
129ş31, 130t, 132t, 133ş34, 395; house-
Kenya, 23, 25ş26, 65, 69t, 70ş79, 192,
hold endowments and, 53; and income, per
197ş98, 198t, 202ş3, 206ş7, 310, 313,
capita, 129ş31, 130t, 382t; and income
388; market access and, 42; in Uganda, 26
strategies, 50ş51, 56t, 382t; and input use,
Decentralization of governance, 20, 303
132t, 133ş34; in Kenya, 23, 195ş96, 395;
Decentralization of Public Service Reform Plan
and labor intensity, 56t, 382t; and land
(Uganda), 278
degradation, 51, 56t, 382t; and land man-
Development domains, 1f (color insert),
agement, 50ş51, 56t, 122, 132t, 134, 299,
46ş49; and adopted technologies, 83; agri-
382t, 395; and productivity, 56t, 108ş10,
cultural potential and, 46ş49, 47t, 66ş68,
126, 129ş31, 130t, 132t, 133ş34, 334,
81ş82, 86; comparative advantages in,
382t, 395; tenure rights and access to, 52;
38ş39, 84; dimensions of, 66ş68, 81ş82;
in Uganda, 23, 395; in Uganda, eastern,
dimensions of, independence tests of,
369ş72, 371f; in Uganda, programs address-
89ş90, 102; diversity and complexity of,
ing, 284, 285tş287t, 288, 289t, 304
399ş400; endogenous and exogenous vari-
Crop choices: in Ethiopian highlands of Tigray,
ables in, 94; high agricultural potential and
94ş96, 95t, 103; in Kenyan highlands,
favorable market access, 400ş401; identifi-
70ş79
cation and quantification of, 82, 87ş91; in
Crop-livestock system: in Ethiopia, intensifica-
Kenyan highlands, delineation of, 3f (color
tion of, 309ş18; soil fertility maintenance
insert), 65ş68, 67t; market access and,
in, 327ş29
46ş49, 47t, 66ş68, 81ş82, 86; population
Crop productivity. See Productivity
density and, 46ş49, 66ş68, 81ş82, 86; and
Crop residues: cycling through animals, for soil
resource management practices, 83; strate-
replenishment, 328ş29; in Ethiopian high-
gies for varying, 399ş407; in Uganda, 5f
lands, less-favored area of, 336; in Ethiopian
(color insert), 167ş68, 176, 180, 281, 360;
464
INDEX
Development domains (continued )
size in, 15; soils in, 10; telecommunications
village-level, in Ethiopian highlands of
growth in, 17; temperatures in, 8; tenure
Tigray, 81ş106, 93t; village-level, methods
rights in, 15, 21ş22, 28; trees and other
and data for, 86ş87; welfare implications of,
agricultural products in, 26. See also specific
99, 101t
countries and regions
Development pathway(s): definition of, 29n1;
Eastern Uganda, 167ş68, 281, 321; bio-
in Kenya, 59ş79
economic model of, 358ş75; bioeconomic
Doliches, Ethiopian production of, 95t, 96
model of, integrated approach to, 360ş64;
Donkeys, in Ethiopian highlands, 144, 145t,
bioeconomic model of, modeling approach
153t, 154
for, 364; bioeconomic model of, policy sce-
Donor funding: for Ethiopia, 19; for Kenya,
narios and results of, 364ş72; bioeconomic
2, 19, 24; for Uganda, 18ş19, 24
model of, sampling procedure for, 360ş62;
Downward spiral, 33ş34; in Kenyan highlands,
biomass transfer in, 326ş27; combined
60
effects scenarios for, 369ş72, 371f; commer-
Draft power, in Amhara region of Ethiopia,
cial farms in, 362; credit introduction in,
226, 227t, 240ş41, 242tş244t, 250
369ş72, 371f, 373; crop (output) prices in,
Drainage ditches, in Ethiopian highlands of
360ş61, 361t; crop (output) prices in, effects
Amhara, 224, 224t
of increasing, 368ş69, 369f; description of,
Driving forces, 6, 31, 62; in econometric
321; fertilizer price in, 359, 361t; fertilizer
model, 62; in Kenyan highlands, 65
price in, effects of decreasing, 366ş68, 367t;
Drought, and livestock in Ethiopia, 144ş48,
fertilizer recommendations for, 323ş24; food
145tş147t
shortages and famine in, 321; household
groups in, characteristics of, 363tş364t;
East African highlands: agricultural sector poli-
input prices in, 361, 361t; labor exchange
cies in, 22ş24, 28; altitude and topography
in, promotion of, 369ş72, 371f; land man-
of, 6ş7, 7f; climate of, 1, 8, 27, 59; credit
agement in, 319ş31, 357ş75; legume cover
availability in, 17; critical variables in,
crops in, 324ş26; location of, 360; market
27ş28; decentralization of governance in,
access in, 360; marketing chain in, 359ş60;
20; description of, 6ş28; economic growth
mosaic virus-resistant cassava in, 361ş62;
rates in, 2ş3; fertilizer use in, 12, 17; geogra-
new technology adoption in, 357ş75; nutri-
phy of, 6ş13; growing period length in, vari-
ent balance in, nonnegative, feasibility of,
ations in, 8, 9f; international relations and
364ş66, 373; price relations (output-input)
macro policies in, 18ş20; land degradation
in, improvement of, 369ş72, 371f, 373;
in, 11ş13, 319ş20; land use in, 8ş10; live-
private goals versus social goals in, 364ş66,
lihoods and agricultural systems in, 24ş26;
365t; problem setting in, 359ş60; produc-
livestock in, 25ş26; low productivity in, 1;
tivity of, 321; programs and services in,
major crops of, 24ş25; market(s) in, 15ş18,
361; promoted technologies in, effects of,
27ş28; market access in, 15ş18, 16f,
366ş72; semisubsistence farms in, 362; soil
379ş86; markets for input, 17ş18; markets
fertility status in, 322ş23; subsistence farms
for output, 18; natural resource policy in,
in, 362; traditional food crops of, 361
21ş22; political structure and policies in,
Ecologically sustainable agriculture, definition
18ş24; population density of, 1, 3, 13ş15,
of, 374ş75n1
14f, 27; poverty in, 1ş3; productivity and
Econometric analysis: of Ethiopian highlands,
growth in, 26, 27t; rainfall totals and aver-
livestock in, 148ş49; of Ethiopian high-
ages in, 8; reasons for focusing on, 1; road
lands of Amhara, 217ş54; of Ethiopian
densities and quality in, 15; settlements/farm
highlands of Tigray, 107ş39; of Ethiopian
INDEX
465
highlands of Tigray, community resource
151, 162ş63, 220ş24, 251ş52, 336; live-
management in, 259ş75; of Kenyan high-
stock in, 25, 141ş64, 405ş6 (see also Live-
lands, 61ş63; of Uganda, 165ş89; of
stock, in Ethiopia); livestock in, as percent
Ugandan program participation, 291ş305
of farm cash income in, 141; livestock in, as
Econometric models, development of, 61ş63
percent of gross domestic product in, 141;
Economic growth rates: in Ethiopia, 2ş3; in
nationalization of land in, 22, 28ş29,
Kenya, 2ş3, 320; in Uganda, 2ş3, 320, 357
223ş24; natural resource policy in, 22; per
Education, 51, 396, 410ş11; and access to
capita national income in, 2; percent of pop-
credit, 51; in Ethiopian highlands of
ulation undernourished in, 2; population
Amhara, 396; in Ethiopian highlands of
density of, 13ş15, 14f, 27, 387; poverty in,
Tigray, 99, 101t, 114, 115t, 127ş31, 130t,
2ş3, 142ş43, 333; poverty in, policies for
132t, 135, 396; and income, 127ş31, 130t,
reducing in less-favored area, 333ş56; pro-
135, 396, 410; and income strategies, 37,
ductivity and growth in, 26, 27t, 142ş43,
51, 56t; in Kenyan highlands, 208ş9, 396;
217; Sustainable Agriculture and Environ-
and labor intensity, 51, 56t, 135; and land
mental Rehabilitation Program, 161ş62;
degradation, 51, 56t, 182, 183tş184t,
telecommunications in, 17; tenure rights in,
186ş87; and land management, 37, 51,
15, 22, 28, 36, 220ş22, 397, 411ş12 (see
56t, 135, 240, 298, 410ş11; and livestock,
also Tenure rights, in Ethiopia); work force
in Ethiopia, 151ş64; and productivity,
engaged in agriculture in, 2
56t, 127ş31, 130t, 135, 182, 183tş184t,
Ethiopia-Eritrean war, 2, 13, 19
186ş87, 396; and program participation,
Ethiopian highlands: agricultural potential in,
295, 296t; in Uganda, 182, 183tş184t,
378, 400ş407; altitude and topography of,
186ş87, 396
6ş7, 7f; of Amhara (see Amhara region of
Embu District of Kenya, livestock in, 203t
Ethiopia); animal health services in, 142,
Enset, Ethiopian production of, 25
147ş48, 147t, 150, 158ş61, 159t; area
Entandikwa (Uganda), 373
enclosures in, 315ş16; cash crops of, 25,
Ethiopia: Agricultural Development Led Indus-
94; climate of, 8, 27, 81, 85; community
trialization, 142, 217; agricultural research
resource management in, 257ş75; critical
in, 24, 317; agricultural sector policies of,
variables in, 27ş28; crop-livestock system
23ş24, 142ş43; Bureau of Agriculture,
in, intensification of, 309ş18; description
88ş89, 96, 100t, 148, 162, 394; construc-
of, 6ş28; feed resources for livestock in,
tion material shortage in, 258; credit avail-
142ş43, 146ş47, 146t, 149ş50, 155ş56,
ability in, 17, 23ş24, 88ş89, 99, 100t,
156t, 161ş62, 313, 336; female-headed
101, 103ş4, 108ş10, 114, 115t, 122, 126,
households in, 115t, 127, 135ş36,
129ş31, 130t, 132t, 133ş34, 395; cultural
138ş39n26, 240ş41, 396; fertilizer use in,
and religious influences in, 36ş37; decentral-
17, 23ş24, 309ş10; geography of, 6ş13;
ization of governance in, 20, 38, 258ş59;
gots (villages) in, 222; grazing land in, 142,
donor funding for, 19; economic growth
146ş47, 146t, 149, 155ş58, 156t, 161ş62,
in, 2ş3; exchange rates and capital flow in,
315ş16; grazing land in, community man-
20; extension system in, 24, 114, 115t,
agement of, 258ş75; growing period length
132t, 134ş35, 148, 150ş52, 249ş50, 317,
in, 8, 9f; income strategies in, 388ş89; irri-
393ş94; fuelwood shortage in, 258; govern-
gation program in, 161ş62, 392ş93, 407;
ment support program in, 17; highlands of
kushets in, 83, 105n2; land degradation in,
(see Ethiopian highlands); HIV/AIDS inci-
debate over, 11ş13; land use in, 8ş10; less-
dence and death rates in, 13; inflation in, 20;
favored area of, 333ş56 (see also Less-favored
land reform (redistribution) in, 22, 142ş43,
area, of Ethiopian highlands); livelihoods
466
INDEX
Ethiopian highlands (continued )
cover crops for, 324ş26; population pressure
and agricultural systems in, 24ş26; livestock
and, 387; soil nutrients restored in, 322ş23;
in, 25, 141ş64 (see also Livestock, in
in Uganda, eastern, 324ş26
Ethiopia); major crops of, 25; market(s) in,
Farm equipment: and income strategies, 56t;
15ş18, 27ş28; market access in, 15, 16f,
and labor intensity, 56t; and land degrada-
400ş404; markets for input, 17ş18; markets
tion, 54, 56t; and land management, 56t;
for output, 18; meat and milk consumption
and productivity, 56t
in, per capita, 310; peasant associations in,
Farming Systems Research (FSR), 105n3
143ş44, 222ş23; population density of,
Farm size: in East African highlands, 15; in
13ş15, 14f, 27, 85; private pastures in,
Ethiopian highlands of Amhara, 235, 248;
146ş47, 146t, 155ş56, 156t, 161; rainfall
in Ethiopian highlands of Tigray, 107, 114,
totals and averages in, 8; rangeland in, 10;
126; in Kenyan highlands, 15, 195, 208ş9;
road densities and quality in, 15; settle-
and land management, 235, 319ş20; and
ments/farm size in, 15, 107; soils in, 10;
productivity, 176ş79, 185, 248, 387; in
straw quality improvement in, 314ş15, 317;
Uganda, 15, 176ş79
tabias in, 105n2, 108, 111; of Tigray (see
Fattening practices, for livestock, in Ethiopian
Tigray region of Ethiopia); tillage practices
highlands, 147, 147t, 150, 161
(zero or reduced) in, 309ş18, 391; tree
Fava beans, Ethiopian production of, 94, 95t
growing in, 26, 258ş69, 272ş75, 316,
Feed resources: for livestock, in Ethiopia,
348ş52, 351fş354f, 355, 389, 404, 406;
142ş43, 146ş47, 146t, 149ş50, 155ş56,
woredas (districts) in, 20, 111, 131, 222
156t, 161ş62, 311, 313ş16, 336; versus soil
Ethiopian Highlands Reclamation Study,
replenishment, 327ş28
136ş37n1
Female-headed households, 396ş97, 411;
Ethiopian Peoples Revolutionary Democratic
agricultural investment by, 208; crop pro-
Front (EPRDF), 114
ductivity in, 127, 249, 396ş97; cultural
Eucalyptus: Ethiopian production of, 26, 262,
taboos affecting, 135, 138ş39n26, 311, 411;
269, 316, 389; Ethiopian production of,
in Ethiopian highlands, 396; in Ethiopian
stimulation in less-favored area, 348ş52,
highlands of Amhara, 240ş41; in Ethiopian
351fş354f; Kenyan production of, 26, 198;
highlands of Tigray, 115t, 127, 135ş36,
Ugandan production of, 26
138ş39n26; input use by, 241; in Kenyan
Exchange rates, 20
highlands, 194ş95, 205, 208, 396; land
Export markets, 18
management practices by, 240ş41, 298, 303,
Extension systems, 24, 393ş95; effects of,
331, 396ş97, 411; program participation by,
381t; in Ethiopia, and livestock, 148,
295, 296t, 304; reduced or zero tillage by,
150ş52; in Ethiopia, and tillage practices,
240ş41, 311; special attention required for,
317; in Ethiopian highlands of Amhara,
136, 411; tenure discrimination against,
148, 150ş52, 249ş50, 393ş94; in Ethiopian
411; in Uganda, 295, 296t, 298, 303ş4
highlands of Tigray, 114, 115t, 132t,
Fences, in Ethiopian highlands of Amhara,
134ş35, 148, 394; in Kenya, 24, 394ş95;
224, 224t
and land degradation, 186, 381t; and land
Fertilizer: agricultural potential and, 41; appli-
management, 381t; and productivity, 180,
cation rates for, 12, 17; economics of,
185ş86, 249ş50; in Uganda, 24, 180,
329ş30; in Ethiopian highlands, 17, 23ş24,
185ş86, 279ş80, 394
309ş10; in Ethiopian highlands, less-favored
area of, 336; in Ethiopian highlands of
Fallow land, 392; economics of, 329ş30; in
Amhara, 225ş26, 225t, 235ş40, 237t, 239t,
Kenyan highlands, 69, 69t, 324ş26; legume
390; in Ethiopian highlands of Tigray,
INDEX
467
96ş98, 98t, 116, 117t, 118ş19, 118t, 120t,
Geography: of East African highlands, 6ş13.
123ş25, 131ş34, 132t; in Kenya, 17, 23,
See also specific features
204ş5, 204t, 323ş24, 326, 390; markets for
Goats: in East African highlands, 25ş26; in
input, 17; and productivity, 123ş25, 390; in
Ethiopian highlands of Amhara, 145t,
Uganda, 17, 323ş24, 390ş91; in Uganda,
152ş54, 153t; in Ethiopian highlands
determinants of use, 301tş302t; in Uganda,
of Tigray, 96, 97t; in Kenyan highlands,
price of, 359, 361t, 366ş68, 367t, 369ş72,
197ş98, 198t, 202ş3, 203t. See also
371f; in Uganda, program participation and,
Livestock
289ş91, 290t, 303
Gots, in Ethiopia, 222
Fertilizer Use Recommendation Project (FURP,
Government: decentralization of, 20, 277ş78,
Kenya), 324
280, 303; devolution of service and infra-
FFW. See Food-for-work programs
structure, 277ş78, 303; and income strate-
Field peas, Ethiopian production of, 94, 95t,
gies, 37ş38; and land management, 37ş38.
335
See also specific agencies, policies, and programs
Financial capital, 37; in Uganda, 168
Grazing land: in Ethiopian highlands, 142,
Five Is (innovations, infrastructure, inputs,
146ş47, 146t, 149, 155ş58, 156t, 161ş62,
institutions, and incentives), 318
315ş16; in Ethiopian highlands, community
Flax, Ethiopian production of, 94, 95t
management of, 258ş75; in Kenyan high-
Focal Area approach (Kenya), 24
lands, 65, 69, 69t
Fodder resources: in Ethiopia, 142, 146ş47,
Grazing land, community: allowable uses on,
146t, 149, 155ş58, 156t, 161ş62, 311,
261, 261t; area of, per household, 269, 270t;
313ş16, 336; versus soil replenishment,
benefits received from, 262ş63; characteris-
327ş29
tics of, 260, 261t; in Ethiopian highlands of
Food-for-work (FFW) programs, 382t, 407ş8;
Tigray, 258ş75; guards for, 261, 269ş71,
combined effect with tree growing, 350ş52,
270t; heterogeneity in ox ownership and,
353fş354f, 355; criticisms of, 343; and
264ş65, 271ş73; household contribution
income, 344f, 345, 346f, 347; for land con-
for, average value of, 270t; penalty system
servation, 346fş347f, 347; for land conser-
for, 269ş71, 270t; results of econometric
vation, with unconstrained off-farm oppor-
analysis of, 269ş72, 270t; summary of statis-
tunities, 347ş48, 353fş354f; and land
tics on, 274; violations of restrictions on,
management, 343ş48, 344fş347f, 354fş
261, 270t
355f; and leisure time, 345; in less-favored
Green manure (legume cover crop), 324ş26,
area of Ethiopian highlands, 343ş48,
325t
350ş52, 355; outside agriculture, 343ş45,
Grevillea robusta, Kenyan production of, 26,
344fş345f; and productivity, 345, 347ş48
198ş99
Food security, in less-favored area of Ethiopian
Groundnuts: fertilizer recommendations for,
highlands, 333ş56
322; Kenyan production of, 196, 196t
Forests, 8ş10
Ground survey methods, for land degradation
Freehold system, 52; in Kenya, 21, 28; in
studies, 12
Uganda, 168ş70, 181, 398, 412
Growing period length: in East African high-
Fruit trees, 26; in Kenyan highlands, 26,
lands, variations in, 8, 9f; in Kenyan
198ş99
highlands, 8, 9f, 73
Guards, for community resources, 261, 267t,
Gender, 396ş97. See also Female-headed
268ş71, 270t
households
Gully stabilization, in Ethiopian region of
Geographic targeting, 82ş83, 103ş4
Tigray, 103
468
INDEX
Haricot beans, Ethiopian production of, 94,
Household income, as outcome of interest,
95t
32ş33
Heifers, in Ethiopia, 145t
Household involvement, in Uganda programs,
Herbicide, with zero tillage, 311ş12
281, 282t, 283, 292, 295, 296tş297t, 304
Highlands, East African: agricultural sector
Household-level factors, 37
policies in, 22ş24, 28; altitude and topogra-
Household refuse, in Ethiopian highlands of
phy of, 6ş7, 7f; climate of, 1, 8, 27, 59;
Amhara, 225, 225t, 235ş40, 237t, 239t
credit availability in, 17; critical variables in,
Household welfare indicators, as outcome of
27ş28; decentralization of governance in,
interest, 32ş33
20; description of, 6ş28; economic growth
Human capital, 37; in Ethiopian highlands of
rates in, 2ş3; fertilizer use in, 12, 17; geogra-
Tigray, 108ş10, 123; and land management,
phy of, 6ş13; growing period length in, vari-
123; and productivity, 108ş10; in Uganda,
ations in, 8, 9f; international relations and
168. See also Labor intensity
macro policies in, 18ş20; land degradation
Human immunodeficiency virus (HIV), 13,
in, debate over, 11ş13; land use in, 8ş10;
194, 320, 411
livelihoods and agricultural systems in,
Hypotheses, 38ş56, 55tş56t
24ş26; livestock in, 25ş26; low productivity
in, 1; major crops of, 24ş25; market(s) in,
Iganga District of Uganda: bioeconomic model
15ş18, 27ş28; market access in, 15ş18, 16f,
of, 358ş75; bioeconomic model of, inte-
379ş86; markets for input, 17ş18; markets
grated approach to, 360ş64; bioeconomic
for output, 18; natural resource policy in,
model of, modeling approach for, 364; bio-
21ş22; political structure and policies in,
economic model of, policy scenarios and
18ş24; population density of, 1, 3, 13ş15,
results of, 364ş72; bioeconomic model of,
14f, 27; poverty in, 1ş3; productivity and
sampling procedure for, 360ş62; combined
growth in, 26, 27t; rainfall totals and aver-
effects scenarios for, 369ş72, 371f; commer-
ages in, 8; reasons for focusing on, 1; road
cial farms in, 362; credit introduction in,
densities and quality in, 15; settlements/farm
369ş72, 371f, 373; crop (output) prices in,
size in, 15; soils in, 10; telecommunications
360ş61, 361t; crop (output) prices in, effects
growth in, 17; temperatures in, 8; tenure
of increasing, 368ş69, 369f; fertilizer price
rights in, 15, 21ş22, 28; trees and other
in, 359, 361t; fertilizer price in, effects of
agricultural products in, 26. See also specific
decreasing, 366ş68, 367t; household groups
countries and regions
in, characteristics of, 363tş364t; input prices
HIV infection, 13, 194, 320, 411
in, 361, 361t; labor exchange in, promotion
Homestead sources of feed, in Ethiopia, 156t,
of, 369ş72, 371f; location of, 360; market
157
access in, 360; marketing chain in, 359ş60;
Horses, in Ethiopian highlands, 145t
mosaic virus-resistant cassava in, 361ş62;
Household endowments, 53ş54, 56t; in
new technology adoption in, 359ş75; nutri-
Ethiopian highlands of Tigray, 108ş10,
ent balance in, nonnegative, feasibility of,
132t, 134ş35; and income, 132t, 134ş35,
364ş66, 373; price relations (output-input)
383t; and income strategies, 53ş54, 56t,
in, improvement of, 369ş72, 371f, 373;
383t; in Kenyan highlands, 194ş96; and
private goals versus social goals in, 364ş66,
labor intensity, 53ş54, 56t, 383t; and land
365t; problem setting in, 359ş60; programs
degradation, 56t, 383t; and land manage-
and services in, 361; promoted technologies
ment, 53ş54, 56t, 132t, 134ş35, 298ş99,
in, effects of, 366ş72; semisubsistence farms
303, 383t; and productivity, 56t, 108ş10,
in, 362; subsistence farms in, 362; tradi-
132t, 134ş35, 383t; in Uganda, 168
tional food crops of, 361
INDEX
469
Import markets, 17ş18
126, 131ş33, 132t, 165ş66, 176, 179ş80,
Income: agricultural potential and, 379, 380t;
185, 187, 382t; profitable, promotion of,
credit and, 129ş31, 130t, 382t; direct and
408ş12; program participation and, 56t,
indirect effects on, 127ş30, 131t; education
381tş382t; research directions/implications
and, 127ş30, 130t, 135, 396, 410; in
for, 412ş15; tenure rights and, 35ş36,
Ethiopia, 2; in Ethiopian highlands of
51ş53, 56t, 383t; in Uganda, 165ş66, 168,
Tigray, per capita, 110ş11, 115t, 127ş31,
172ş76, 179ş80, 185, 187, 388ş89; vari-
128t, 130t; in Ethiopian highlands of Tigray,
ance across development domains, 47ş49,
per day, 107; in Ethiopian highlands of
47t
Tigray, per household, 115t; household, as
Inflation, 20
outcome of interest, 32ş33; household
Infrastructure: as comparative advantage,
endowments and, 132t, 134ş35, 383t;
42ş43; density and quality, in East African
income strategies and, 127, 132t, 133, 382t;
highlands, 15; and income strategies, 55t;
irrigation and, 132t, 133, 381t; in Kenya, 2,
and labor intensity, 43, 55t; and land degra-
320ş21; land management and, 385t; mar-
dation, 43ş44, 55t; and land management,
ket access and, 127ş29, 130t, 131, 132t,
43, 55t; and productivity, 55t
380t; population density and, 127ş29, 130t,
Intensification of agriculture, 3; in Ethiopian
131, 132t; program participation and, 56t,
crop-livestock system, 309ş18; geographic
129, 130t, 381tş382t; in Uganda, 2,
targeting and, 82ş83; in Kenyan high-
320ş21
lands, 59ş60. See also specific policies and
Income strategies, 34, 49ş50, 388ş89; access
strategies
to programs and services and, 35, 50ş51;
Intercropping: in Ethiopian highlands of
agricultural potential and, 39ş40, 48ş49,
Tigray, 118, 119t, 121t, 131, 132t; in
55t, 378, 380t; biophysical factors and, 35;
Kenyan highlands, 69ş74, 69t, 196ş97
credit and, 50ş51, 56t, 382t; cultural influ-
International Agricultural Research Centers
ences on, 36ş37; definition of, 29ş30n1,
(IARC), 361
34, 57n1; education and, 37, 51, 56t; in
International Center for Tropical Agriculture
Ethiopian highlands of Amhara, 142, 389;
(CIAT), 171, 361ş62, 374
in Ethiopian highlands of Tigray, 108ş10,
International Fertilizer Development Center
116, 119ş22, 126ş27, 131ş33, 132t, 142;
(IFDC), 359
factors affecting, 32f, 35ş38, 55tş56t; gov-
International Food Policy Research Institute
ernment policies, programs, and institutions
(IFPRI), 334, 360. See also specific programs
and, 37ş38; household endowments and,
and analyses
53ş54, 56t, 383t; household-level factors
International Livestock Research Institute
and, 37; and income per capita, 127, 132t,
(ILRI), 65, 141
133, 382t; irrigation and, 44, 55t, 381t; and
International Monetary Fund (IMF): support
labor intensity, 49, 55t, 131ş33, 132t, 382t;
for Ethiopia, 19; support for Uganda,
and land degradation, 50, 55t, 165ş66,
18ş19; withdrawal of support for Kenya,
187, 382t; and land management, 49, 55t,
2, 19
119ş22, 131ş33, 132t, 382t; livestock
Investment, agricultural: driving factors under-
ownership and, 54, 56t; local institutions
pinning, 205ş11; effects on income and
and, 35ş36; market access and, 42ş44, 55t,
poverty, 209ş11; in Ethiopia, tenure rights
379ş86, 380t; and outcomes of interest, 34;
and, 224ş25, 224t; in Kenyan highlands,
and per capita income, 127; population pres-
199ş214; macro and meso factors in, 205ş6;
sure and, 45, 55t, 380tş381t; and poverty,
market access and, 199ş200; population
50; and productivity, 49ş50, 55t, 108ş10,
pressure and, 199
470
INDEX
Irrigation, 44, 392ş93, 410; and agricultural
rights in, 15, 21, 28, 195; trees and other
potential, 44, 48, 55t; case-by-case consider-
agricultural products in, 26; withdrawal of
ation of, 162; as comparative advantage, 44;
IMF support for, 2, 19; work force engaged
in Ethiopian highlands of Amhara, 151ş64,
in agriculture in, 2
235ş40, 248ş49, 393; in Ethiopian high-
Kenya Agricultural Marketing and Policy
lands of Tigray, 99, 101t, 122, 126, 132t,
Analysis Project (KAMPAP), 191, 215n1
133, 392ş93; and income per capita, 132t,
Kenyan highlands, 2f (color insert); aerial
133, 381t; and income strategies, 44, 55t,
photography of, 63ş65, 69; agricultural
381t; and input use, 132t, 133; and labor
enterprise in, 191ş215; agricultural enter-
intensity, 44, 55t, 381t; and land degrada-
prise in, current, 196ş99, 196t, 198t; agri-
tion, 44, 55t, 381t; and land management,
cultural enterprise in, factors behind choice
44, 55t, 122, 132t, 133, 235ş40, 381t; in
of, 70ş75; agricultural enterprise in, impacts
less-favored areas, 407; and livestock, 393;
of choice of, 75ş77; agricultural intensifica-
and livestock, in Ethiopia, 151ş64; mosqui-
tion in, 59ş60; agricultural investment in,
toes and malaria with, 162; and productivity,
199ş214; agricultural investment in, driving
55t, 126, 132t, 133, 185, 187, 248ş49,
factors underpinning, 205ş11; agricultural
381t, 392
investment in, effects on income and
poverty, 209ş11; agricultural investment in,
Jinja-Mbale Farmlands of Uganda, 321
household factors in, 207ş10; agricultural
investment in, macro and meso factors in,
Kakamega District of Kenya, 321
205ş6; agricultural potential in, 3f (color
Kale, Kenyan production of, 24ş25, 196ş97,
insert), 66ş68, 67t, 378, 400ş407; agricul-
196t
tural successes in, 3, 59ş60; altitude and
Kawacom Organic Coffee Project (Uganda),
topography of, 2f (color insert), 6ş7, 7f,
403
73ş75; bare or bush land in, 69, 69t; bio-
Kenya: agricultural research in, 24, 323; agri-
mass transfer in, 326ş27; cash constraints in,
cultural sector policies of, 22ş23, 28, 206ş7;
195ş96; cash crops of, 2f (color insert), 25,
centralized governance in, 20; credit avail-
65, 69t, 70ş79, 72t, 196ş97, 196t; cattle
ability in, 23, 195ş96, 395; donor funding
and dairy cattle in, 23, 25ş26, 65, 69t,
for, 2, 19, 24; economic growth in, 2ş3,
70ş79, 72t, 192, 197ş98, 198t, 202ş3,
320; exchange rates and capital flow in, 20;
203t, 206ş7, 310, 313, 388; central, 25,
extension system of, 24, 394ş95; Focal Area
65, 192ş93 (see also Central highlands of
approach in, 24; freehold system in, 21, 28;
Kenya); climate of, 8, 27, 73ş75; commer-
highlands of (see Kenyan highlands); HIV/
cialization in, 76, 197, 206ş7; comparative
AIDS incidence and death rates in, 13, 194;
analysis of central and western, 205ş14,
income in, 2, 320ş21; inflation in, 20; inter-
212t; critical variables in, 27ş28; crop diver-
national relations and macro policies of, 2,
sification in, 199ş202, 201t; cultural influ-
18ş20; natural resource policy in, 21; per
ences in, 206; data set for study of, 63ş65;
capita national income in, 2; percent of pop-
description of, 6ş28; development domains
ulation undernourished in, 2; population
in, 3f (color insert), 65ş68, 67t; develop-
density of, 13ş15, 14f, 59ş60, 66ş68,
ment pathways in, 59ş79; districts compris-
386ş87; poverty in, 2ş3, 59ş60, 193,
ing, 59ş60; domain of high agricultural
209ş11, 320ş22; Poverty Reduction and
potential, high market access, and high pop-
Rural Development, 79; privatization pro-
ulation density in, 68; domain of high agri-
gram of, 21; productivity and growth in, 26,
cultural potential, high market access, and
27t, 320; telecommunications in, 17; tenure
low population density in, 68; domain of
INDEX
471
low agricultural potential, high market
rainfall in, 8, 73, 192; revenue generation in,
access, and high population density in, 68;
comparison of crops by, 209ş10, 211t; road
domain of low agricultural potential, high
densities and quality in, 15, 79; roof types
market access, and low population density
in, as indicator of poverty/wealth, 65,
in, 68; downward spiral in, 60; econometric
75ş76, 76t; settlements/farm size in, 15,
models of, development of, 61ş63; educa-
195, 208ş9; soils in, 10; subsistence farming
tion in, 208ş9, 396; fallow land in, 69, 69t,
in, 199, 212, 213t; tree canopy cover in, 4f
324ş26; female-headed households in,
(color insert), 64, 70, 77, 77t; tree growing
194ş95, 205, 208, 396; fertilizer use in, 17,
in, 26, 198ş99, 201, 210ş11, 389; value of
23, 204ş5, 204t, 323ş24, 326, 390; genera-
agriculture output per head, 59; value of
tion of capital in, 213ş14; geography of,
crop per hectare in, 76; western, 65, 193ş94
6ş13; gross margins in, comparison of crops
(see also Western highlands of Kenya); wood-
by, 209, 210t; growing period length in, 8,
lots in, 65, 69ş79, 69t, 73t
9f, 73; higher-value agricultural enterprises
Kenya Tea Development Authority, 22ş23
in, 60ş61; horticultural crops in, 65, 70, 76;
Knowledge intensity, 45
household resources in, 194ş96; income per
Kolla (Ethiopia), 8f (color insert)
hectare in, 60; income strategies in, 388ş89;
Kumi District of Uganda, 321
labor in, allocation by crop, 205, 206t; labor
Kushets (Ethiopia), 83, 105n2
in, availability of, 195, 205; labor in, gender
Kyoto agreement, 318
differences in, 205; land degradation in,
11ş13, 60, 65, 322ş23; land management
Labor exchange, in eastern Uganda, promotion
in, 191ş215, 319ş31, 390; land use in,
of, 369ş72
8ş10, 59ş79; land use in, description of,
Labor intensity: agricultural potential and,
68ş70; land use in, policy implications of,
40ş41, 55t; in community woodlots, in
79; legume cover crops in, 324ş26; liveli-
Ethiopia, 266ş68, 267t; credit and, 56t,
hoods and agricultural systems in, 24ş26;
382t; education and, 51, 56t, 135; in
livestock in, 25, 65, 69t, 70ş79, 72t, 197ş98,
Ethiopian highlands of Amhara, 226, 227t,
198t, 202ş4, 203t, 209ş11, 210t; maize and
240ş41, 242tş244t, 250; in Ethiopian high-
maize intercrops in, 65, 69ş74, 69t, 70, 71t,
lands of Tigray, 118ş19, 118t, 120t, 123;
76, 79, 196ş97, 196t; major crops of, 24ş25,
factors affecting, 55tş56t; household en-
196ş97, 196t; market(s) in, 15ş18, 27ş28;
dowments and, 53ş54, 56t, 383t; income
market access in, 3f (color insert), 15, 16f,
strategies and, 49, 55t, 131ş33, 132t, 382t;
66ş68, 67t, 73ş74, 192ş93, 379ş86,
irrigation and, 44, 55t, 381t; in Kenyan
400ş404; market development in, 60ş61,
highlands, 195, 205; and land degradation,
79; markets for input, 17ş18; markets for
165ş66; and land management, 123,
output, 18, 206ş7; men in households, out-
298ş99, 384tş385t; market access and, 43,
flow of, 194ş95, 321ş22; methodology for
55t, 131, 132t, 380t; population pressure
study of, 61ş65; nonfarm opportunities in,
and, 44ş45, 55t, 66, 84, 118, 131, 132t,
60, 78, 210, 213ş14, 386; nutrient invest-
380tş381t; and productivity, 123, 165ş66,
ments in, 204ş5, 204t; parastatals in, 18,
176; program participation and, 56t,
22, 207; pasture in, 65, 69, 69t; population
381tş382t; tenure rights and, 56t, 384t; in
density of, 3f (color insert), 13ş15, 14f, 27,
Uganda, 165ş66, 176
59ş60, 66ş68, 67t, 73ş74, 192ş93, 195;
Labor market, 18
poverty in, 59ş60, 193, 209ş11, 321ş22;
Lake Kyoga basin of Uganda, 321, 329
precipitation-to-potential evapotranspiration
Lake Victoria crescent, of Uganda, 167ş68,
ratio in, 73; public cooperatives in, 22ş23;
280, 321, 378
472
INDEX
Land Act of 1998 (Uganda), 15, 169ş70
134, 299, 382t, 395; cultural influences on,
Land Boards (Kenya), 21
36ş37; determinants of, 301tş302t; eco-
Land degradation: agricultural potential and,
nomics of, 329ş30; education and, 37, 51,
41, 55t, 380t; causes of, 284, 285t, 358;
56t, 135, 240, 298, 410ş11; in Ethiopian
community resource management and,
highlands, policies for less-favored area,
257ş58, 273; context specificity of, 11, 13;
333ş56; in Ethiopian highlands, tillage prac-
credit and, 51, 56t, 382t; debate over,
tices in, 309ş18; in Ethiopian highlands of
11ş13; in East African highlands, 11ş13,
Amhara, 220ş22, 224ş26, 225t, 235ş40,
319ş20; education and, 51, 56t, 182,
236tş239t, 250ş52, 390ş91; in Ethiopian
183tş184t, 186ş87; in Ethiopian highlands
highlands of Tigray, 107ş39, 118tş121t,
of Tigray, 81, 91ş92, 93f, 107, 136ş37n1,
389ş91; factors affecting, 32f, 35ş38,
258ş59; extent of, 11; factors affecting,
55tş56t; farm size and, 235, 319ş20; by
55tş56t; farm equipment and, 54, 56t;
female-headed households, 240ş41, 298,
household endowments and, 56t, 383t;
303, 331, 396ş97, 411; food-for-work pro-
income strategies and, 50, 55t, 165ş66,
grams and, 343ş48, 344fş347f, 354fş355f;
187, 382t; irrigation and, 44, 55t, 381t; in
government policies, programs, and institu-
Kenyan highlands, 11ş13, 60, 65, 322ş23;
tions and, 37ş38; household endowments
labor intensity and, 165ş66; land manage-
and, 53ş54, 56t, 132t, 134ş35, 298ş99,
ment and, 165ş66, 384tş385t; livestock
303, 383t; household-level factors and, 37;
and, 53ş54, 56t; Malthusian effects on, 11,
and income, 385t; income strategies and, 49,
44ş46, 81, 157, 162, 180ş81, 258; market
55t, 119ş22, 131ş33, 132t, 382t; irrigation
access and, 43ş44, 55t, 182, 183tş184t,
and, 44, 55t, 122, 132t, 133, 235ş40, 381t;
186, 334, 379ş86, 380t; methods for esti-
in Kenyan highlands, 191ş215, 390; in
mating, 11; Millenium Ecosystem Assess-
Kenyan highlands, western, 319ş31; labor
ment on, 12; off-farm income and, 341f,
intensity and, 123, 298ş99, 384tş385t; and
342ş43; as outcome of interest, 32ş33; pop-
land degradation, 165ş66, 384tş385t; live-
ulation density and, 11, 44ş46, 55t, 81ş82,
stock and, 56t, 122ş23, 132t, 134, 240,
85, 180ş82, 183tş184t, 185ş86, 380t,
327ş29; local institutions and, 35ş36; mar-
387ş88, 412; poverty and, 187; program
ket access and, 43, 55t, 119, 131, 132t, 303,
participation and, 56t, 181, 185ş86, 381tş
380t, 386; off-farm income and, 339ş43,
382t; reduced or zero tillage and, 313ş14,
340f; opportunities and constraints for,
317; remote sensing and ground surveys of,
330ş31; population pressure and, 44ş46,
12; research directions/implications for,
55t, 118ş19, 131, 132t, 240, 298,
412ş15; small-scale farmers and, 319ş20; in
380tş381t, 387; and productivity, 108ş10,
Sub-Saharan Africa, 319; tenure rights and,
123ş25, 165ş66, 384tş385t, 390; prof-
56t, 181, 186, 383t; in Uganda, 11ş13,
itable, promotion of, 408ş12; program par-
165ş89, 277ş78, 322ş23, 357ş58; in
ticipation and, 56t, 165ş66, 181, 185ş86,
Uganda, programs focusing on, 284ş91,
277ş78, 281, 289ş93, 290t, 291f, 298ş305,
285tş287t, 289t
381tş382t; research directions/implications
Land management, 34ş35, 389ş92; access to
for, 412ş15; social capital and, 123; tenure
programs and services and, 35, 50ş51; agri-
rights and, 35ş36, 51ş53, 56t, 220ş22,
cultural potential and, 40ş41, 48ş49, 55t,
225ş26, 225t, 235, 247ş48, 299,
298, 378, 380t; better information-better
383tş384t, 397ş98; in Uganda, 165ş66,
choices scenario for, 330; biophysical factors
172ş75, 181, 185ş86, 277ş78, 281,
and, 35; carbon credits as means of financ-
289ş91, 290t, 390ş91; in Uganda, eastern,
ing, 318; credit and, 50ş51, 56t, 122, 132t,
319ş31, 357ş75; variance across develop-
INDEX
473
ment domains, 47ş49, 47t. See also specific
150ş64; nutrient cycle with, 328ş29;
practices
population density and, 150ş64, 387;
Land rights/tenure. See Tenure rights
and productivity, 56t, 109, 123, 126, 185,
Land use: conditioning factors and, 63ş64;
310ş11, 388; tenure rights and, 150ş64,
driving forces and, 64; in East African high-
397
lands, 8ş10; econometric model of, 61ş63;
Livestock, in Ethiopia: adoption of improved
in Ethiopian highlands of Tigray, 81,
breeds, 147ş48, 147t, 150, 159t, 160ş61;
93ş102; in Kenyan highlands, 59ş79; and
in Amhara region, 142ş64, 310; animal
poverty, 63; research directions/implications
health services for, 142, 147ş48, 147t, 150,
for, 412ş15
158ş61, 159t; composition of, 144ş45,
Legume(s): Kenyan production of, 65, 201t;
145t, 149, 152ş54, 153t, 310, 316, 318;
Ugandan production of, 172. See also specific
econometric study of, 148ş49; explanatory
types
variables and hypotheses in study of,
Legume cover crops (LCC), 324ş26, 325t,
150ş52, 152t; feed resources for, 142ş43,
392; economics of, 329; labor requirements
146ş47, 146t, 149ş50, 155ş56, 156t,
for, 331; population pressure and, 387
161ş62, 311, 313ş16, 336; grazing lands
Less-favored area(s): versus favored areas, 334;
for, 142, 146ş47, 146t, 149, 155ş58, 156t,
neglect of, 334; strategies for, 403ş7
161ş62, 315ş16; health problems among,
Less-favored area, of Ethiopian highlands,
147; intensification of, tillage practices (zero
333ş56; bioeconomic model of, 333ş56,
or reduced) and, 309ş18; land reform and,
338f; credit in, 336ş37, 339ş43, 340fş341f;
142ş43, 151, 162ş63; in less-favored area
food-for-work programs in, 343ş48,
of Andit Tid, 335ş37, 339, 341f; modern
344fş347f, 350ş52, 353fş354f, 355; off-
management practices for, 147ş48, 147t,
farm income in, 339ş43, 340fş341f, 342t,
150, 159t, 160ş61; "oxenification" of, 310,
354ş55; policies for poverty reduction, sus-
316, 318; as percent of farm cash income,
tainable land management, and food security
141; as percent of gross domestic product,
in, 333ş56; stimulation of tree growing in,
141; policies for development, 141ş64; pri-
348ş52, 351fş354f, 355
vate pastures for, 146ş47, 146t, 155ş56,
Lexicographic utility concept, 364
156t, 161; productivity effects of, 310ş11;
Lint Marketing Board (Uganda), 23
proportion of households owning, 144,
Literacy: in Ethiopian highlands of Tigray, 99,
145t, 149; rainfall/drought and, 144ş48,
101t, 114, 115t; and livestock, in Ethiopia,
145tş147t; return on investment, 311; stall
151ş64
feeding of, 147ş48, 147t, 150, 159, 159t,
Livelihood strategies. See Income strategies
161; strategies for improvement, 405ş6;
Livestock, 25ş26; agricultural potential and,
straw quality improvement for, 314ş15, 317;
144ş48, 145tş147t, 151ş64, 378; and
in Tigray region, 94, 96, 97t, 103, 108ş10,
community resource management, 264ş65,
116, 117tş118t, 120t, 122ş26, 132t, 134,
271ş72; credit and, 148, 150ş64; diverse
310ş11; trends since 1991, 144ş48; village
functions of, 141; extension services and,
stratification studies of, 143ş44
148, 150ş52; and income strategies, 54, 56t;
Livestock, in Kenyan highlands, 25, 65, 69t,
irrigation and, 151ş64, 393; and labor
70ş79, 72t, 197ş98, 198t; changing pat-
intensity, 56t; and land degradation, 53ş54,
terns of ownership and investment, 202ş4,
56t; and land management, 56t, 122ş23,
203t; returns/gross margins from, 209ş11,
132t, 134, 240, 327ş29; in less-favored
210t
areas, strategies for, 405ş6; literacy/education
Livestock, in Uganda, 25ş26, 172, 388
and, 151ş64; market access and, 42, 55t,
Loans. See Credit
474
INDEX
Macadamia, Kenyan production of, 26, 197,
tance and, 88, 89t; in East African high-
199
lands, 15, 16f, 379ş86; in Ethiopian high-
Mailo tenure system, in Uganda, 15, 22,
lands, 15, 16f, 400ş404; in Ethiopian
168ş70, 181, 398
highlands of Amhara, 8f (color insert),
Main Coffee Zone, of central Kenyan high-
150ş64, 222; in Ethiopian highlands of
lands, 192
Tigray, 88ş89, 89t, 91, 91f, 101ş4, 114,
Maize: Ethiopian production of, 25, 94ş96,
115t, 119, 126ş29, 130t, 131, 132t, 379;
95t; Ethiopian production of, reduced or
factor analysis of, 88ş89, 89t; favorable,
zero tillage and, 311ş13, 312t; fertilizer rec-
areas of high agricultural potential with,
ommendations for, 323; Kenyan production
strategies for, 400ş401; and income, per
of, 24, 65, 69ş74, 69t, 70, 71t, 76, 79,
capita, 127ş29, 130t, 131, 132t, 380t; and
196ş97, 196t, 201, 209, 210t; Ugandan
income strategies, 42ş44, 55t, 379ş86,
price for, 361t; Ugandan production of, 25,
380t; independence tests of, 89ş90; and
172, 361; yield, following legume cover
input use, 131, 132t, 386; institutional sup-
crop, 324ş26, 325t
port and, 88ş89, 89t; interaction with other
Major crops, 24ş25; of Ethiopia, 25; of Kenya,
development domain dimensions, 46ş49,
24ş25, 196ş97, 196t; of Uganda, 25,
85; in Kenyan highlands, 3f (color insert),
172ş75
15, 16f, 66ş68, 67t, 73ş74, 379ş86,
Malthus, Thomas, 45
400ş404; in Kenyan highlands, central,
Malthusian effects, 11, 44ş46, 81, 157, 162,
192ş93; in Kenyan highlands, western, 193;
180ş81, 258
and labor intensity, 43, 55t, 131, 132t, 380t;
Mango, Kenyan production of, 197ş98
and land degradation, 43ş44, 55t, 182,
Manure: in Ethiopian highlands of Amhara,
183tş184t, 186, 334, 379ş86, 380t; and
225, 225t, 235ş40, 237t, 239t; in Ethiopian
land management, 43, 55t, 119, 131, 132t,
highlands of Tigray, 119t, 121t, 122; in
303, 380t, 386; less favorable, areas of high
Kenyan highlands, 204ş5, 204t; nutrient
agricultural potential with, strategies for,
cycle with, 328ş29; in Uganda, 175,
401ş4; and livestock, 42, 55t, 150ş64; and
301tş302t, 303; in Uganda, program
productivity, 55t, 126ş29, 130t, 131, 132t,
participation and, 289ş91, 290t, 304ş5
182, 183tş184t, 186, 250, 380t; and pro-
Maresha (Ethiopian plow), 311ş13
gram participation, 280ş81, 288, 293ş94,
Marginal Coffee Zone, of central Kenyan
294t; in Uganda, 6f (color insert), 15, 16f,
highlands, 192
167ş68, 169f, 182, 183tş184t, 186,
Market(s): as critical variable, 27ş28; in East
283ş84, 288, 293ş94, 294t, 400ş404;
African highlands, 15ş18; for input, 17ş18;
in Ugandan district of Iganga, 360
for input, in Ethiopian highlands of Tigray,
Market imperfections: bioeconomic model
109ş10, 118ş23, 118tş121t; in Kenyan
with, 333ş56; severe, in rain-fed tropical
highlands, 15ş18, 27ş28, 60ş61, 66ş68,
agriculture, 333ş34
79; labor, 18; for output, 18; for output, in
Mbale District of Uganda, 321
Kenyan highlands, 18, 206ş7; perfect, and
Microcredit (microfinancing), in Uganda, 23,
agricultural potential, 39ş40
373
Market access, 41ş44, 379ş86; and agricultural
Millenium Ecosystem Assessment (MEA
investment, 199ş200; and community
2005), 12
resource management, 264ş65, 268,
Millet: Ethiopian production of, 94, 95t; fertil-
271ş73; as comparative advantage, 41ş44,
izer recommendations for, 323; Ugandan
84; as dimension of development domain,
price for, 361t; Ugandan production of,
46ş49, 47t, 66ş68, 81ş82, 86, 102; dis-
172, 361
INDEX
475
Miraa, Kenyan production of, 197, 215n8
services to, 278; effects of, 381t; in Kenyan
Mobile phone use, 17
highlands, western, 193; market access and,
More people, less-erosion hypothesis, 82, 388
293ş94; population density and, 293ş94; in
Mosaic virus-resistant cassava, in Iganga
Uganda, and land management, 185ş86;
District of Uganda, 361ş62
in Uganda, and productivity, 185ş86; in
Mt. Kenya, 1, 7, 191, 193
Uganda, history of, 278ş91; in Uganda,
Mucuna, 324ş25, 325t, 329
household involvement in, 283, 292t, 293;
Mulching, in Uganda, program participation
in Uganda, importance of, 303; in Uganda,
and, 289ş91, 290t
in Iganga District, 361ş62; in Uganda, main
Mules, in Ethiopian highlands, 145t
focuses of, 284ş91, 285tş287t, 289t; in
Musuveni, Yoweri, 279, 357
Uganda, number and presence of, 281ş84,
282t
Nairobi, importance of proximity to, 201ş2,
NPK. See Nitrogen, phosphorus, and potassium
206
Nutrient balance: in bioeconomic model of
Napier, Kenyan production of, 196, 196t
eastern Uganda, 358ş75; in ecologically sus-
National Agricultural Advisory Service
tainable agriculture, 374ş75n1; fertilizer
(Uganda), 24, 280
price reduction and, 366ş68, 367t; non-
National Agricultural Research Organization
negative, feasibility of, 364ş66, 373. See
(NARO, Uganda), 279
also Fertilizer; Land degradation
National Agricultural Research System
Nyando River Basin of Kenya, land degrada-
(Uganda), 374
tion in, 12, 60
National Resistance Movement (Uganda), 279
Natural capital, 37
Obote, Milton, 278ş79, 357, 400
Natural resource conditions: as outcome of
Off-farm opportunities, 42ş43, 386, 389; in
interest, 32ş33; U-shaped response to popu-
Ethiopian highlands, in less-favored area,
lation pressure, 46. See also Land degradation
336, 339ş43, 340fş341f, 342t, 354ş55; in
Natural resource management (NRM) tech-
Ethiopian highlands of Tigray, 85, 116, 136;
nologies, 50
in Kenyan highlands, 60, 78, 210, 213ş14,
Natural resource policy, 21ş22
386; and land degradation, 341f, 342ş43;
Near-infrared spectrometry, of land degrada-
and land management, 339ş43, 340f; and
tion, 12
productivity, 339ş43, 340f, 389; in Uganda,
NGOs. See Nongovernmental organizations
175, 187, 386
Niger seed, Ethiopian production of, 95t
Onions, Kenyan production of, 24ş25
Nitrogen, phosphorus, and potassium (NPK):
Ordinary least squares (OLS), in econometric
in East African highland soils, 10; fertilizer
analysis of Amhara region of Ethiopia, 229,
price reduction and, 366ş68, 367t; legume
241ş47, 245tş247t
cover crop and, 324ş26, 325t; recommen-
Organic coffee, certification of, 403
dations for Ugandan and Kenyan soils,
Outcomes, 32ş34
323ş24; replenishment of, 323 (see also Fer-
Oxen, in Ethiopia: in Amhara region, 145t,
tilizer); replenishment of, economics of,
149, 152ş54, 153t; cultural taboo against
329ş30; replenishment via livestock,
women using, 135, 311; dominance of
328ş29; in Ugandan soil, 277ş78
(oxenification), 310, 316, 318; fodder
Nonfarm opportunities. See Off-farm
resources for, 311, 314ş16; heterogeneity
opportunities
in ownership of, and community resource
Nongovernmental organizations (NGOs): defi-
management, 264ş65, 271ş73; in less-
nition of, 281; devolution of government
favored area of Andit Tid, 335ş36; reasons
476
INDEX
Oxen, in Ethiopia (continued )
in Ethiopian highlands, 13ş15, 14f, 27, 85,
for widespread use of, 311; rental of, 311; in
126; in Ethiopian highlands, in Andit Tid,
Tigray region, 94, 96, 97t, 103, 109, 116,
335; in Ethiopian highlands of Amhara,
117tş118t, 123ş25, 135; tillage by, alterna-
8f (color insert), 144, 222, 227ş28; in
tives to, 311ş18; tillage by, history of, 311
Ethiopian highlands of Tigray, 85, 91, 91f,
114, 115t, 118ş19, 126ş29, 130t, 131,
Pallisa District of Uganda, 321
132t; and income per capita, 127, 129, 130t,
Papaya, Kenyan production of, 197ş98
131, 132t, 380t; and income strategies, 45,
Parastatals, 18, 22, 207
55t, 380tş381t; independence tests of,
Participatory Demonstration and Training
89ş90; and input use, 131, 132t; interaction
Extension System (Ethiopia), 24, 148
with other development domain dimensions,
Passion fruit: Kenyan production of, 197, 201;
46ş49, 85; in Kenyan highlands, 3f (color
Ugandan production of, 25
insert), 13ş15, 14f, 27, 59ş60, 66ş68, 67t,
Pasture: in Kenyan highlands, 65, 69, 69t;
73ş74; in Kenyan highlands, central, 192,
private, in Ethiopian highlands, 146ş47,
195; in Kenyan highlands, western, 193,
146t, 155ş56, 156t, 161
195, 321; and knowledge intensity, 45; and
Peas: Ethiopian production of, 94, 95t; Kenyan
labor intensity, 44ş45, 55t, 66, 84, 118,
production of, 24ş25
131, 132t, 380tş381t; and land degradation,
Peasant associations (PAs), in Ethiopia,
11, 44ş46, 55t, 81ş82, 85, 180ş82,
143ş44, 222ş23
183tş184t, 185ş86, 380t, 387ş88, 412;
Perfect markets case, 39ş40
nd land management, 44ş46, 55t, 118ş19,
Pesticide use: in Ethiopian highlands of Tigray,
131, 132t, 240, 298, 380tş381t, 387; and
98ş99, 98t; in Uganda, determinants of,
livestock, 150ş64, 387; Malthusian effects
300, 301tş302t; in Uganda, program partic-
of, 11, 44ş46, 81, 157, 162, 180ş81, 258;
ipation and, 289ş91, 290t, 300, 304ş5
and productivity, 55t, 126ş29, 130t, 131,
Phosphorus (P): legume cover crop and,
132t, 182, 183tş184t, 185ş86, 250, 380t,
324ş26, 325t; loss in Kenyan soil, 10; loss in
387; and program participation, 283, 288,
Ugandan soil, 277ş78, 322; recommenda-
293ş94, 294t; in Uganda, 13ş15, 14f, 27,
tions for Ugandan and Kenyan soils,
167ş68, 180ş82, 183tş184t, 185ş86, 281,
323ş24; replenishment of, 323, 326
283ş84, 288, 293ş94, 294t, 298; in
Pigs: in Kenyan highlands, 197, 198t. See also
Uganda, eastern, 321; in Uganda, programs
Livestock
addressing, 284, 285tş287t, 288, 289t;
Pineapples, Ugandan production of, 25
U-shaped response of natural resource
Plan for Modernization of Agriculture
conditions to, 46
(Uganda), 23, 278, 303, 357ş58
Potassium (K): legume cover crop and, 324ş26,
Population density/pressure, 44ş46, 84,
325t; loss in Ugandan soil, 277ş78, 322;
386ş88, 412; and agricultural investment,
recommendations for Ugandan and Kenyan
199; and agriculture potential, 85; Boseru-
soils, 323ş24; replenishment of, 323
pian effects of, 81ş82, 126, 131, 185ş86,
Potatoes, Kenyan production of, 24, 65,
387, 412; and capital intensity, 45; and com-
196ş97, 196t, 209, 210t
munity resource management, 258, 264,
Poultry: in East African highlands, 25ş26; in
268, 271ş72, 387; and comparative advan-
Ethiopian highlands, 145t, 149; in Kenyan
tages, 38, 44ş46, 84; as critical variable, 27;
highlands, 197ş98, 198t, 202ş3
as dimension of development domain,
Poverty: in East African highlands, 1ş3; in
46ş49, 66ş68, 81ş82, 86, 102; in East
econometric model, 62ş63; in Ethiopia,
African highlands, 1, 3, 13ş15, 14f, 27, 59;
2ş3, 142ş43, 333; in Ethiopian highlands,
INDEX
477
policies for reducing in less-favored area,
384tş385t, 390; livestock and, 56t, 109,
333ş56; in Ethiopian highlands of Tigray,
123, 126, 185, 310ş11, 388; market access
81, 107, 116; income strategies and, 50; in
and, 55t, 126ş29, 130t, 131, 132t, 182,
Kenya, 2ş3, 59ş60, 209ş11, 320ş22; in
183tş184t, 186, 250, 380t; off-farm income
Kenya, roof types as indicator of, 65, 75ş76,
and, 339ş43, 340f, 389; as outcome of
76t; in Kenyan highlands, central, 193; in
interest, 32ş33; population density and, 55t,
Kenyan highlands, western, 193; and land
126ş29, 130t, 131, 132t, 182, 183tş184t,
degradation, 187; land use and, 63; and pro-
185ş86, 250, 380t, 387; poverty and, 187;
ductivity, 187; in Uganda, 2ş3, 187, 320ş21
program participation and, 56t, 129, 130t,
Poverty Eradication Action Plan (PEAP,
180, 185ş86, 250, 381tş382t; reduced or
Uganda), 278, 357
zero tillage and, 311ş12, 312t; research
Poverty Reduction and Rural Development
directions/implications for, 412ş15; roads
(Kenya), 79
and, 55t; social capital and, 108ş9, 127,
Precipitation-to-potential evapotranspiration
135; in Sub-Saharan Africa, 217; tenure
ratio (P/PE), in Kenyan highlands, 73
rights and, 51ş52, 56t, 181, 185ş86,
Prickly pear, as feeding resource for livestock,
220ş22, 247ş48, 251ş52, 383tş384t,
157
397; in Uganda, 26, 27t, 165ş89, 320
Private goals versus social goals, in Iganga
Program participation, 395ş96; agricultural
District of Uganda, 364ş66, 365t
potential and, 280, 293, 294t; and commu-
Private pastures, in Ethiopian highlands,
nity resource management, 264ş65, 269,
146ş47, 146t, 155ş56, 156t, 161
271, 273, 396; and income, 56t, 129, 130t,
Produce Marketing Board (Uganda), 23
381tş382t; and income strategies, 56t,
Productivity, 26, 27t; agricultural potential
381tş382t; and labor intensity, 56t, 381tş
and, 55t, 176, 380t; credit and, 56t,
382t; and land degradation, 56t, 181,
108ş10, 126, 129ş31, 130t, 132t, 133ş34,
185ş86, 381tş382t; and land management,
334, 382t, 395; in East African highlands, 1,
56t, 165ş66, 181, 185ş86, 277ş78, 281,
26, 27t; education and, 56t, 127ş31, 130t,
289ş93, 290t, 291f, 298ş305, 381tş382t;
135, 182, 183tş184t, 186ş87, 396; in
market access and, 280ş81, 288, 293ş94,
Ethiopia, 26, 27t, 217; in Ethiopian high-
294t; population density and, 283, 288,
lands of Amhara, 220ş22, 226ş27, 241ş52,
293ş94, 294t; and productivity, 56t, 129,
245tş247t; in Ethiopian highlands of Tigray,
130t, 180, 185ş86, 250, 381tş382t. See also
107ş39; extension services and, 180,
specific programs
185ş86, 249ş50; factors affecting, 55tş56t;
Program participation, in Ethiopian highlands,
farm equipment and, 56t; farm size and,
110, 114, 115t, 123, 127, 129, 130t, 135,
176ş79, 185, 248, 387; in female-headed
395
households, 127, 249, 396ş97; fertilizer
Program participation, in Uganda, 277ş307,
and, 123ş25, 390; food-for-work programs
394; agriculture- or environment-related,
and, 345, 347ş48; household endowments
284ş91, 285tş287t, 289t; CBOs, history of,
and, 56t, 108ş9, 132t, 134ş35, 383t;
280; characterization of programs, 281ş91;
income strategies and, 49ş50, 55t, 108ş10,
community service, 284, 285tş287t, 288,
126, 131ş33, 132t, 165ş66, 176, 185, 187,
289t, 304; credit-related, 284, 285tş287t,
382t; infrastructure and, 55t; irrigation and,
288, 289t, 304; econometric analysis of,
55t, 126, 132t, 133, 185, 187, 248ş49,
291ş305; econometric analysis of, concep-
381t, 392; in Kenya, 26, 27t, 320; labor
tual framework for, 291ş303; econometric
intensity and, 123, 165ş66, 176; land
analysis of, conclusions and implications of,
management and, 108, 123ş25, 165ş66,
303ş5; ethnicity and, 295, 296t, 304;
478
INDEX
Program participation (continued )
Religious influences, 36ş37, 295, 296t
explanators of organization presence, 293,
Remote sensing, of land degradation, 12
294t; by female-headed households, 295,
Research systems, agricultural, 24, 37; in
296t, 304; household involvement in, 281,
Ethiopia, 24, 317; in Kenya, 24, 323; in
282t, 283, 292, 295, 296tş297t, 304; in
Uganda, 24, 279, 323, 373ş74
Iganga District, 361ş62; and land manage-
Revised universal soil loss equation (RUSLE),
ment, 165ş66, 181, 185ş86, 277ş78,
166ş67
289ş93, 290t, 291f, 298ş305, 381tş382t;
Rice, Kenyan production of, 24
main focuses of programs, 284ş91, 285tş
Rift Valley of Kenya, 65; land use in, 8ş10;
287t; NGOs, history of, 278ş80; number
livestock in, 25
and presence of organizations, 281ş84, 282t;
Risks, strategies for reducing, 409ş12
poverty alleviation, 284, 285tş287t, 288,
Risti tenure system (Ethiopia), 138n17
289t; and productivity, 165ş66, 180,
Road(s): as comparative advantage, 42ş43;
185ş86; religion and, 295, 296t; research
density and quality, in East African high-
method for, 280ş81; types of programs and
lands, 15; in Ethiopian highlands of Tigray,
organizations, 281ş84, 282t
114, 115t; and income strategies, 55t; and
Property rights. See Tenure rights
income strategy, 42ş44; in Kenyan high-
lands, 66ş68, 79; in Kenyan highlands,
Rainfall: and agricultural potential, 86ş88, 88t,
central, 192ş93; in Kenyan highlands, west-
89ş90; averages and totals, in East African
ern, 193; and labor intensity, 43, 55t; and
highlands, 8; in Ethiopian highlands, in less-
land degradation, 43ş44, 55t; and land
favored area, 335; in Ethiopian highlands
management, 43, 55t; and productivity, 55t;
of Amhara, 144ş48, 145tş147t, 228; in
in Uganda, 6f (color insert). See also Market
Ethiopian highlands of Tigray, 87ş88, 88t,
access
91, 92f, 94ş96, 100ş103, 114, 115t; in
Roofs, as indicator of poverty/wealth: in
Kenyan highlands, 8, 73; in Kenyan high-
Ethiopian highlands of Tigray, 99, 101t,
lands, central, 192; and livestock in Ethiopia,
127; in Kenyan highlands, 65, 75ş76, 76t
144ş48, 145tş147t, 151ş64; in Uganda,
Roseires Reservoir of Sudan, siltation problems
5f (color insert), 8, 167ş68
and, 12ş13
Rangeland, 10
Reduced-form model, in econometric analysis
Sasakawa Global 2000, 311ş12
of Amhara region of Ethiopia, 234, 241ş47,
Seeds, improved: in Ethiopian highlands of
245tş247t
Amhara, 225, 225t, 235ş40, 237t, 239t; in
Reduced tillage, 391; as alternative to ox tillage,
Ethiopian highlands of Tigray, 96ş98, 98t,
311ş14; characteristics of, 311; crop prices
116, 117t, 119ş22, 119t, 121t
and, 312ş13, 317; and crop productivity,
Sesame, Ethiopian production of, 94, 95t
311ş12, 312t; economic factors encourag-
Settlements, in East African highlands, 15
ing, 317; environmental effects of, 313ş14,
Sharecropping, in Ethiopia, 221ş22, 248,
317; in Ethiopian highlands, 309ş18; in
311
Ethiopian highlands of Amhara, 225, 225t,
Sheep: in East African highlands, 25ş26; in
235ş41, 236t, 238t, 312, 391; in Ethiopian
Ethiopian highlands of Tigray, 97t; in
highlands of Tigray, 116, 117t, 118ş25,
Kenyan highlands, 197, 198t, 202ş3.
119t, 121t, 135, 311ş13, 391; by female-
See also Livestock
headed households, 240ş41, 311; policy
Siaya District of Kenya, 321; crop diversifica-
implications of, 316ş18
tion in, 202; description of, 193ş94; genera-
Relief Society of Tigray (REST), 89, 99, 100t
tion of capital in, 213ş14; livestock in, 203;
INDEX
479
percentage of food consumption from own
Sustainable land management: in East African
farm in, 212, 213t; wealth indicator criteria
highlands, strategies for, 377ş415; key issues
in, 207ş8
in, 1ş30; in Uganda, eastern, 357ş75; in
Siltation, 12ş13
Uganda, program participation and, 277ş
Social capital, 37; in Ethiopian highlands of
78, 281, 298ş305. See also Land manage-
Tigray, 108ş10, 123, 127, 135; and land
ment; specific issues, policies, and strategies
management, 123; and productivity, 108ş9,
Sweet potato: Kenyan production of, 196,
127, 135; and program participation, 295,
196t, 201, 201t; Ugandan price for, 361t;
304; in Uganda, 168
Ugandan production of, 25, 172, 361
Soil, 10; in Ethiopian highlands of Tigray, 87,
88t, 91ş93, 93f, 103; nutrient deficiencies
Tabia (Ethiopia), 105n2, 108, 111; community
in, 10; quality of, and agricultural potential,
woodlot management by, 258ş61, 260t,
87, 88t, 89ş90; types in East African high-
264ş65, 269, 272
lands, 10; in Uganda, 165ş89, 322ş23. See
Tea: Kenyan policies on, 22ş23, 206; Kenyan
also Land degradation; Land management
production of, 25, 70, 192, 201, 209, 210t
Soil bunds: in Ethiopian highlands of Amhara,
Tea-Dairy Zone, of central Kenyan highlands,
224, 224t; in Ethiopian highlands of Tigray,
192
116, 117t, 125
Technical assistance, 50, 393ş95. See also
Soil Conservation Research Project (SCRP,
Extension systems
Ethiopia), 136ş37n1, 334
Technology: choice of, structural variables in,
Soil organic matter (SOM) content, in Kenya
98ş99, 100tş101t; development domains
and Uganda, 322ş23
and, 83; in eastern Uganda, adoption of,
Sorghum: Ethiopian production of, 94ş96,
357ş75; in eastern Uganda, effects of pro-
95t; Kenyan production of, 24, 65, 196,
moted, 366ş72; in Ethiopian highlands of
196t; Ugandan price for, 361t; Ugandan
Tigray, 96ş99, 98t, 103. See also specific types
production of, 172, 361
Teff: Ethiopian production of, 25, 94ş96, 95t,
Soroti District of Uganda, 321
379; Ethiopian tillage practices for, 311ş13
Southern Nations, Nationalities and People's
Telecommunications, 17
Region (SNNPR), 38
Temperatures, 8. See also Climate
Spatial autocorrelation, 78
Temporary land leases, in Ethiopia, 221ş23
Stall feeding, in Ethiopian highlands, 147ş48,
Tenure rights, 15, 21ş22, 28, 51ş53, 397ş98,
147t, 150, 159, 159t, 161
411ş12; and access to credit, 52; as critical
Stone terraces, 389; in Ethiopian highlands of
variable, 28; discrimination against women,
Amhara, 224, 224t, 240ş41; in Ethiopian
411; and income strategies, 35ş36, 51ş53,
highlands of Tigray, 116, 117t, 123ş25,
56t, 383t; and labor intensity, 56t, 384t;
134ş35
and land degradation, 56t, 181, 186, 383t;
Stover yield, following legume cover crop,
and land investments, 224ş25, 224t; and
324ş26, 325t
land management, 35ş36, 51ş53, 56t,
Straw quality, improvements in Ethiopia,
220ş22, 225ş26, 225t, 235, 247ş48, 299,
314ş15, 317
383tş384t, 397ş98; and livestock, 150ş64,
Sudan, siltation problems in, 12ş13
397; and productivity, 51ş52, 56t, 181,
Sugar cane: Kenyan production of, 25, 70, 196,
185ş86, 220ş22, 247ş48, 251ş52,
196t; Ugandan production of, 172
383tş384t, 397
Sunflower, Ethiopian production of, 94, 95t
Tenure rights, in Ethiopia, 15, 22, 28, 36,
Sustainable Agriculture and Environmental
220ş22, 397, 411ş12; in Amhara region,
Rehabilitation Program (Ethiopia), 161ş62
220ş26, 224tş225t, 227t, 235, 251ş52,
480
INDEX
Tenure rights (continued )
127ş31, 130t, 132t, 135, 396; extension
397; in Amhara region, input use by, 226,
services in, 114, 115t, 132t, 134ş35, 148,
227t, 240ş41; in Amhara region, land
394; farm size in, 107, 114, 126; female-
investments by, 224ş25, 224t; in Amhara
headed households in, 115t, 127, 135ş36,
region, land management by, 225ş26, 225t,
138ş39n26; fertilizer use in, 96ş98, 98t,
235; in Amhara region, productivity by,
116, 117t, 118ş19, 118t, 120t, 123ş25,
247ş48, 251ş52; in less-favored area of
131ş34, 132t; grazing land in, community,
Andit Tid, 336; and livestock, 150ş64; risti
258ş75; household endowments in, 108ş10,
system of, 138n17; in Tigray region, 85,
132t, 134ş35; household size, average, in,
114, 138n17, 142ş43, 411ş12; and tree
114, 115t; improved seed use in, 96ş98, 98t,
growing, 349
116, 117t, 119ş22, 119t, 121t; income per
Tenure rights, in Kenya, 15, 21, 28, 195
capita in, 110ş11, 115t, 116; income per
Tenure rights, in Uganda, 15, 21ş22, 28,
capita in, determinants of, 127ş31, 128t,
168ş70, 181, 186, 279, 299, 398, 412
130t; income per day in, 107; income per
Three-stage least squares (3SLS), 94, 95t
household in, 115t; income strategies in,
Tigray People's Liberation Front (TPLF), 107
108ş10, 116, 119ş22, 126ş27, 131ş33,
Tigray Regional Bureau of Agriculture and
132t, 142; input use in, 109ş10, 118ş23,
Natural Resources (TBoANR), 260, 269
118tş121t, 131ş34, 132t; intercropping in,
Tigray region of Ethiopia: agricultural potential
118, 119t, 121t, 131, 132t; investment and
in, 87ş88, 88t, 100ş104; altitude of, 87ş88,
conservation program in, 107ş8; irrigation
88t, 91, 92f, 94ş96, 114, 115t; area enclo-
in, 99, 101t, 122, 126, 132t, 133, 392ş93;
sures in, 315ş16; burning to prepare fields
kushets in, 83, 105n2; labor intensity in,
in, 116, 117t, 119t, 121t, 123, 131, 132t,
118ş19, 118t, 120t, 123; land degradation
135, 391; cash crops in, 94; climate of, 1,
in, 81, 91ş92, 93f, 107, 136ş37n1, 258ş59;
81, 85, 87ş88; community labor mass-
land management in, 107ş39, 118tş121t,
mobilization campaigns in, 138n20; com-
389ş91; land use in, 81, 93ş102; literacy
munity resource management in, 258ş75,
in, 99, 101t, 114, 115t; livestock in, 94, 96,
406; comparative advantage of, 136; contour
97t, 103, 108ş10, 116, 117tş118t, 120t,
plowing in, 116, 117t, 119t, 121t, 131,
122ş26, 132t, 134, 310ş11; manure/
132t; credit use in, 88ş89, 99, 100t, 101,
composting in, 119t, 121t, 122; market
103ş4, 108ş10, 114, 115t, 122, 126,
access in, 88ş89, 89t, 91, 91f, 101ş4, 114,
129ş31, 130t, 132t, 133ş34, 395; crop
115t, 119, 126ş29, 130t, 131, 132t, 379;
choices and patterns in, 94ş96, 95t, 103;
nonfarm opportunities in, 85, 116, 136;
crop production in, 107ş39; crop produc-
population density of, 85, 91, 91f, 114,
tion in, average, 118; crop production in,
115t, 118ş19, 126ş29, 130t, 131, 132t;
determinants of, 123ş27, 124tş125t; decen-
poverty in, 81, 107, 116; production systems
tralization and autonomy in, 38, 258ş59;
in, 93ş102; program participation in, 110,
descriptive statistics of households in, 115t;
114, 115t, 123, 127, 129, 130t, 135, 395;
descriptive statistics of plots in, 117t;
rainfall in, 87ş88, 88t, 91, 92f, 94ş96, 114,
droughts in, 85; econometric analysis of,
115t; reduced or zero tillage in, 116, 117t,
107ş39; econometric analysis of, data
118ş25, 119t, 121t, 135, 311ş13, 391; roof
sources for, 111; econometric analysis of,
types and quality in, 99, 101t, 127; socio-
methods of, 111ş13; econometric analysis
economic conditions in, 82, 114ş18, 115t;
of, predicted impacts of selected variables
soil and water conservation in, 99, 103, 116,
in, 113; econometric analysis of, results of,
136ş37n1, 259, 389ş90; soil bunds in, 116,
118ş27; education in, 99, 101t, 114, 115t,
117t, 125; soil quality in, 87, 88t, 91ş93,
INDEX
481
93f, 103; stone terraces in, 116, 117t,
Reform Plan, 278; development domains
123ş25, 134ş35; tabias in, 105n2, 108,
in, 5f (color insert), 167ş68, 176, 180, 281,
111; technology choice in, 96ş99, 98t, 103;
360; devolution of government services in,
tenure rights in, 85, 114, 138n17, 142ş43,
277ş78, 303; donor funding for, 18ş19, 24;
411ş12; tree growing in, 258ş69, 272ş75,
eastern (see Eastern Uganda); econometric
348ş49, 404, 406; unrest and strife in, 107;
analysis of, 165ş89; econometric analysis of,
village development domains in, 81ş106,
conceptual framework and methodology of,
93t; welfare implications in, 99, 101t; wood-
166ş72; econometric analysis of, data for, 6f
lots in, community, 258ş69, 272ş75;
(color insert), 170ş71; econometric analysis
woredas (districts) in, 111, 131
of, descriptive variables used in, 173tş175t;
Tithonia diversifolia, 326ş27, 331, 391ş92
econometric analysis of, empirical model for,
Tobacco, Ugandan production of, 172
166ş68; econometric analysis of, explana-
Tomatoes, Kenyan production of, 24ş25,
tory variables in, 167ş68; econometric
196ş97, 196t
analysis of, hypotheses in, 168ş72; econo-
Tororo District of Uganda, 321
metric analysis of, results of, 176ş87,
Trade Union Act of 1970 (Uganda), 279
177tş179t; economic growth in, 2ş3, 320,
Trade unions, in Uganda, 278ş79
357; education in, 182, 183tş184t, 186ş87,
Tree canopy cover, in Kenyan highlands, 4f
396; exchange rates and capital flow in, 20;
(color insert), 64, 70, 77, 77t
extension system of, 24, 180, 185ş86,
Tree growing, 26; in Ethiopia, 26, 262ş63,
279ş80, 394; farm size in, 15, 176ş79;
316, 389, 404, 406; in Ethiopia, combined
female-headed households in, 295, 296t,
effect with food-for-work program, 350ş52,
298, 303ş4; fertilizer price in, 359, 361t;
353fş354f, 355; in Ethiopia, in community
fertilizer price in, effects of decreasing,
woodlots, 258ş69, 272ş75; in Ethiopia,
366ş68, 367t; fertilizer price in, relation to
stimulation in less-favored area, 348ş52,
output (crop) prices, 369ş72, 371f; fertilizer
351fş354f, 355; in Kenyan highlands, 26,
use in, 17, 289ş91, 290t, 301tş302t, 303,
198ş99, 201, 210ş11, 389
323ş24, 390ş91; formal title to land in,
Tutsi-Hutu conflict, 13
170, 186; freehold system in, 168ş70, 181,
398, 412; high-potential bimodal rainfall
Uganda: agricultural potential in, 5f (color
area at moderate elevation, 167ş68, 281;
insert), 167ş68, 176, 281, 293, 294t, 298,
high-potential bimodal rainfall southwestern
378, 400ş407; agricultural research in, 24,
highlands, 167ş68, 281; high-potential uni-
279, 323, 373ş74; agricultural sector poli-
modal rainfall eastern highlands, 167ş68,
cies of, 23, 28, 278; agroclimatic zones of,
281; HIV/AIDS incidence and death rates
5f (color insert), 167ş68, 176, 180, 281;
in, 13; household endowments in, 168;
altitude of, 6ş7, 7f, 167ş68; biomass trans-
income in, 2, 320ş21; income strategies
fer in, 326ş27; cash crops of, 25, 172ş75;
in, 165ş66, 168, 172ş76, 179ş80, 187,
"cattle corridor" of, 172; church-based action
388ş89; inflation in, 20; information access
in, 279; Cooperative Societies Act (1963),
in, 374; international relations and macro
279; credit availability in, 23, 369ş72, 371f,
policies of, 18ş20; labor use in, 165ş66,
395; credit availability in, programs address-
176; Lake Victoria crescent, 167ş68, 280,
ing, 284, 285tş287t, 288, 289t, 304; crop
321, 378; Land Act of 1998, 15, 169ş70;
choices in, 165ş66, 172ş75; crop rotation
land degradation in, 11ş13, 165ş89,
in, 175; customary land in, 168ş70; decen-
277ş78, 322ş23, 357ş58; land degradation
tralization of governance in, 20, 277ş78,
in, determinants of, 177tş179t; land degra-
280, 303; Decentralization of Public Service
dation in, programs focusing on, 284ş91,
482
INDEX
Uganda (continued )
telecommunications in, 17; tenure rights in,
285tş287t, 289t; land degradation in, strate-
15, 21ş22, 28, 168ş70, 181, 186, 279, 299,
gies for reducing, 181ş85; land management
398, 412; Trade Union Act (1970), 279;
in, 165ş66, 172ş75, 181, 185ş86, 277ş78,
trees and other agricultural products in, 26;
281, 289ş91, 290t, 319ş31, 357ş75,
Tutsi-Hutu conflict in, 13; work force
390ş91; leasehold system in, 168ş70;
engaged in agriculture in, 2
legume cover crops in, 324ş26; livestock
Uganda, programs and organizations in,
in, 25ş26, 172, 388; low- and very low-
277ş307, 394; agriculture- or environment-
potential unimodal rainfall region at moder-
related, 284ş91, 285tş287t, 289t; CBOs,
ate elevation, 167ş68, 281; lowlands versus
history of, 280; CBOs, number and presence
highlands, 182ş85, 184t; low-potential
of, 281ş84, 282t; characterization of,
bimodal rainfall area at moderate elevation,
281ş91; community service, 284, 285tş
167ş68, 281; mailo land in, 15, 22, 168ş70,
287t, 288, 289t, 304; credit-related, 284,
181, 398; major crops of, 25, 172ş75;
285tş287t, 288, 289t, 304; econometric
market access in, 6f (color insert), 15,
analysis of, 291ş305; econometric analysis
16f, 167ş68, 169f, 182, 183tş184t, 186,
of, conceptual framework for, 291ş303;
283ş84, 288, 293ş94, 294t, 400ş404;
econometric analysis of, conclusions and
medium-potential bimodal rainfall area at
implications of, 303ş5; education and, 295,
moderate elevation, 167ş68, 281; medium-
296t; ethnicity and, 295, 296t, 304; explana-
potential unimodal rainfall region at moder-
tors of presence, 293, 294t; by female-
ate elevation, 167ş68, 281; microfinancing
headed households, 295, 296t, 304; house-
in, 23, 373; National Agricultural Advisory
hold involvement in, 281, 282t, 283, 292,
Service, 24, 280; National Agricultural
295, 296tş297t, 304; in Iganga District,
Research Organization, 279; natural resource
361ş62; and land management, 165ş66,
policy in, 21ş22; new technology adoption
181, 185ş86, 277ş78, 281, 289ş93, 290t,
in, 357ş75; nonfarm opportunities in, 175,
291f, 298ş305; main focuses of, 284ş91,
187, 386; per capita national income in, 2;
285tş287t; NGOs, history of, 278ş80;
percent of population undernourished in, 2;
NGOs, number and presence of, 281ş84,
Plan for Modernization of Agriculture, 23,
282t; and productivity, 165ş66, 180,
278, 303, 357ş58; plot-level factors in, 168,
185ş86; religion and, 295, 296t; research
176; population density of, 13ş15, 14f, 27,
method for, 280ş81; types of, 281ş84, 282t
167ş68, 180ş82, 183tş184t, 281, 283ş84,
Ugandan Farmer's Association, 278ş79
288, 293ş94, 294t, 298; population density
Ugandan highlands: altitude and topography
of, programs addressing, 284, 285tş287t,
of, 6ş7, 7f; cash crops of, 25; climate of, 8,
288, 289t; Poverty Eradication Action Plan,
27; critical variables in, 27ş28; dairy produc-
278, 357; poverty in, 2ş3, 187, 320ş21;
tion in, 26; description of, 6ş28; develop-
poverty programs in, 284, 285tş287t, 288,
ment domains in, 167ş68; fertilizer use in,
289t; private foreign investment in, 18ş19;
17; geography of, 6ş13; growing period
productivity in, 26, 27t, 165ş89, 320; pro-
length in, 8, 9f; land use in, 8ş10; liveli-
ductivity in, determinants of, 176ş80,
hoods and agricultural systems in, 24ş26;
177tş179t; productivity in, strategies for
major crops of, 25; market(s) in, 15ş18,
increasing, 181ş85; programs and organiza-
27ş28; market access in, 15, 16f; markets
tions in (see Uganda, programs and organi-
for input, 17ş18; markets for output, 18;
zations in); rainfall in, 5f (color insert), 8,
population density of, 13ş15, 14f, 27; rain-
167ş68; soil erosion in, 166ş67, 180ş81;
fall totals and averages in, 8; soils in, 10. See
soil quality in, 10, 165, 277ş78, 322ş23;
also Uganda
INDEX
483
Upward spiral, 33
196t; market access in, 193; nutrient invest-
Urban associations, in Uganda, 278ş79
ments in, 204ş5; outflow/outmigration of
Urea-treated straw, 314, 327ş28
men from, 193ş94, 321ş22; phosphorus
replenishment in, 326; political and eco-
Value of agricultural productivity. See
nomic marginalization of, 321ş22; popula-
Productivity
tion density of, 193, 195, 321; poverty in,
Vanilla, Ugandan production of, 23, 25
193, 321ş22; rainfall in, 193; soil fertility
Veterinary clinics, in Ethiopian highlands, 148
status in, 322ş23; wealth indicator criteria
Vihiga District of Kenya, 321; crop diversifi-
in, 207ş8
cation in, 202; description of, 193ş94;
Wheat: Ethiopian production of, 25, 94ş96,
economics of land management in, 329;
95t; Ethiopian tillage practices for, 313
generation of capital in, 213ş14; livestock
Women. See Female-headed households
in, 203; percentage of food consumption
Women's Bureau of Agriculture (Ethiopia),
from own farm in, 212, 213t; wealth indi-
100t
cator criteria in, 207ş8
Woodlands, 8ş10
Village management, of community woodlots,
Woodlots, in Kenyan highlands, 69ş79, 69t,
258ş61, 260t, 264ş65, 269, 272
73t
Village stratification: in Ethiopian highlands
Woodlots, community, 406; allowable uses on,
of Amhara, 222ş23; in Ethiopian highlands
261; benefits received from, 262ş63; charac-
of Tigray, 81ş106, 93t; and intensification of
teristics of, 260, 260t; in Ethiopian high-
agriculture, 82ş83; for livestock studies in
lands of Tigray, 258ş69, 272ş75; guards for,
Ethiopia, 143ş44; methods and data for,
261, 267t, 268ş69; labor input for, 266ş68,
86ş87; in Uganda, 167ş68; usefulness
267t; number of trees planted per hectare,
of, 82
267t; results of econometric analysis of,
Virtuous circle, 33, 400
266ş69, 267t; summary of statistics on,
273; survival rate of, 266, 267t, 268; village-
Weather risks, 409ş10
versus tabia-managed, 258ş61, 260t,
Weed control, with zero tillage, 311ş13
264ş65, 269, 272; violation of restrictions
Welfare indicators: as outcome of interest,
on, 261, 267t, 268ş69
32ş33; research directions/implications for,
Woreda (Ethiopia), 8f (color insert), 20, 111,
412ş15. See also specific types
131, 222
Western highlands of Kenya, 7f (color insert),
World Bank: carbon sequestration projects
65, 194ş95, 321ş22; agricultural investment
financed by, 318; support for Kenya, 19,
in, 199ş214; biomass transfer in, 326ş27;
24; support for Uganda, 18ş19, 24
versus central, comparative analysis of,
World Commission on Environment and
205ş14, 212t; crop diversification in,
Development, 45
201ş2; cropping seasons in, 193; description
of, 193ş94, 321ş22; education in, 396;
Zero tillage: as alternative to ox tillage, 311ş14;
female-headed households in, 194ş95, 396;
characteristics of, 311; crop prices and,
fertilizer recommendations for, 323ş24;
312ş13, 317; and crop productivity,
generation of capital in, 213ş14; household
311ş12, 312t; economic factors encourag-
factors in, 207ş10; land management in,
ing, 317; environmental effects of, 313ş14,
319ş31; legume cover crops in, 324ş26;
317; in Ethiopian highlands, 309ş18; policy
livestock in, 203; major crops of, 196ş97,
implications of, 316ş18
Document Outline
- pender front.pdf
- pender chap01.pdf
- pender chap02.pdf
- pender chap03.pdf
- pender chap04.pdf
- pender chap05.pdf
- pender chap06.pdf
- pender chap07.pdf
- pender chap08.pdf
- pender chap09.pdf
- pender chap10.pdf
- pender chap11.pdf
- pender chap12.pdf
- pender chap13.pdf
- pender chap14.pdf
- pender chap15.pdf
- pender chap16.pdf
- pender references.pdf
- pender index.pdf
- pender contribs.pdf